

Solana Price Forecast: Bearish grip tightens on SOL amid broader market sell-off

Nguồn Fxstreet
  • Solana extends losses below $80 on Friday, continuing a corrective phase over the last six weeks, down 35%.
  • A broader market correction, with over $1 billion in total liquidations over the last 24 hours, weighs on SOL.
  • Derivatives data points to a sell-side dominance with heavy outflows and a declining taker buy-to-sell ratio.

Solana (SOL) is down 4% on Friday, extending losses below $80 and marking a nearly 10% decline so far this week. The broader cryptocurrency market is seeing heavy selling, with Bitcoin (BTC) diving below $70,000 and wiping out more than $1 billion in the derivatives market. This adds to the sell-side dominance in SOL futures amid persistent outflows. The technical outlook for SOL is bearish as downside momentum remains firm despite the asset entering oversold territory.

Crypto market liquidations cross $1 billion in 24 hours

Bitcoin’s slip below $70,000 on Friday mirrors Nvidia's decline, as CEO Jensen Huang resigns amid public and board scrutiny over personal relationships. CoinGlass data shows that the pullback wiped out $1.41 billion over the last 24 hours, with $1.26 billion in longs, reflecting a clear selling bias. 
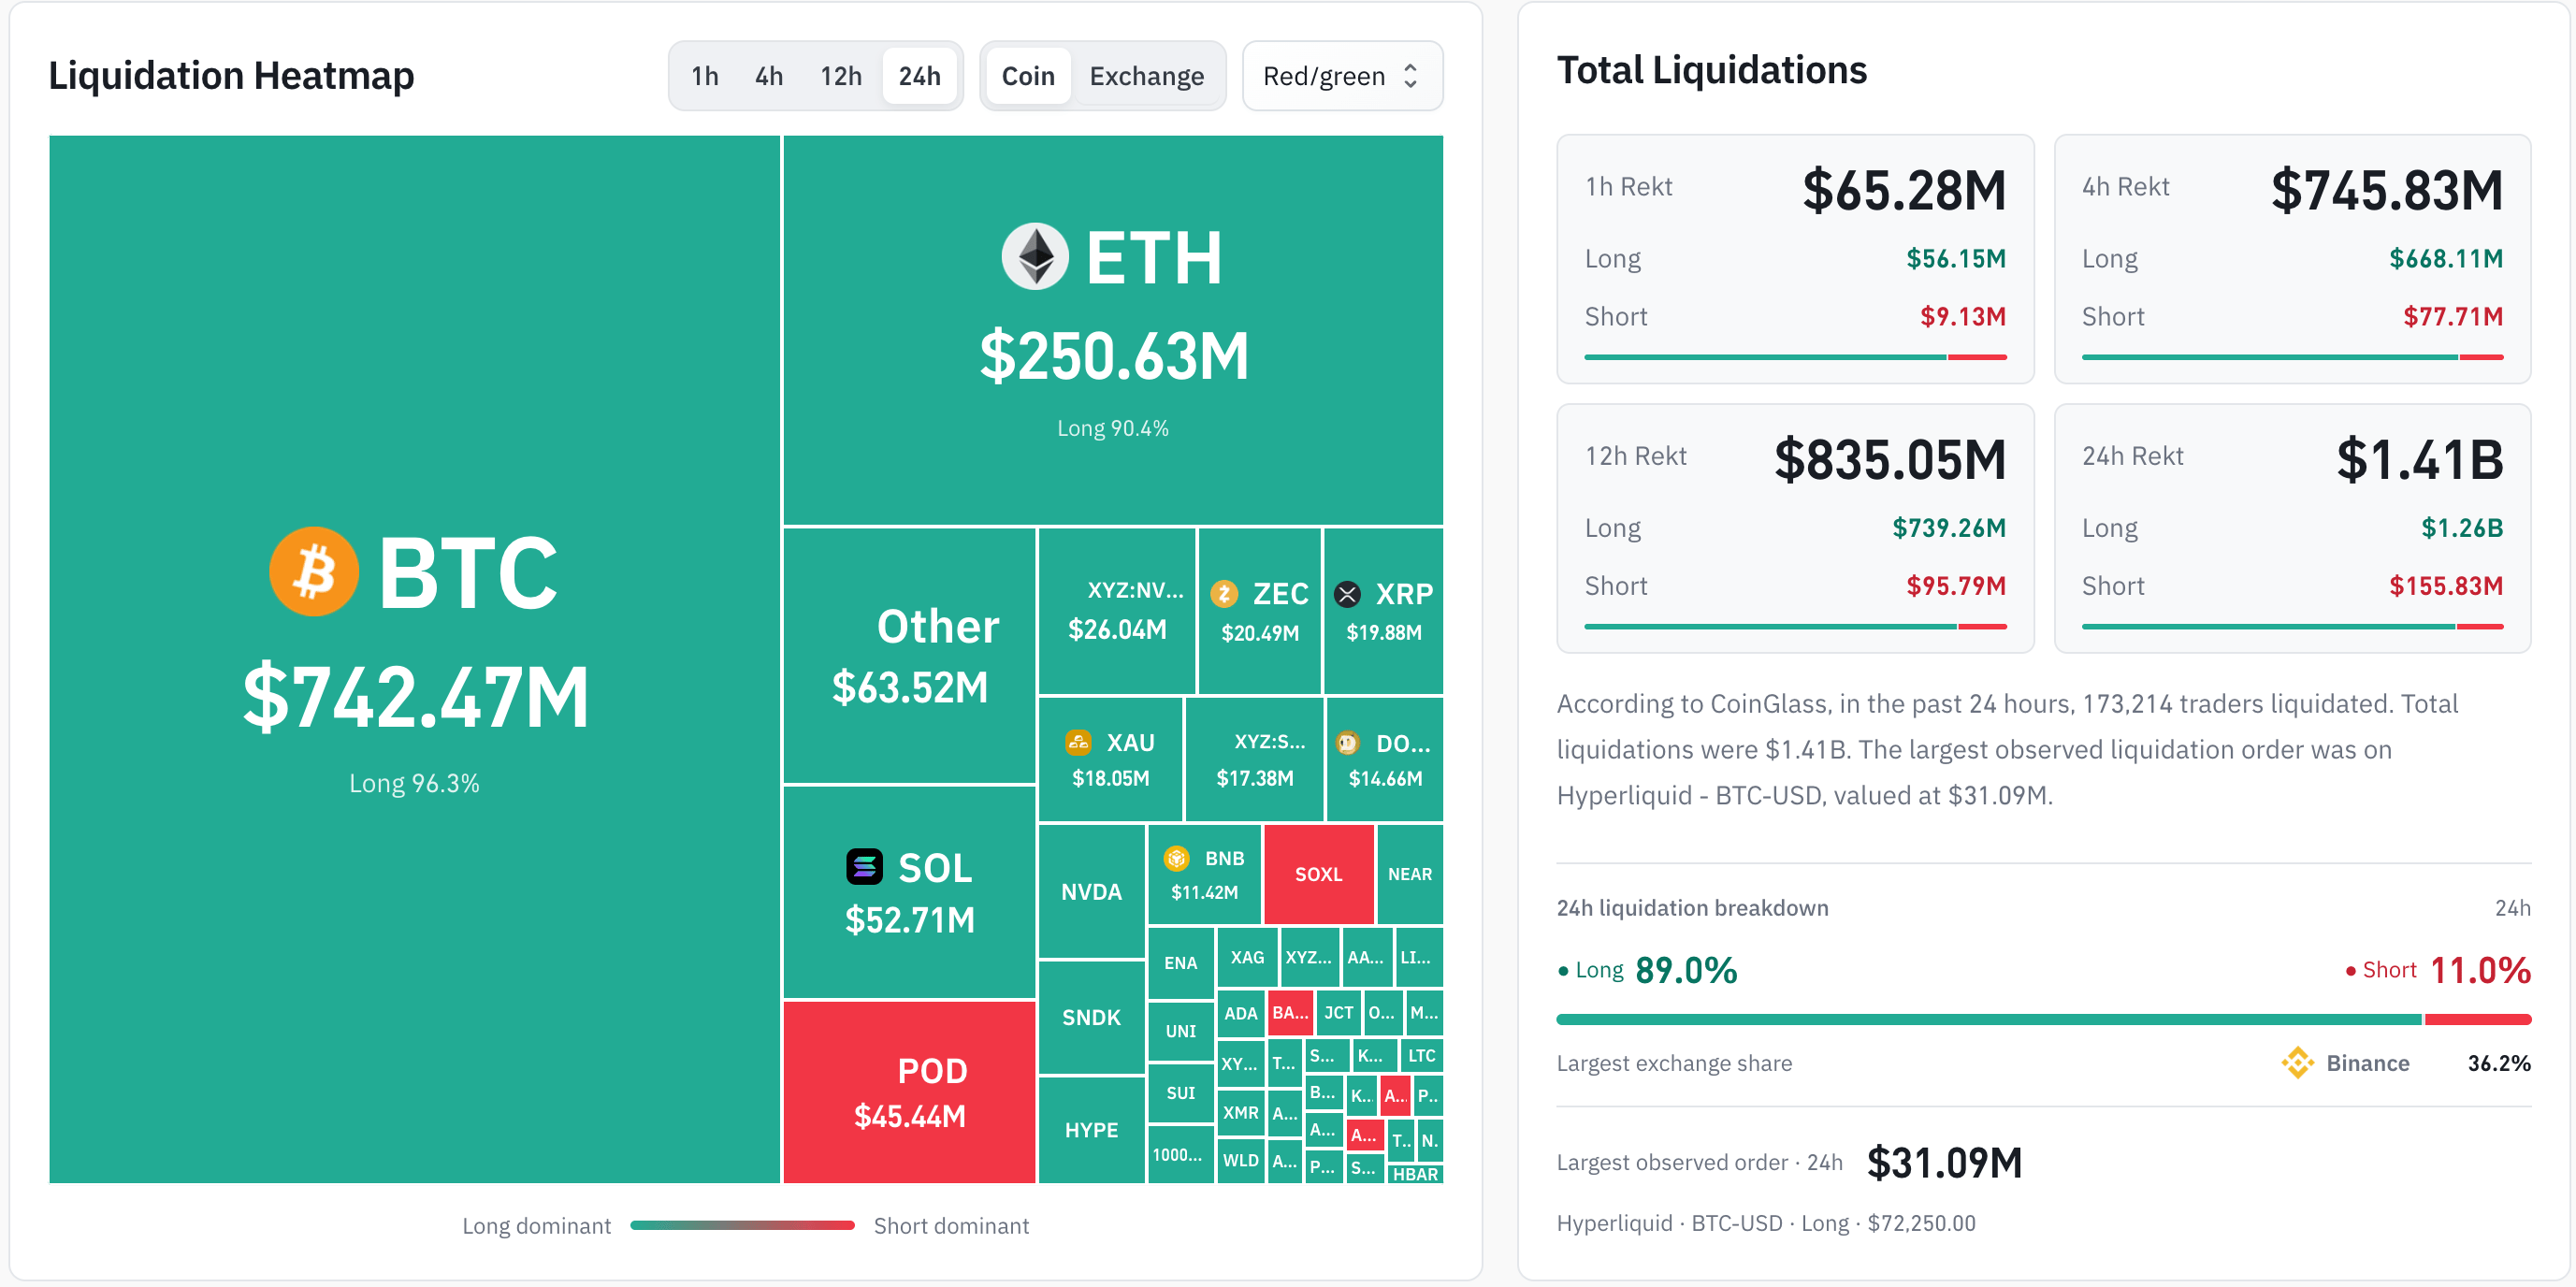
Crypto liquidation data. Source: CoinGlass

In the case of Solana, futures have seen $191 million in outflows so far on Friday, while spot market outflows have reached $8.80 million. In addition, the SOL taker buy-to-sell ratio around 0.90 has remained below 1 since late July, indicating a firm bearish bias among traders.

Taken together, the risk-off sentiment in the derivatives market strengthens amid uncertain broader market and macroeconomic conditions.
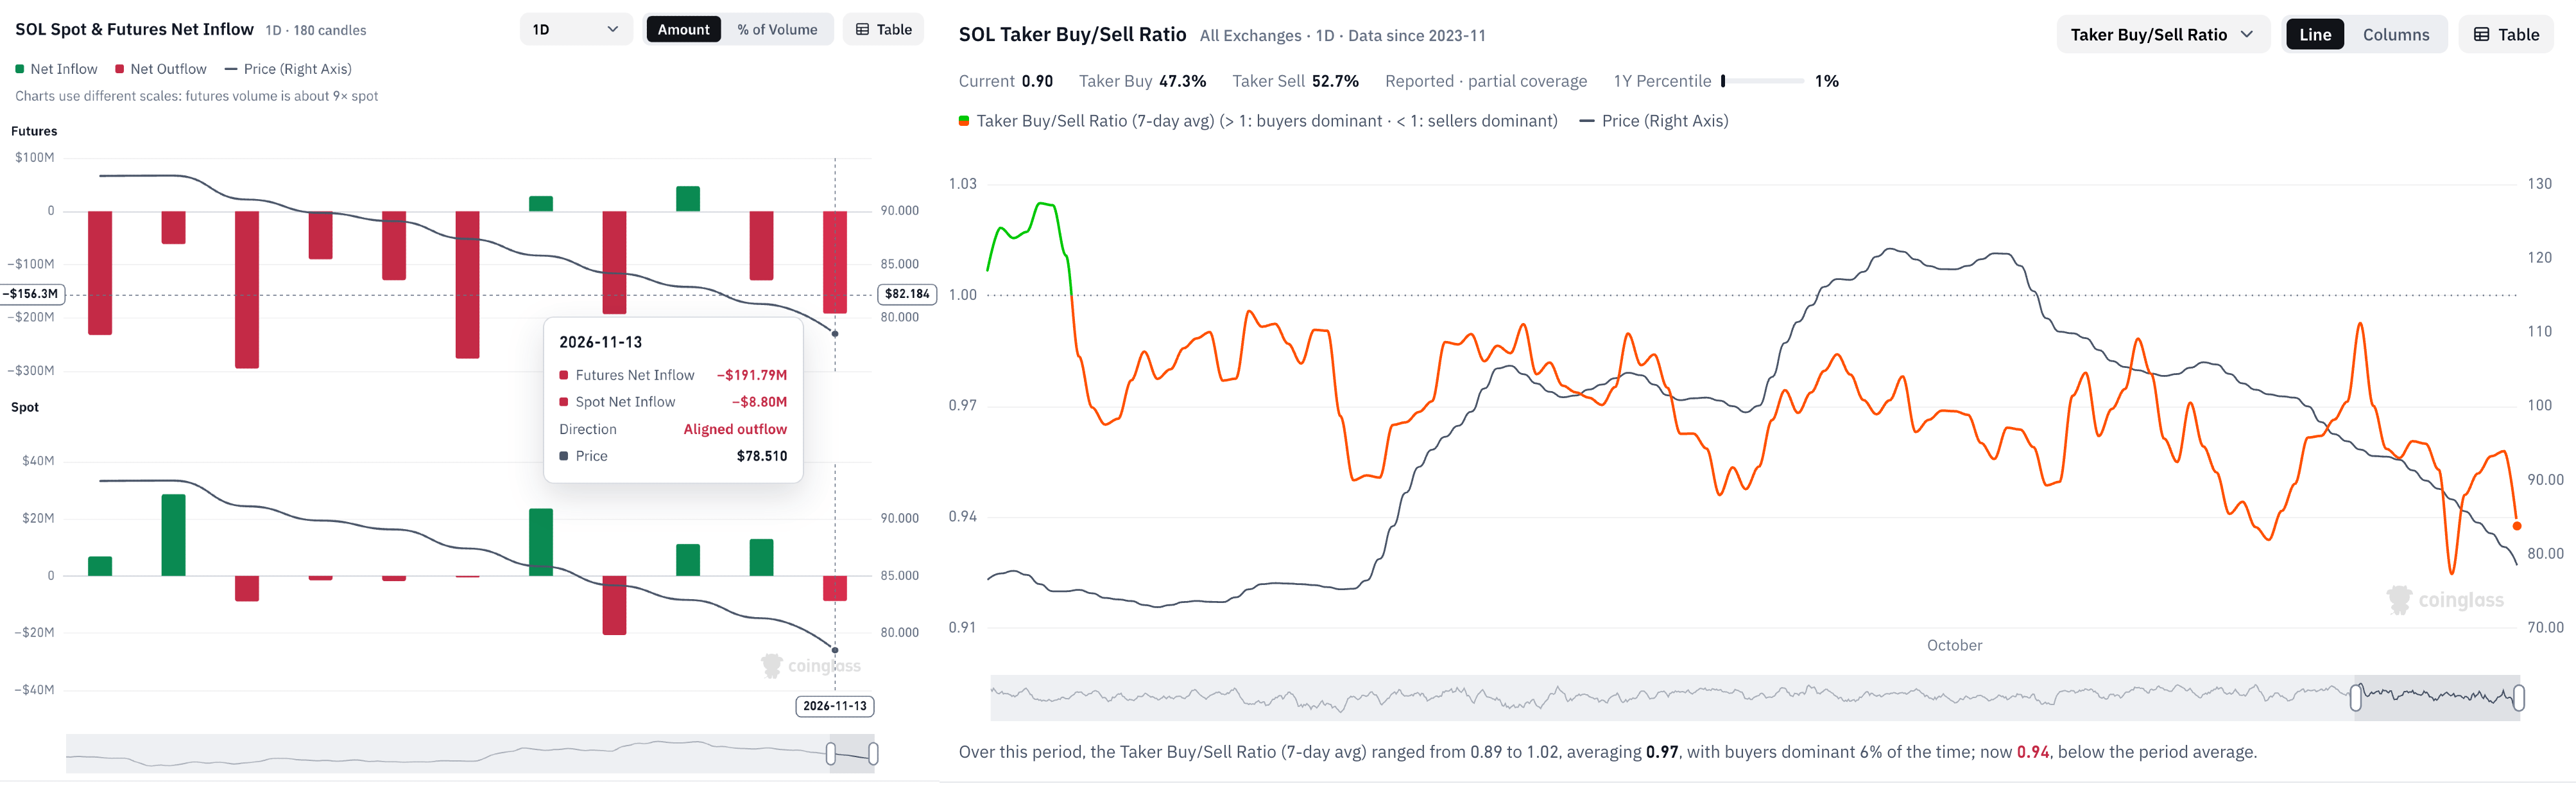
SOL derivatives data. Source: CoinGlass

Technical outlook: Will SOL crash to $70?

Solana hovers around $78.33 on Friday, continuing its steady decline after peaking above $120 in early October. The 50-day Exponential Moving Average (EMA) at $97.55 has fallen below the 200-day EMA at $98.62, forming a Death Cross pattern that indicates a bearish trend reversal.

The pair has also slipped beneath a previously supporting ascending trendline, now a broken barrier near $91.20, reinforcing the notion of a completed upswing. The immediate support for SOL stands at the $77.60 horizontal level, where a confirmed breakout could extend downside risk to $67.50.

Momentum conditions remain heavy, with the Relative Strength Index (RSI) pressed into oversold territory around 19 and the Moving Average Convergence Divergence (MACD) staying below zero, with the signal line at -0.96, hinting that selling pressure is gaining traction.

Chart Analysis SOL/USDT (Binance)
SOL/USDT daily price chart.

On the topside, initial resistance emerges at $87.46, followed by the horizontal cap at $95.82, before the more congested band of the 50-day and 200-day EMAs at $97.55 and $98.62 steps in as trend-defining supply.

(The technical analysis of this story was written with the help of an AI tool. Know more.)

Tuyên bố miễn trừ trách nhiệm: Chỉ dành cho mục đích thông tin. Hiệu suất trong quá khứ không đảm bảo cho kết quả trong tương lai.
placeholder
Forex hôm nay: Quyết định lãi suất của ECB, dữ liệu lạm phát sản xuất của Mỹ sẽ làm tăng biến độngĐây là những gì bạn cần biết vào thứ Năm, ngày 10 tháng 9:
Tác giả  FXStreet
9 tháng 10 ngày Thứ Năm
Đây là những gì bạn cần biết vào thứ Năm, ngày 10 tháng 9:
placeholder
WTI đạt mức tăng khiêm tốn trên mức 88,50$ nhờ mức giảm bất ngờ của EIA, xung đột ở Trung Đông được chú ýWest Texas Intermediate (WTI), chuẩn dầu thô của Mỹ, đang giao dịch quanh mức 88,55$ trong đầu phiên giao dịch châu Á vào thứ Năm. WTI ghi nhận mức tăng khiêm tốn khi tồn kho dầu thô Mỹ bất ngờ giảm vào tuần trước
Tác giả  FXStreet
10 tháng 08 ngày Thứ Năm
West Texas Intermediate (WTI), chuẩn dầu thô của Mỹ, đang giao dịch quanh mức 88,55$ trong đầu phiên giao dịch châu Á vào thứ Năm. WTI ghi nhận mức tăng khiêm tốn khi tồn kho dầu thô Mỹ bất ngờ giảm vào tuần trước
placeholder
Giá vàng lao dốc về mốc 4.000 USD khi CPI nóng hơn dự kiến thúc đẩy kỳ vọng Fed tăng lãi suất, phe mua nhắm tới ngưỡng hỗ trợ 3.975 USDTính đến phiên giao dịch châu Á vào thứ Tư (ngày 11/11), giá vàng (XAUUSD) đã phục hồi nhẹ sau đà giảm mạnh trong phiên trước đó, hiện giao dịch quanh mức 4.040 USD, tăng khoảng 0,3% tron
Tác giả  TradingKey
11 tháng 11 ngày Thứ Tư
Tính đến phiên giao dịch châu Á vào thứ Tư (ngày 11/11), giá vàng (XAUUSD) đã phục hồi nhẹ sau đà giảm mạnh trong phiên trước đó, hiện giao dịch quanh mức 4.040 USD, tăng khoảng 0,3% tron
placeholder
Giá vàng nối dài đà giảm xuống dưới 4.000 USD khi lạm phát Mỹ gia tăng và kỳ vọng Fed tăng lãi suất vào tháng 12 gây áp lực lên giáNgày 12/11, giá vàng (XAUUSD) nối dài đà giảm gần đây, tụt sâu hơn xuống dưới ngưỡng 4.000 USD trong đầu phiên giao dịch châu Á và chạm mức thấp nhất trong ngày gần 3.968 USD, đánh dấu ph
Tác giả  TradingKey
Hôm qua 02: 13
Ngày 12/11, giá vàng (XAUUSD) nối dài đà giảm gần đây, tụt sâu hơn xuống dưới ngưỡng 4.000 USD trong đầu phiên giao dịch châu Á và chạm mức thấp nhất trong ngày gần 3.968 USD, đánh dấu ph
placeholder
Vàng giảm xuống mức thấp nhất hơn một năm dưới 3.900$ trong bối cảnh lo ngại lạm phát, sắp công bố dữ liệu PPI của MỹGiá vàng (XAU/USD) giảm xuống mức đáy hơn một năm khoảng 3.880$ trong phiên giao dịch đầu ngày thứ Sáu ở châu Á. Những lo ngại dai dẳng về lạm phát tại Mỹ và kỳ vọng lãi suất cao hơn đang đè nặng lên kim loại quý.
Tác giả  FXStreet
4 giờ trước
Giá vàng (XAU/USD) giảm xuống mức đáy hơn một năm khoảng 3.880$ trong phiên giao dịch đầu ngày thứ Sáu ở châu Á. Những lo ngại dai dẳng về lạm phát tại Mỹ và kỳ vọng lãi suất cao hơn đang đè nặng lên kim loại quý.
sản phẩm liên quan
goTop
quote