


Pump.fun Price Forecast: PUMP rises despite subdued retail demand
- Pump.fun rebounds to near $0.0036 on Wednesday, building on the 200-day EMA support.
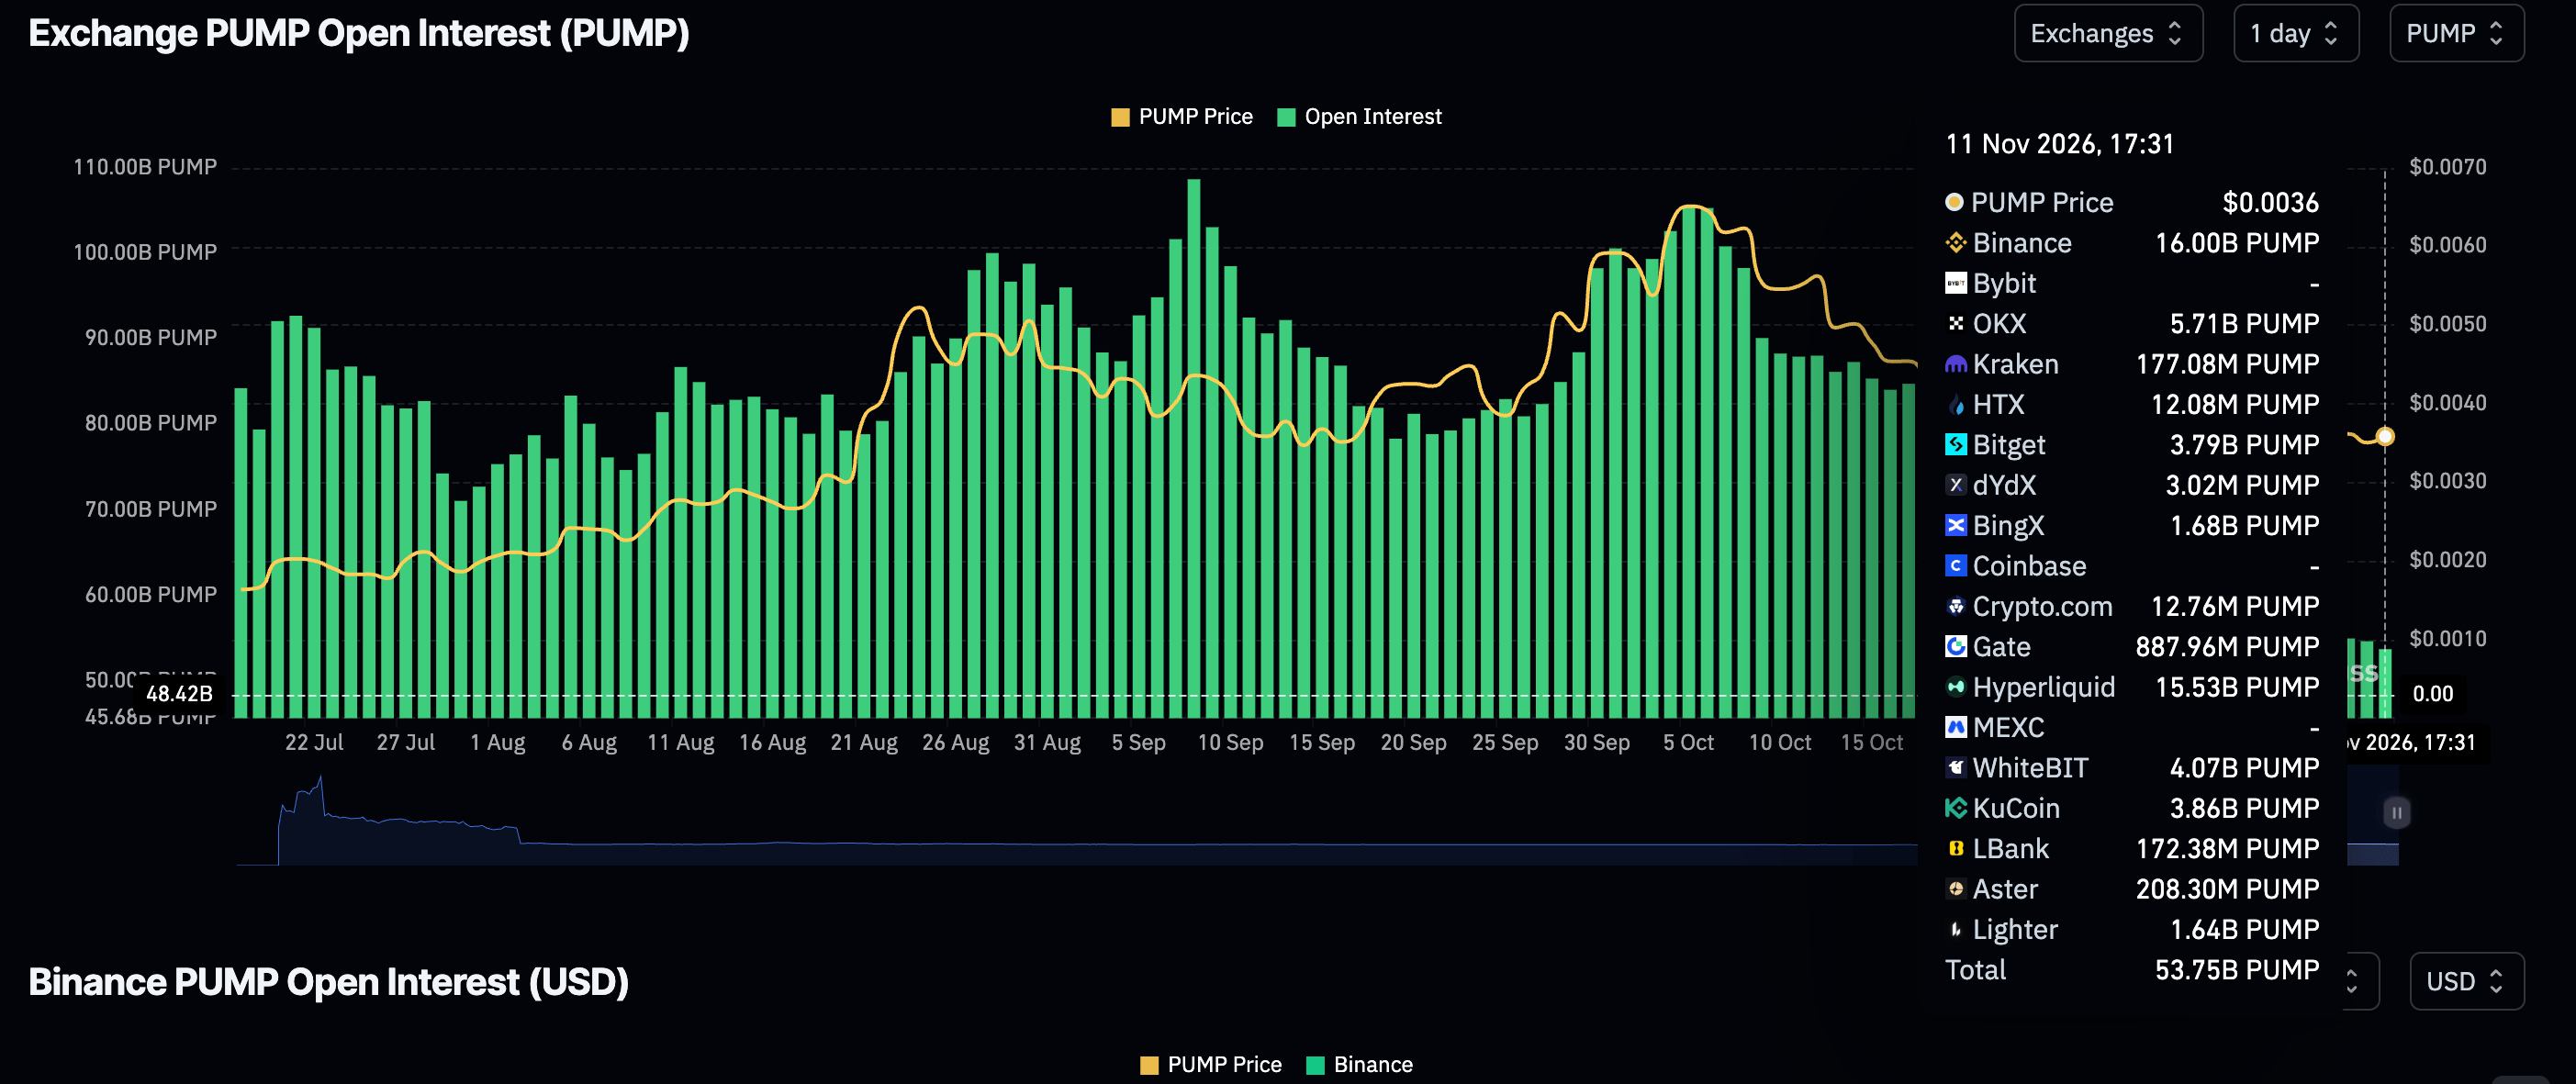
- Pump.fun faces low retail demand, with perpetual futures Open Interest at 54M PUMP, compared to 88M a month ago.
- PUMP rises but is broadly consolidating between the 200-day EMA short-term support and the 100-day EMA cap.
Pump.fun (PUMP) gains momentum on Wednesday, trading at $0.0036. The meme coin launchpad native token is up over 2% on the day, after testing lows around $0.0035.
More broadly, the technical picture remains bearish, with key indicators such as the Moving Average Convergence Divergence (MACD) stuck in negative territory. A steady price increase is required to shake off the bearish grip, especially at key psychological hurdles like $0.0040 and $0.0050.
PUMP faces weak derivatives demand
Pump.fun derivatives market maintains a strong bearish bias, as perpetual futures Open Interest (OI) shrinks to 54 million PUMP on Wednesday, down slightly from 55 million the day before. OI, which tracks the notional value of futures contracts that remain open and unsettled, averaged 88 million on October 11, undermining risk appetite.
If demand weakens further, as traders sideline themselves, the path of least resistance would stay downward, with PUMP likely extending the sell-off toward $0.0030.
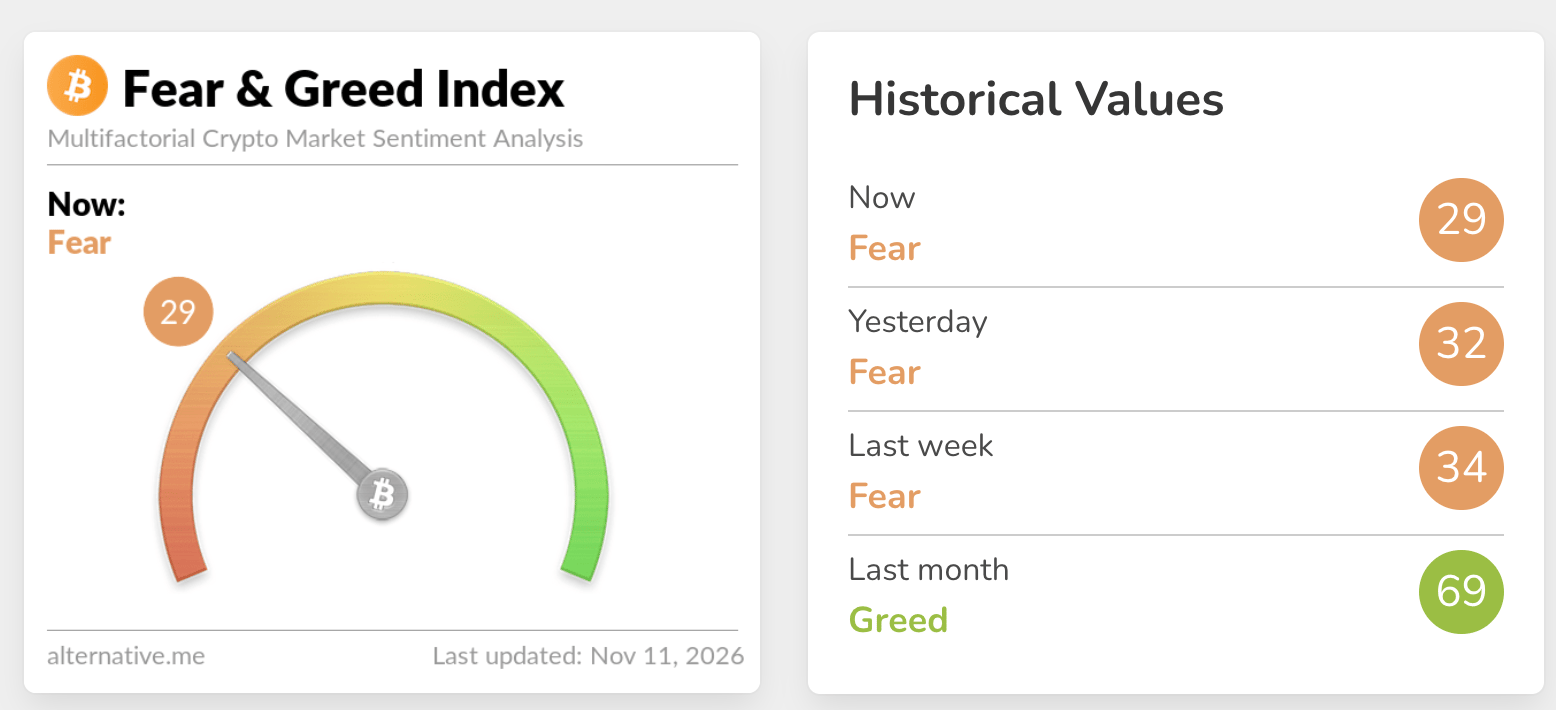
Beyond Pump.fun, the broader crypto market faces a slump in demand. The Fear & Greed Index sits at 29 in the Fear territory on Wednesday, down marginally from 32 the day before.
Compared with a 65 average over the previous month, this setup suggests investors are risk-averse at the moment, especially after the Binance hack and the upcoming Federal Reserve (Fed) monetary policy meeting in December, where a rate hike is widely expected.
Technical analysis: PUMP recovers as 200-day EMA support holds
Pump.fun trades at $0.0036, holding below the 50-day, 100-day Exponential Moving Averages (EMAs) and the active SuperTrend line, which collectively keep the near-term bias bearish. Price remains only modestly above the 200-day EMA at $0.0034, suggesting that while a broader base may be forming, sellers still dominate beneath a well-defined downward resistance trend line.
The Relative Strength Index (RSI) near 38 points to subdued demand rather than outright oversold conditions, while the Moving Average Convergence Divergence (MACD) hovers around the zero line, hinting at weak momentum within a capped market structure.
On the topside, initial resistance emerges around the prior trendline break area at $0.0040, with the 50-day EMA at $0.0043 adding a secondary cap if buyers attempt a bounce. Above that, the SuperTrend barrier at $0.0047 is the next key hurdle before the broader descending trendline zone toward $0.0071 comes into view.
On the downside, the 200-day EMA at $0.0034 is the first notable support. A daily close below this level would expose the pair to further depreciation and extend the current bearish phase.
(The technical analysis of this story was written with the help of an AI tool. Know more.)
Bitcoin, altcoins, stablecoins FAQs
Bitcoin is the largest cryptocurrency by market capitalization, a virtual currency designed to serve as money. This form of payment cannot be controlled by any one person, group, or entity, which eliminates the need for third-party participation during financial transactions.
Altcoins are any cryptocurrency apart from Bitcoin, but some also regard Ethereum as a non-altcoin because it is from these two cryptocurrencies that forking happens. If this is true, then Litecoin is the first altcoin, forked from the Bitcoin protocol and, therefore, an “improved” version of it.
Stablecoins are cryptocurrencies designed to have a stable price, with their value backed by a reserve of the asset it represents. To achieve this, the value of any one stablecoin is pegged to a commodity or financial instrument, such as the US Dollar (USD), with its supply regulated by an algorithm or demand. The main goal of stablecoins is to provide an on/off-ramp for investors willing to trade and invest in cryptocurrencies. Stablecoins also allow investors to store value since cryptocurrencies, in general, are subject to volatility.
Bitcoin dominance is the ratio of Bitcoin's market capitalization to the total market capitalization of all cryptocurrencies combined. It provides a clear picture of Bitcoin’s interest among investors. A high BTC dominance typically happens before and during a bull run, in which investors resort to investing in relatively stable and high market capitalization cryptocurrency like Bitcoin. A drop in BTC dominance usually means that investors are moving their capital and/or profits to altcoins in a quest for higher returns, which usually triggers an explosion of altcoin rallies.
Bài viết đề xuất


