


Crypto Today: Bitcoin, Ethereum and XRP extend losing streak as bearish momentum builds
- Bitcoin faces persistent declines around $80,000 while the dynamic SuperTrend line provides immediate support.
- Ethereum slides for the fifth consecutive day, as sellers tighten their grip ahead of Wednesday's Fed rate decision.
- XRP ticks lower below $1.30 amid weakening momentum indicators and capped upside.
Cryptocurrency prices are broadly correcting on Monday, led by Bitcoin’s (BTC) five-day sell-off. The Crypto King hovers around $80,000 amid a structurally capped upside. At the same time, Bitcoin is supported by a firm medium- to long-term moving average cluster, signaling potential to absorb sell-side pressure.
Ethereum (ETH) edges lower and trades around $2,325, as sellers build momentum to retain control over the trend. Meanwhile, Ripple (XRP) shows signs of consolidating, with the $1.30 supply capping the upside and limiting the token’s recovery potential.
Market sentiment dims ahead of Fed decision
The Federal Reserve (Fed) is widely expected to keep interest rates unchanged in the 3.75-4.00 range on Wednesday. CME Group’s FedWatch Tool puts the odds of steady rates at roughly 91%, with only 9% of market participants anticipating a rate hike.
The Federal Open Market Committee (FOMC) raised interest rates by 25 basis points for the first time in three years in September, citing sticky inflation and price pressure from Oil and energy due to the war in the Middle East.
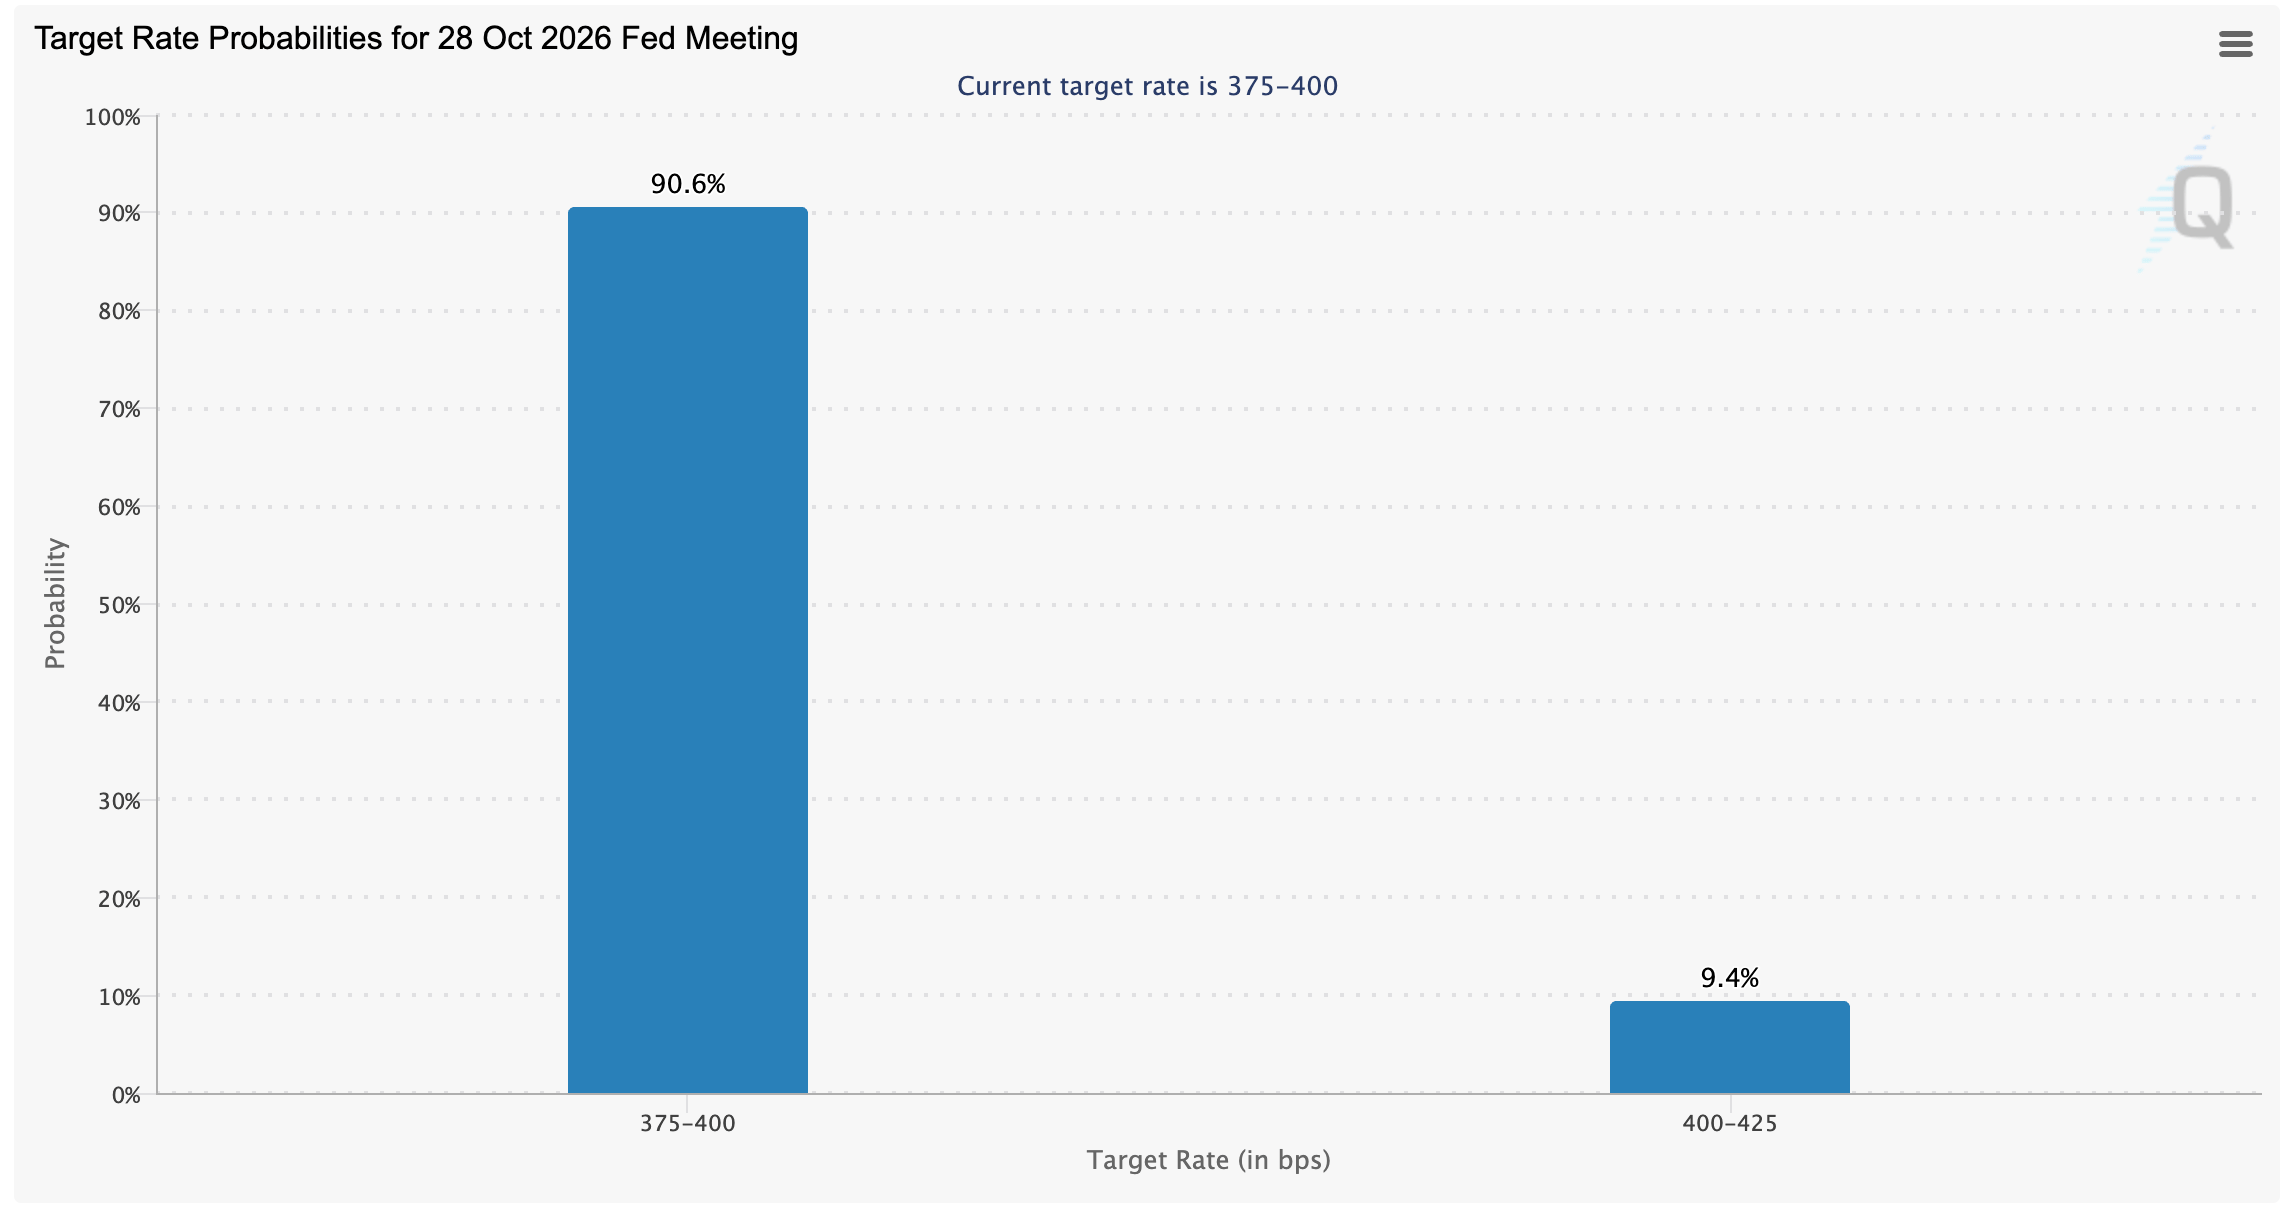
Inflation in the world’s largest economy remains above the central bank's 2% long-term target, which it is determined to achieve. Beyond the monetary decision, investors will watch Fed Chair Kevin Warsh’s comments during the post-meeting conference for clues on policy direction. Economists are pricing in a higher probability of a December rate cut.
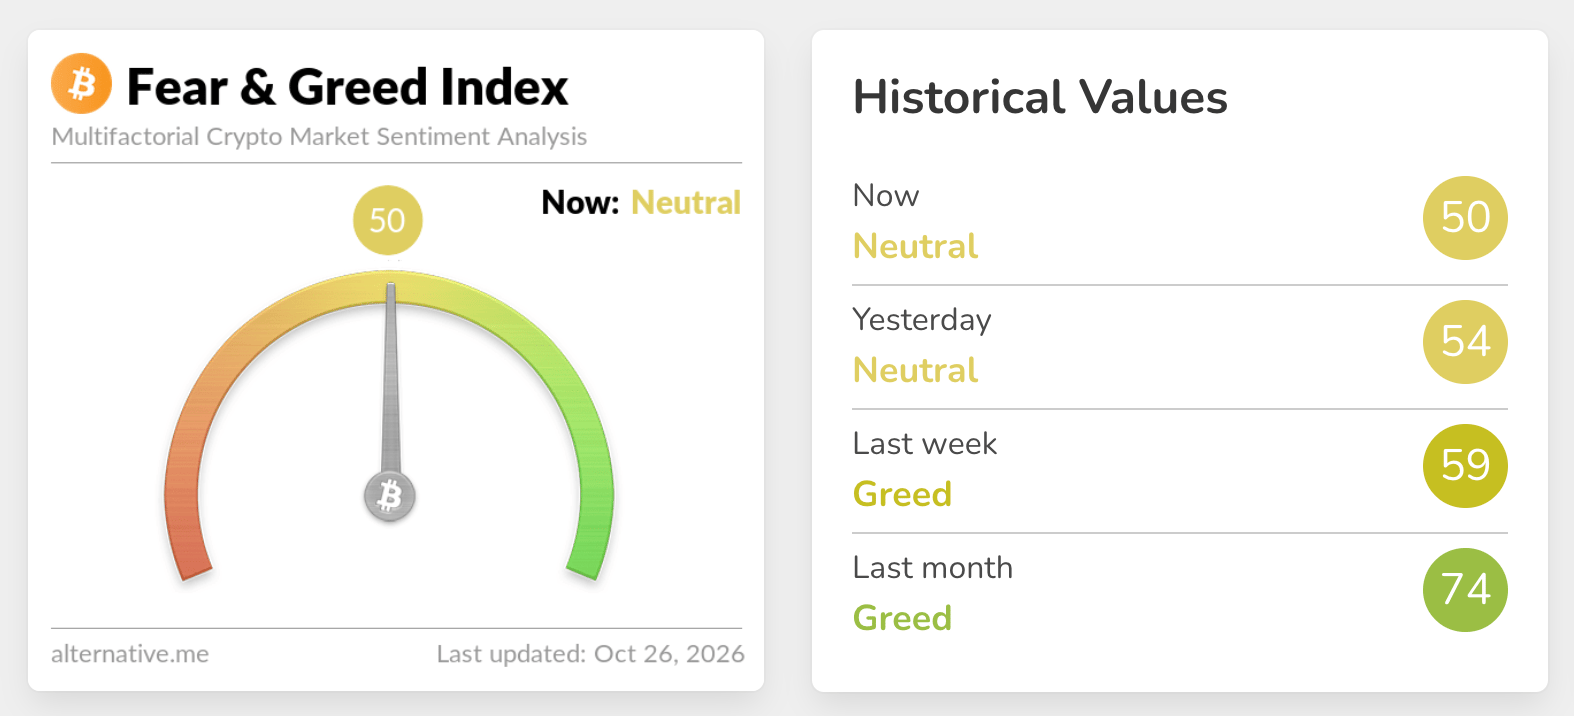
Appetite for digital assets has taken a back seat ahead of the FOMC meeting, as evidenced by the Crypto Fear & Greed Index at 50 in the Greed territory on Monday, down from 54 in the range the previous day. Broadly, the index has declined from last month’s average of 74, reinforcing macro and geopolitical uncertainty and the lack of a strong catalyst required to sustain demand.
Technical analysis: Bitcoin sellers push to retain control
Bitcoin trades at $80,061, retaining a constructive bullish bias as price holds above the SuperTrend line at $79,664 and the longer-term 100-day and 200-day Exponential Moving Averages (EMAs) at $77,681 and $76,322, respectively. However, the pair is still capped by the 50-day EMA at $80,797, which acts as immediate overhead resistance, while a softening Relative Strength Index (RSI) at 41 and a negative Moving Average Convergence Divergence (MACD) histogram hint that bullish momentum has cooled and that upside progress could be more labored in the near term.
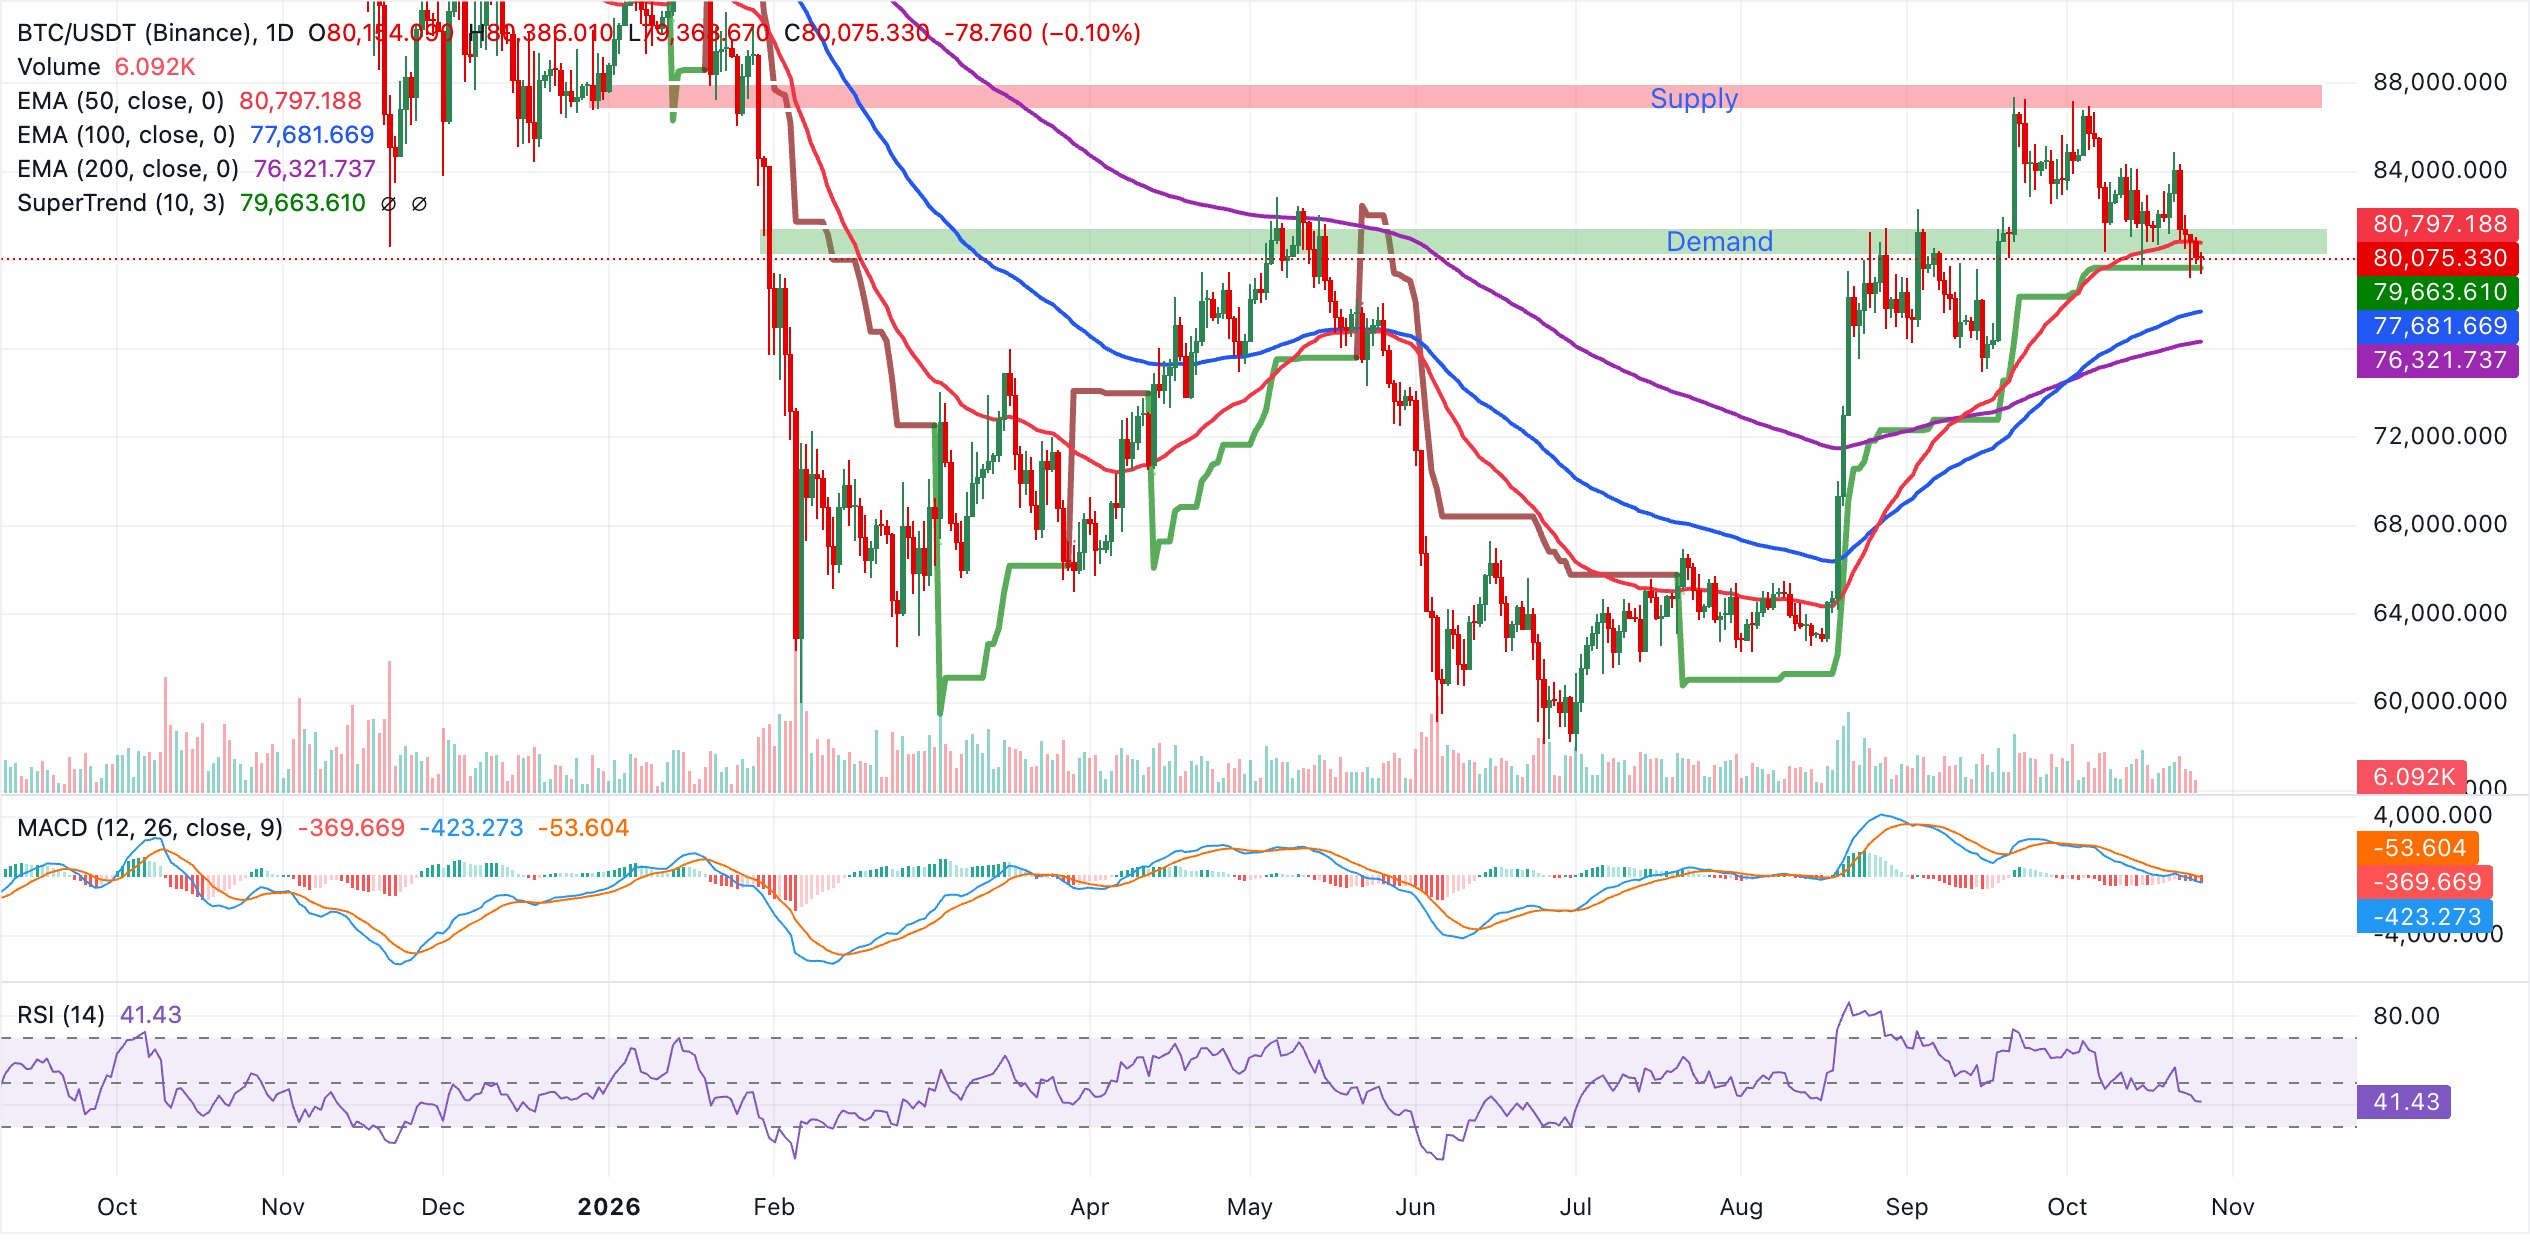
Initial support lies at the SuperTrend level around $79,664, ahead of the 100-day EMA at $77,681 and the 200-day EMA near $76,321, which together define a broader demand zone underpinning the medium-term uptrend. On the topside, a decisive daily close above the 50-day EMA at $80,797 would reopen the path for an extension of the advance, while failure to break this barrier could see BTC consolidating or slipping back to retest the nearby SuperTrend support.
Altcoins technical analysis: Ethereum and XRP face growing sell-side pressure
Ethereum trades at $2,322, holding just above the 200-day EMA at $2,317 but below the 100-day EMA at $2,363 and the 50-day EMA at $2,459, keeping the broader tone bearish as price remains capped by these overhead trend metrics. The SuperTrend line, now at $2,580 and well above spot, reinforces a downside bias, while a declining MACD below zero and an RSI near 34 suggest persistent selling pressure with conditions leaning toward oversold rather than recovery.
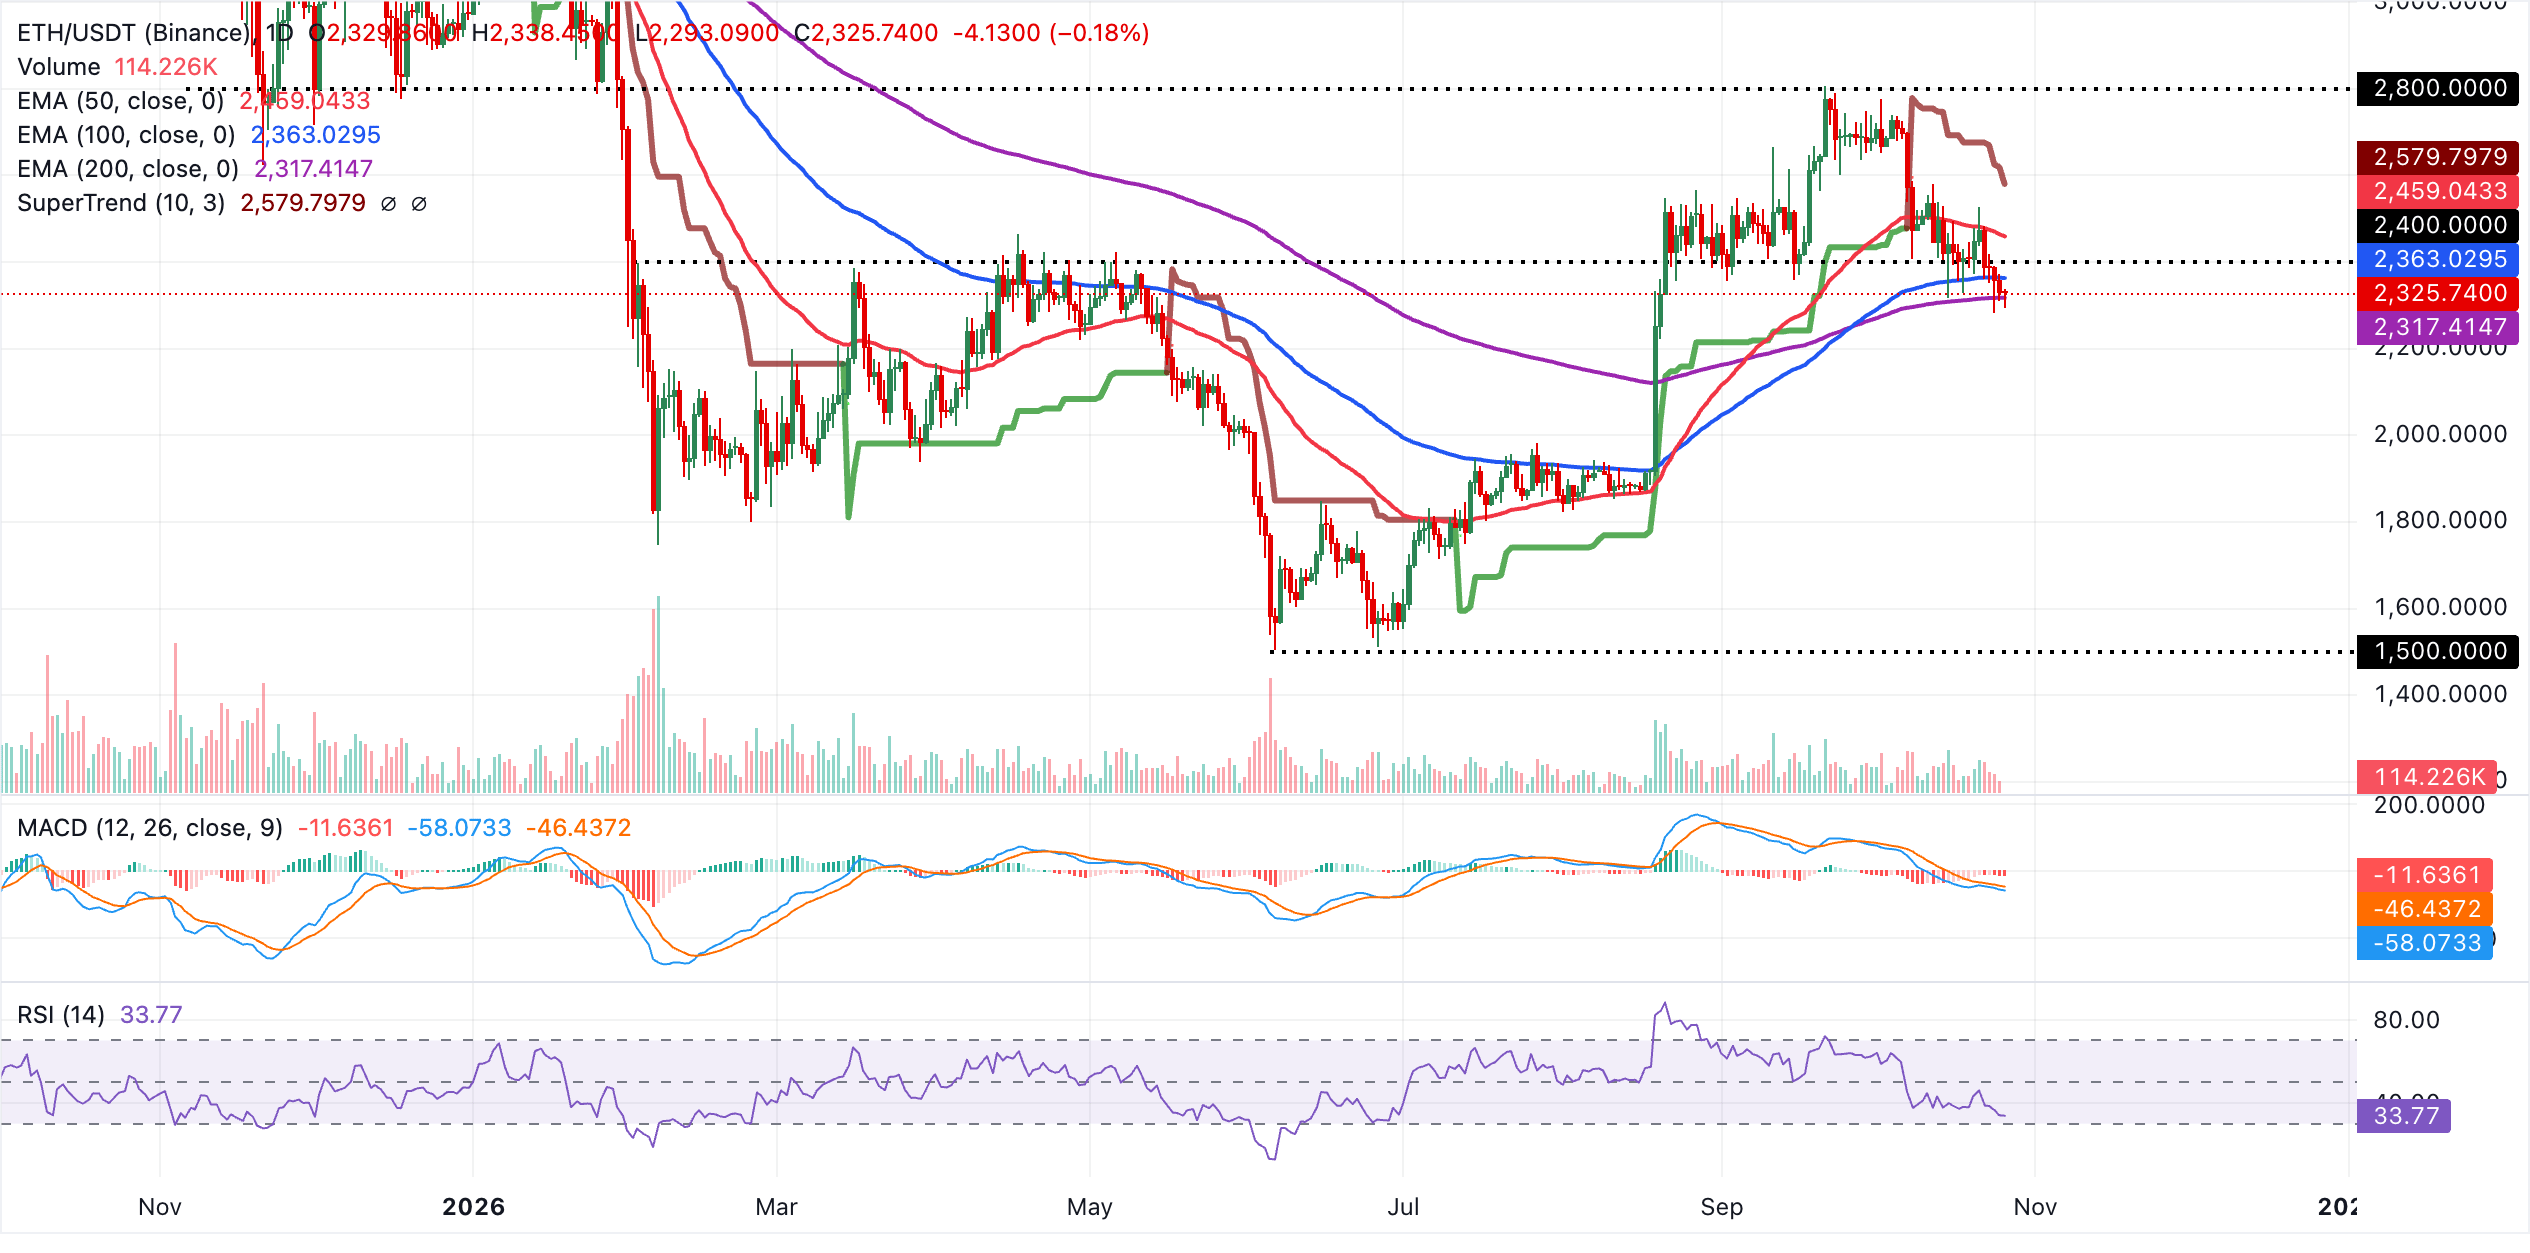
On the topside, initial resistance appears at the 100-day EMA around $2,363, followed by the 50-day EMA near $2,459, before a stronger barrier emerges at the SuperTrend line at $2,580, which would need to be cleared to signal a more durable bullish reversal. On the downside, immediate support is provided by the 200-day EMA at $2,317.
A daily close below this floor would likely open the way for a deeper pullback, while holding above it could allow ETH to consolidate and attempt another test of the mid-$2,300s resistance band.
XRP, meanwhile, trades around $1.28, maintaining a bearish near-term bias as price holds below the key moving averages. The 100-day EMA at $1.33, the 50-day EMA at $1.36 and the 200-day EMA at $1.37 all sit overhead, suggesting that rallies are likely to be capped while the broader downtrend remains in place.
Momentum indicators reinforce this weak tone, with the MACD below zero and only slightly improving, and the RSI near 38, hovering just above oversold territory and hinting at persistent downside pressure rather than a clear rebound.
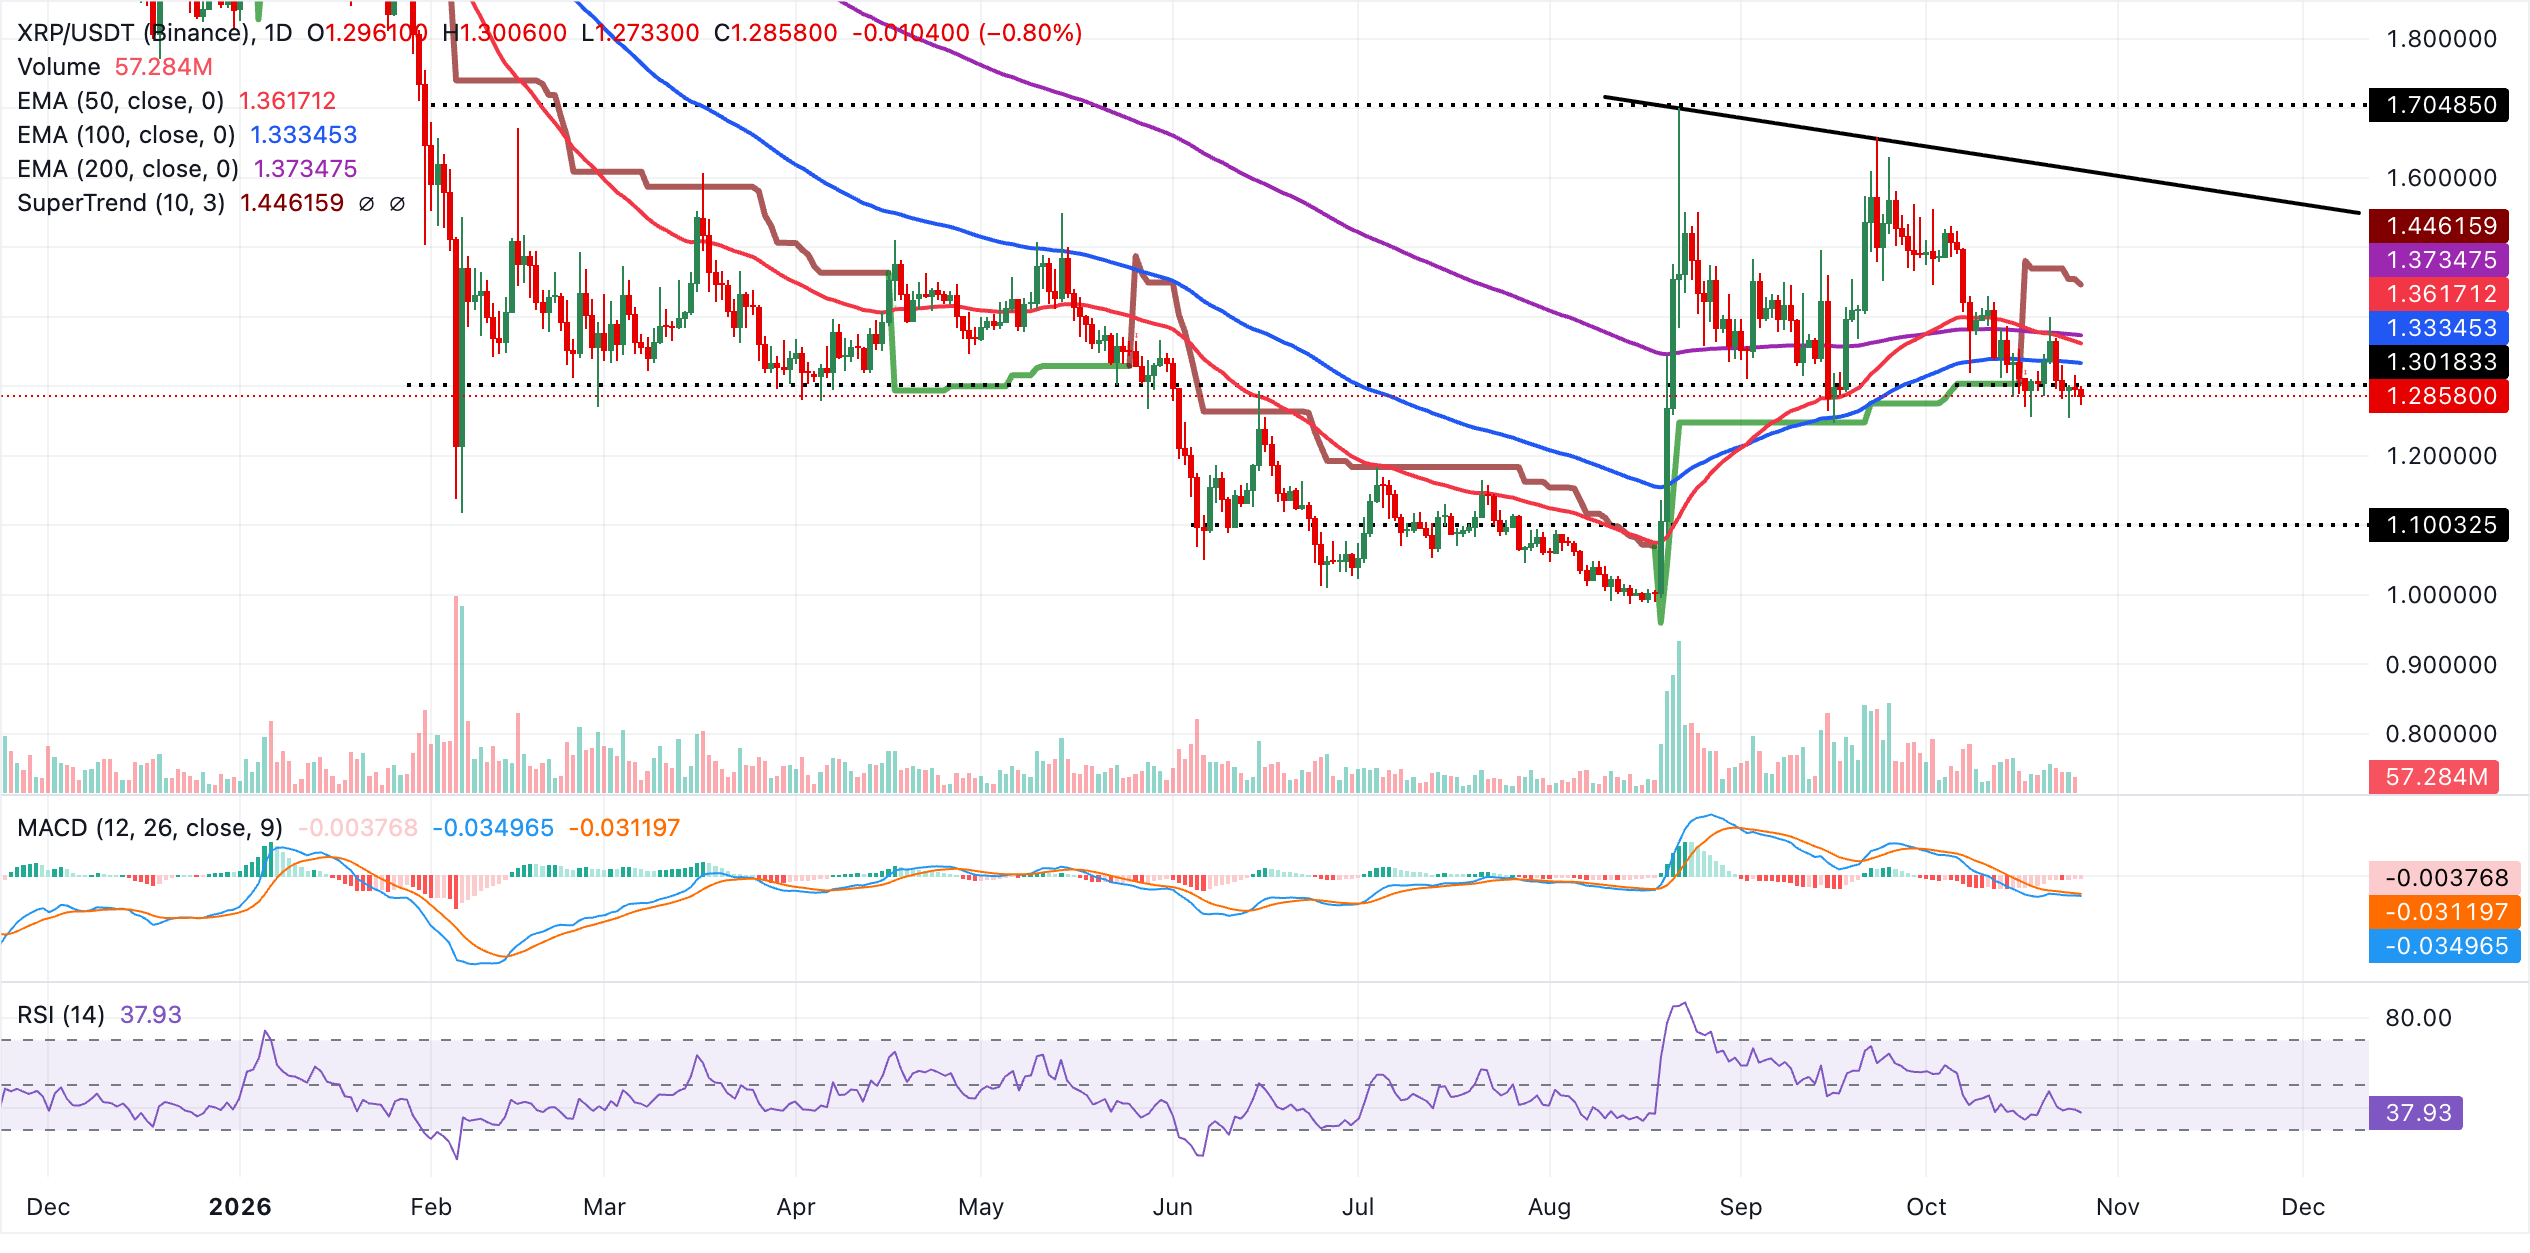
Initial resistance lies at the 100-day EMA around $1.33, followed by the 50-day EMA near $1.36 and the 200-day EMA at $1.37, forming a dense supply band that XRP would need to reclaim to ease the current bearish structure. Above these, the latest SuperTrend line at $1.45 marks a more distant hurdle aligned with the broader downward resistance trendline, which continues to track lower highs and underscores the prevailing negative bias as long as price remains confined beneath this cluster of overhead levels.
(The technical analysis of this story was written with the help of an AI tool. Know more.)
Bitcoin, altcoins, stablecoins FAQs
Bitcoin is the largest cryptocurrency by market capitalization, a virtual currency designed to serve as money. This form of payment cannot be controlled by any one person, group, or entity, which eliminates the need for third-party participation during financial transactions.
Altcoins are any cryptocurrency apart from Bitcoin, but some also regard Ethereum as a non-altcoin because it is from these two cryptocurrencies that forking happens. If this is true, then Litecoin is the first altcoin, forked from the Bitcoin protocol and, therefore, an “improved” version of it.
Stablecoins are cryptocurrencies designed to have a stable price, with their value backed by a reserve of the asset it represents. To achieve this, the value of any one stablecoin is pegged to a commodity or financial instrument, such as the US Dollar (USD), with its supply regulated by an algorithm or demand. The main goal of stablecoins is to provide an on/off-ramp for investors willing to trade and invest in cryptocurrencies. Stablecoins also allow investors to store value since cryptocurrencies, in general, are subject to volatility.
Bitcoin dominance is the ratio of Bitcoin's market capitalization to the total market capitalization of all cryptocurrencies combined. It provides a clear picture of Bitcoin’s interest among investors. A high BTC dominance typically happens before and during a bull run, in which investors resort to investing in relatively stable and high market capitalization cryptocurrency like Bitcoin. A drop in BTC dominance usually means that investors are moving their capital and/or profits to altcoins in a quest for higher returns, which usually triggers an explosion of altcoin rallies.
Bài viết đề xuất


