


Dogecoin Price Forecast: DOGE extends slide amid deteriorating derivatives metrics,overheated market conditions
- Dogecoin is extending its slide, trading below $0.077 and all key EMAs, reinforcing a bearish near-term bias.
- Deteriorating derivatives metrics and overheated market conditions support a bearish outlook.
- The technical outlook also shows a weakening trend, increasing the risk of further losses.
Dogecoin (DOGE) extends its decline, trading below $0.077 on Monday and all key Exponential Moving Averages (EMAs), as bearish momentum continues to weigh on its price. Meanwhile, deteriorating derivatives metrics and overheated market conditions point to growing downside risks, leaving DOGE vulnerable to further losses.
Weakening derivatives metrics
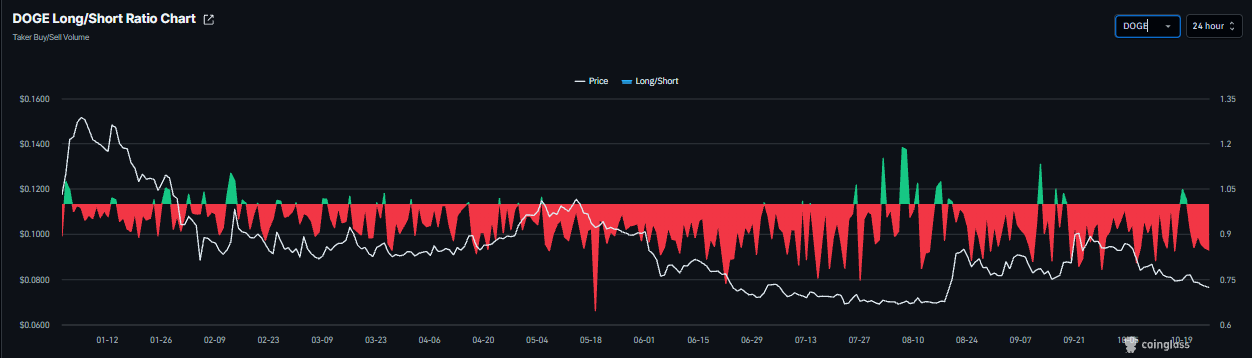
Derivatives data shows a cautious outlook for the meme coin. CoinGlass’ long-to-short ratios for DOGE read 0.84 on Monday, nearing the lowest level over a month. A ratio below one indicates bearish sentiment, as traders bet that asset prices will fall.
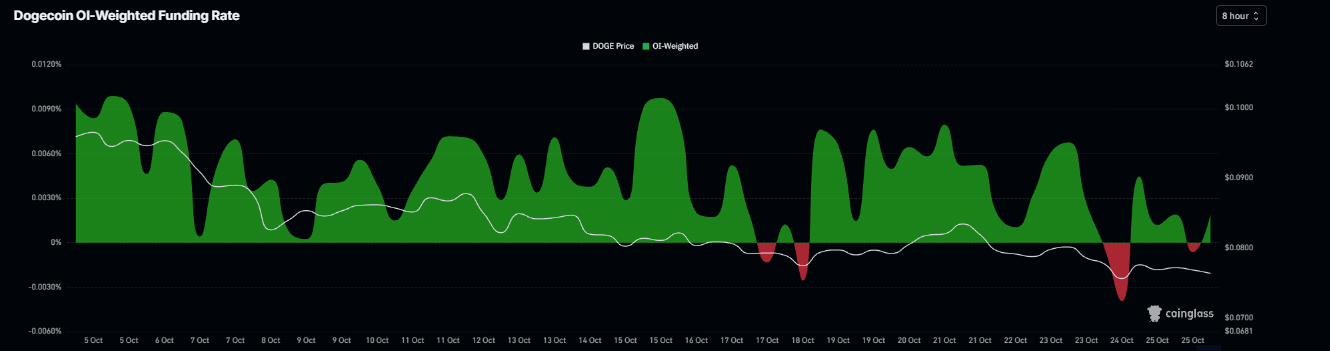
In addition, Dogecoin’s funding rate flipped positive on Monday and reads 0.0019%, indicating longs are paying shorts and suggesting a mildly bullish outlook.
On-chain data shows bearish bias
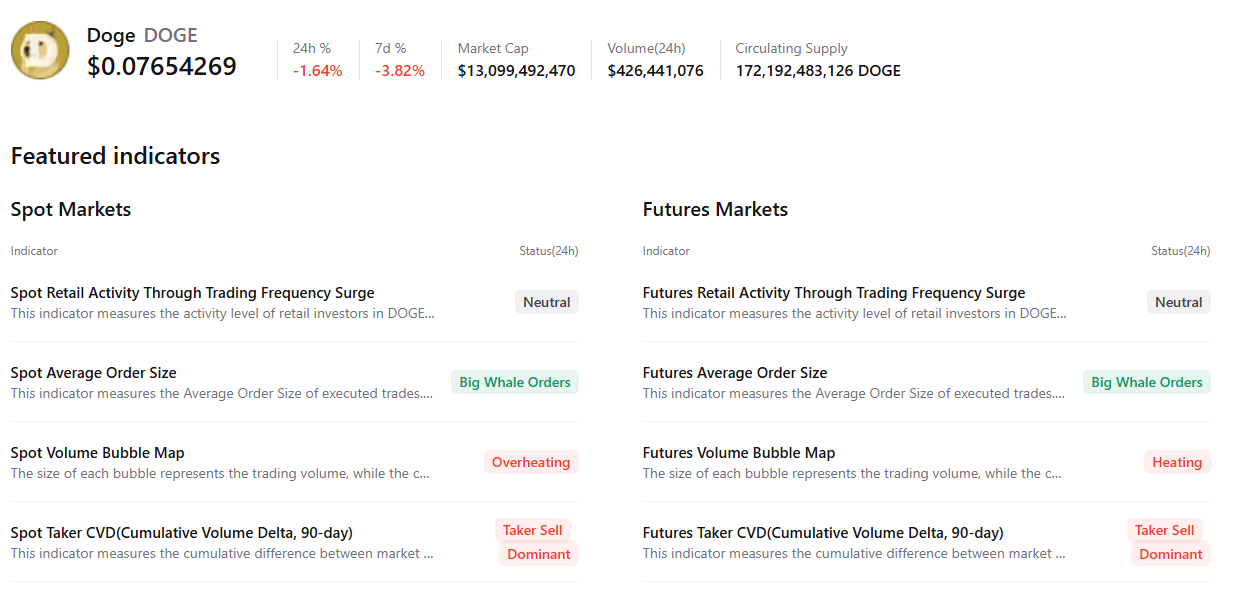
CryptoQuant’s summary data shows a bearish outlook for Dogecoin. DOGE’s spot and futures markets show large whale orders alongside heating conditions. Both markets also show sell-side dominance. These highlight a bearish, cautious sentiment bias among meme coin traders.
Some signs of optimism
Santiment’s Supply Distribution data supports a mild bullish outlook, as some large-wallet holders (whales) are buying DOGE tokens and cushioning its price drop. The metric indicates that whales holding between 100,000 and 1 million (red line), 1 million and 10 million (yellow line) and 10 million and 100 million tokens (blue line) have accumulated 260 million DOGE tokens since October 21, despite the falling price.
 [09-1792995224967.55.12, 26 Oct, 2026].png)
Dogecoin technical outlook: Weakening momentum indicators
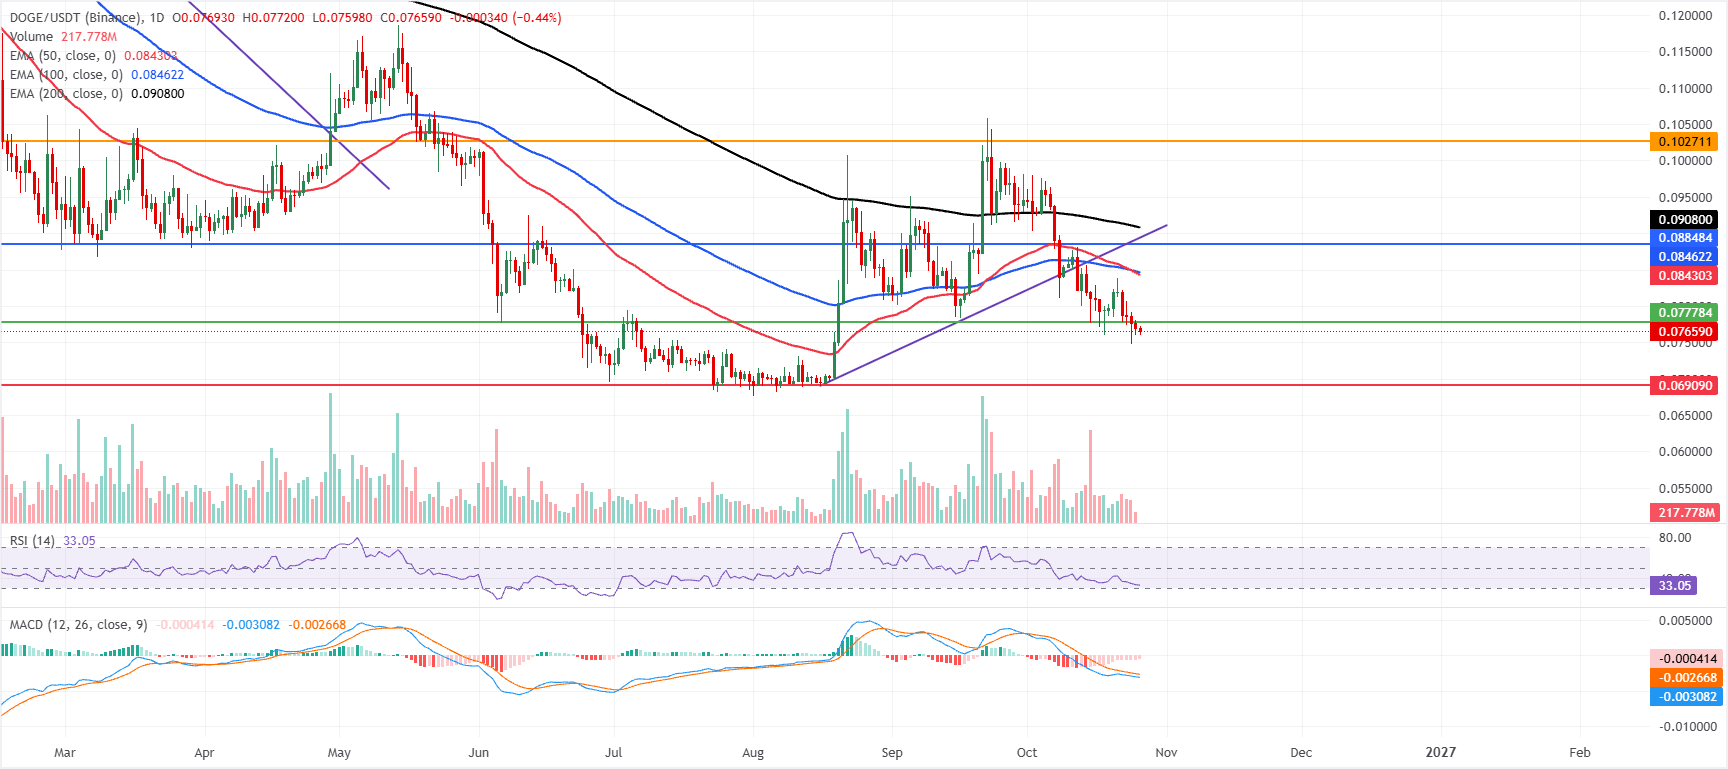
Dogecoin price trades at $0.0776 on Monday, extending its slide below all key EMAs and reinforcing a bearish near-term bias.
DOGE is capped first by the nearby horizontal barrier at $0.077, while the 50-day EMA and the 100-day EMA both at $0.084 sit higher as an additional ceiling within a broader supply band that includes $0.088 and the broken rising trendline pivot at $0.089. The 200-day EMA at $0.090 and the more distant horizontal level at $0.102 mark upper resistance in the prevailing downtrend, as the Relative Strength Index (RSI) near 33 suggests bearish momentum is pressing toward oversold conditions and the Moving Average Convergence Divergence (MACD) indicator remains below zero with a flat negative line, hinting at persistent but not accelerating downside pressure.
On the downside, immediate support is at the horizontal floor around $0.069, the next bearish target if sellers push decisively below the current $0.076 area. As long as DOGE holds under the nearby $0.077 cap and the cluster of EMAs between $0.084, rallies are likely to be viewed as corrective within the broader downtrend, with any recovery needing a sustained daily close above $0.088–$0.089 to alleviate the current bearish tone.
(The technical analysis of this story was written with the help of an AI tool. Know more.)
Bài viết đề xuất


