


Ripple and Stellar outlook: Extend gains as derivatives support upside
- XRP extends gains on Tuesday after gaining 6% the previous day.
- XLM trades above $0.195 after surging over 8% on Monday.
- Strengthening derivatives metrics support further gains for both altcoins.
Ripple (XRP) and Stellar (XLM) extend their gains on Tuesday after surging over 6% and 8%, respectively, on the previous day. In addition, improving derivatives metrics support a bullish bias, signaling further gains for both altcoins.
Strengthening derivatives metrics support upside for XRP and XLM
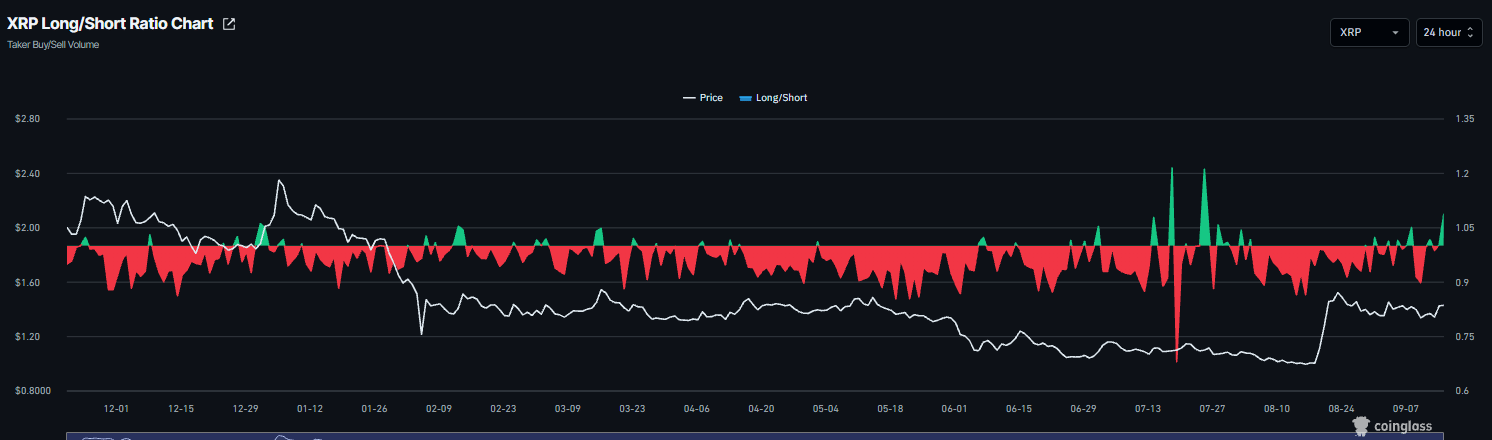
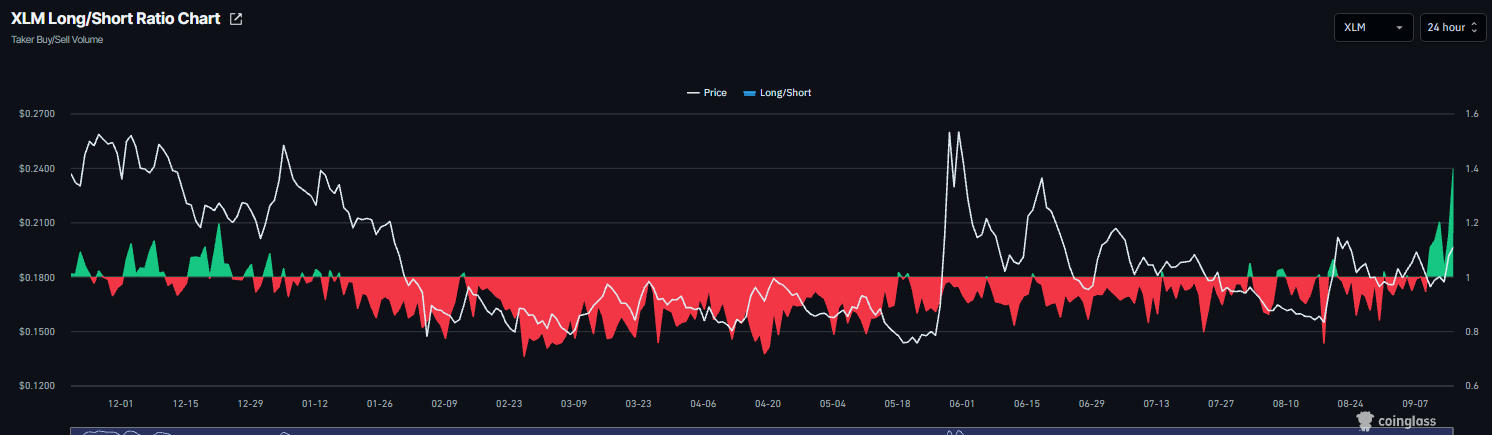
Derivatives data shows bullish bias among traders. CoinGlass’ long-to-short ratios for XRP and XLM read 1.15 and 1.35, respectively, on Tuesday. A ratio above one indicates bullish sentiment, as traders bet asset prices will rise.
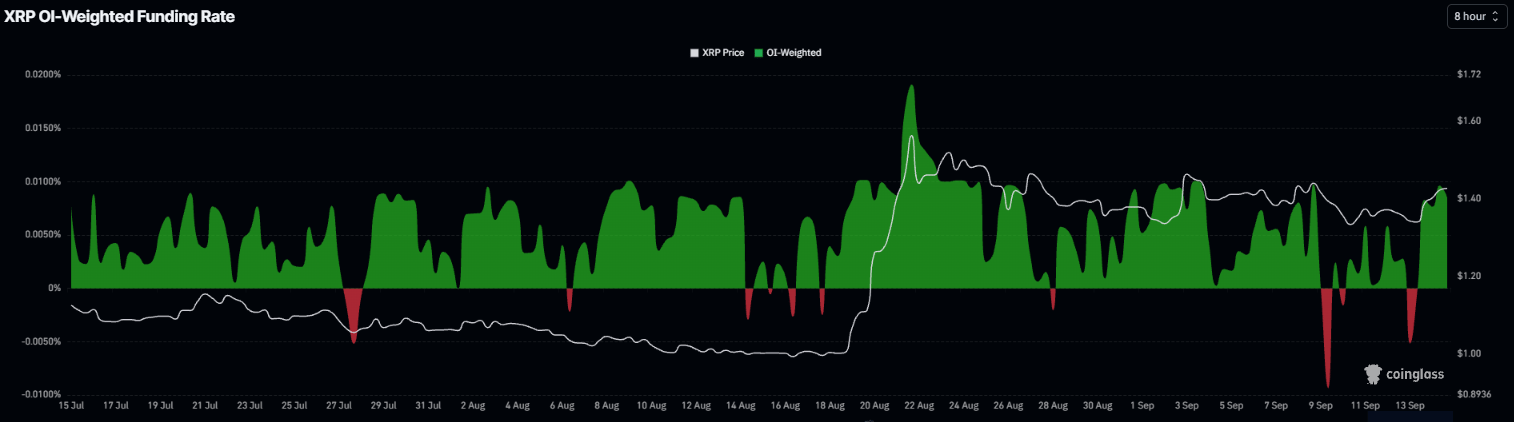
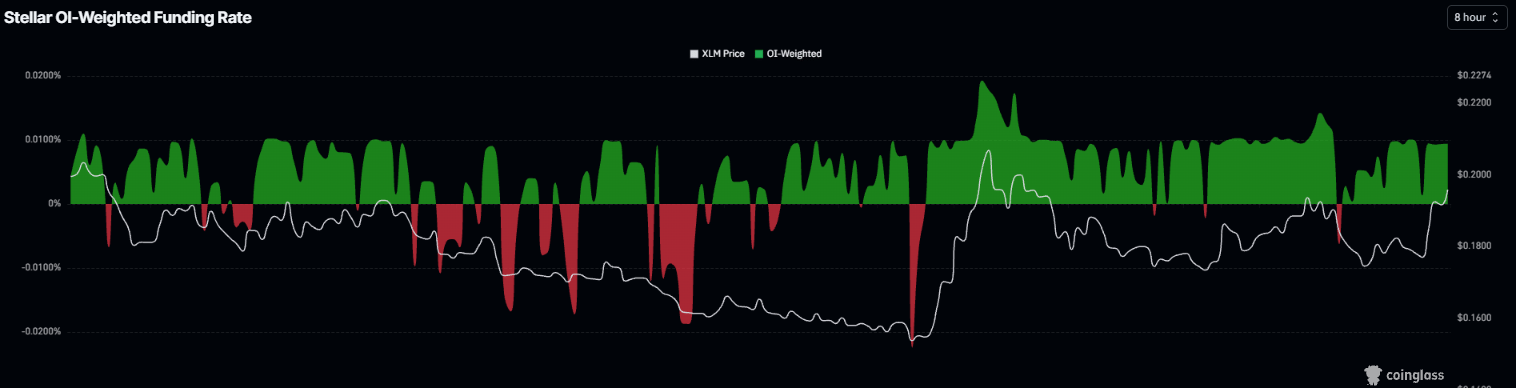
In addition, the funding rates for both XRP and XLM flipped positive on Monday and September 9, respectively, reading 0.0085% and 0.0095% on Tuesday. These positive rates indicate that long traders are paying shorts and reflect a bullish bias.
Some signs of caution
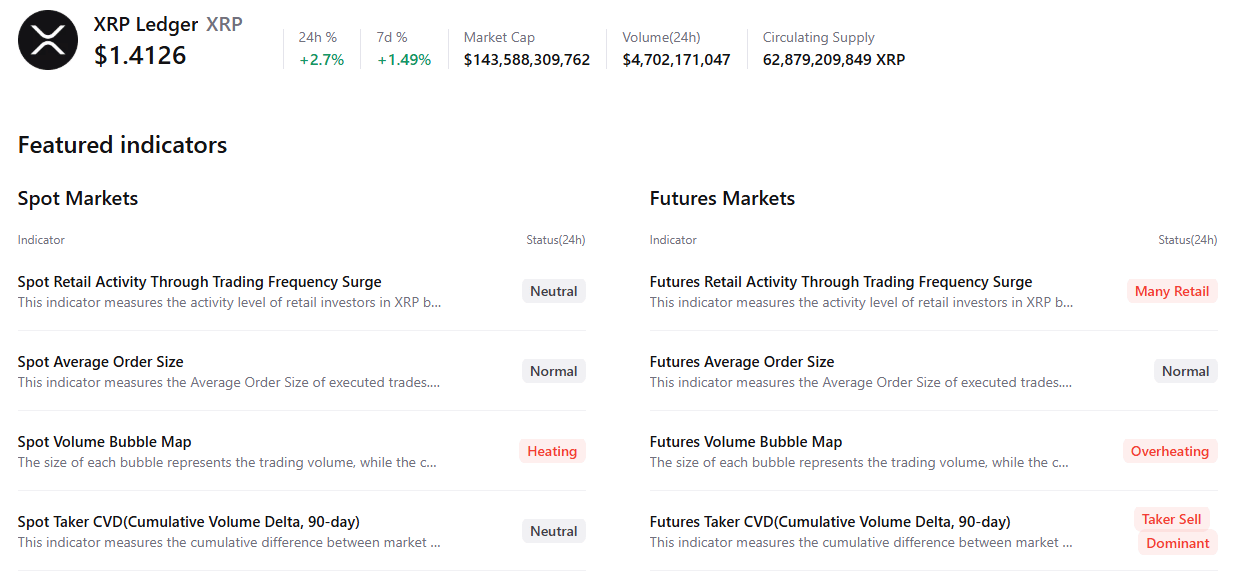
CryptoQuant’s summary data shows cautious signs for both altcoins. XRP’s spot and futures markets show overheating conditions, while the futures market shows sell-side dominance, and retail traders are active. These highlight a bearish, cautious sentiment bias among Ripple traders.
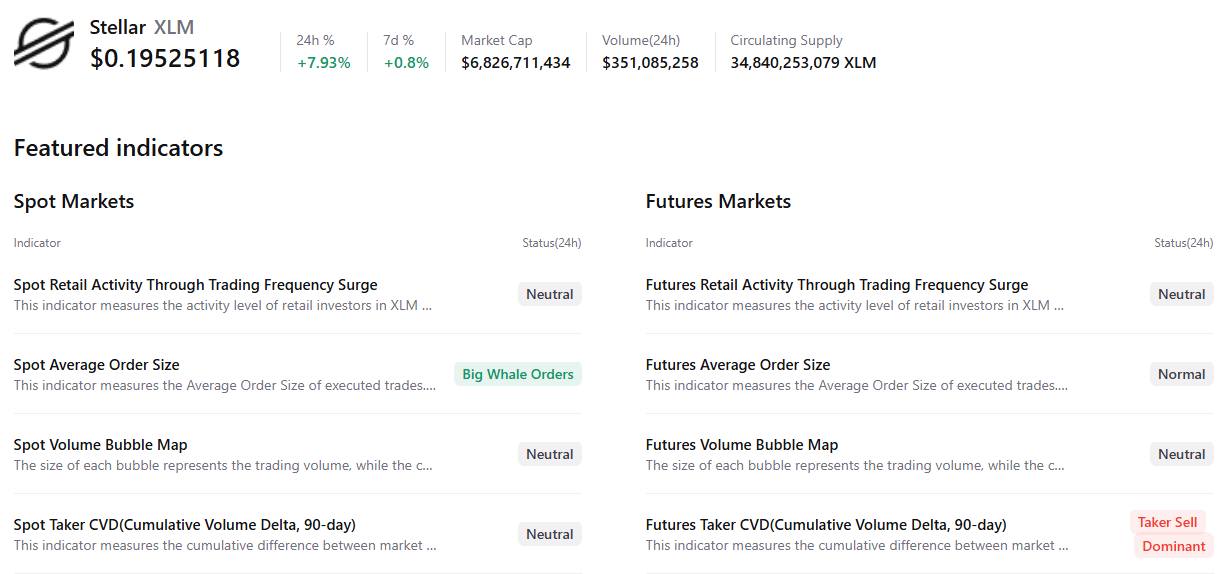
For XLM, spot shows large whale orders; however, in the futures market it also shows sell-side dominance, indicating a negative outlook among Stellar traders.
XRP technical outlook: Rebound from key support
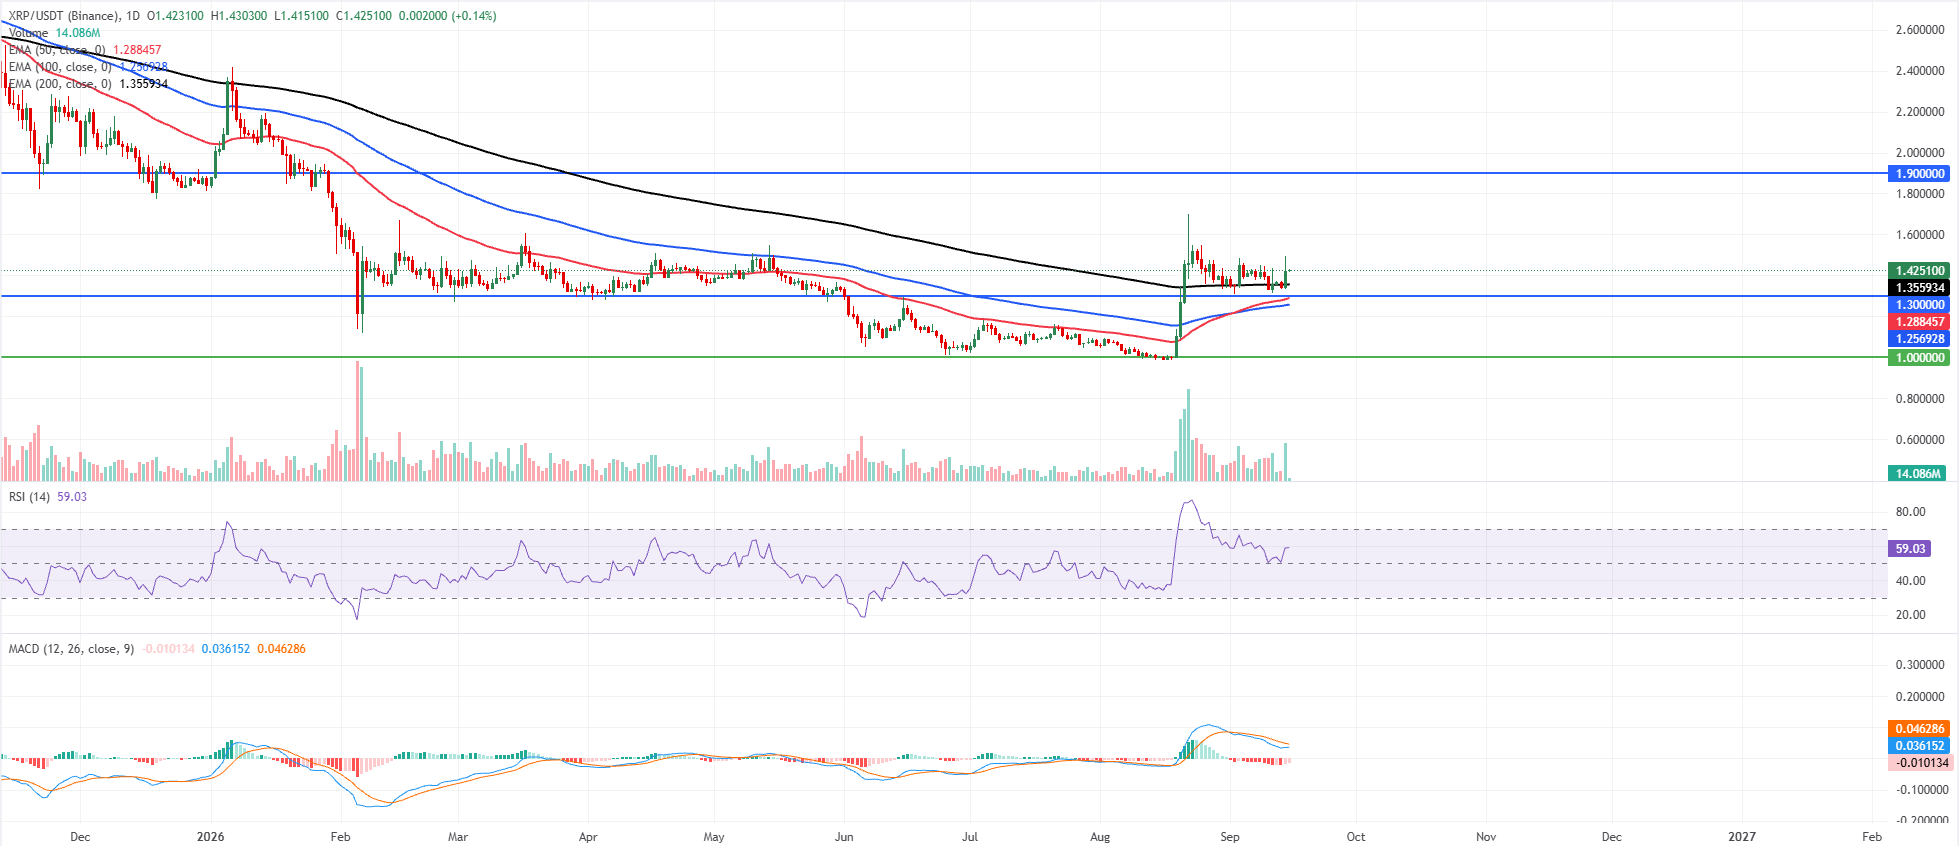
XRP price trades at $1.42 on Tuesday after surging over 6% the previous day. XRP holds firmly above the 50-day, 100-day, and 200-day Exponential Moving Averages (EMAs), clustered between roughly $1.26 and $1.36, suggesting a constructive medium-term structure and keeping the near-term bias tilted to the upside.
The Relative Strength Index (RSI) hovers just below 60, indicating positive but not overstretched momentum, while the Moving Average Convergence Divergence (MACD) remains marginally negative, hinting that bullish pressure is moderating rather than accelerating.
On the downside, initial support is seen at the 200-day EMA around $1.35, followed by horizontal support near $1.30 and the 50-day EMA at $1.28, with the 100-day EMA further down at $1.25 before a stronger structural floor near $1.00.
On the topside, the next notable resistance comes at the previously defined horizontal barrier around $1.90, and a daily close above this area would be needed to unlock scope for a renewed bullish extension.
XLM technical outlook: Strengthening momentum indicators
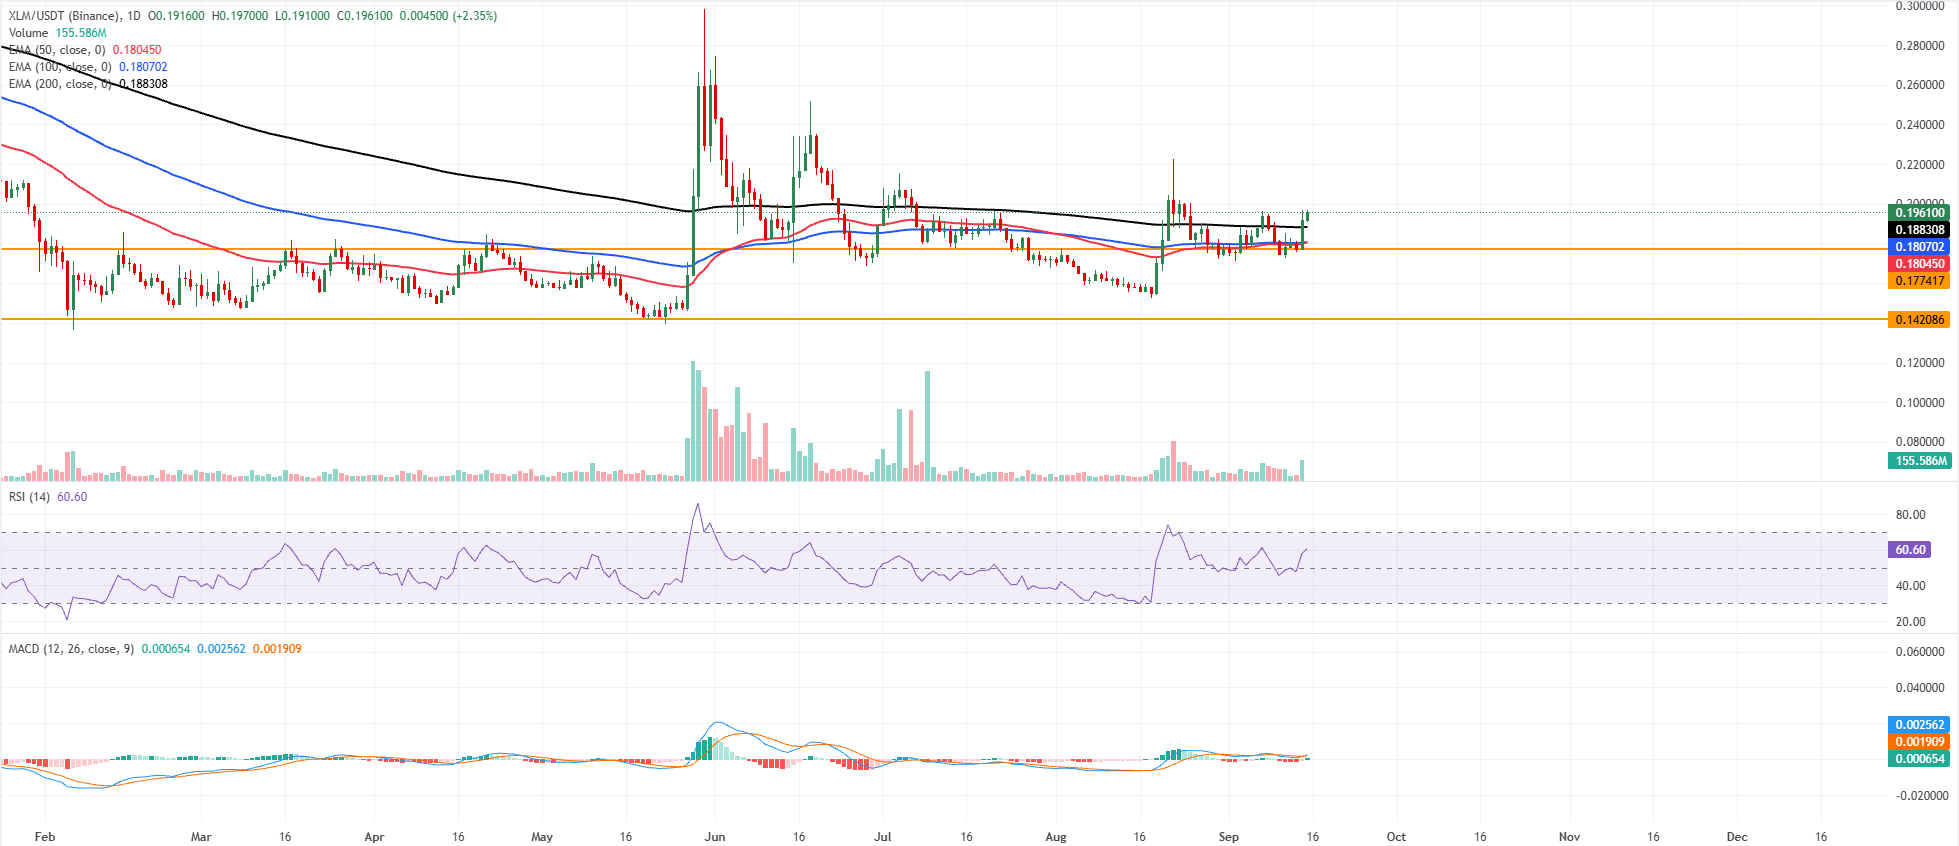
XLM price trades at $0.196 on Tuesday after rallying over 8% the previous day. XLM holds above the 50-day, 100-day, and 200-day EMAs clustered between roughly $0.180 and $0.190, suggesting a constructive near-term bias while these averages act as layered support.
The RSI around 61 shows firm but not overstretched bullish momentum, and a slightly positive MACD reading hints that upside pressure is gradually rebuilding after the recent consolidation.
On the downside, immediate support emerges at the 200-day EMA near $0.188, followed by the 100-day EMA and the 50-day EMA, which together form a dense demand band around $0.180. A deeper pullback would expose horizontal support at $0.177 before a more distant floor near $0.142; as long as price holds above this stacked support structure, the broader path of least resistance stays tilted to the upside, even if nearby resistance must now be defined by recent swing highs rather than explicit indicator caps.
(The technical analysis of this story was written with the help of an AI tool. Know more.)
Bài viết đề xuất


