


Crypto Today: Bitcoin, Ethereum, XRP recover ahead of US Senate vote on CLARITY Act
- Bitcoin edges higher above $77,000 as Trump agrees to new ethics rules in crypto bill before the US Senate votes on the CLARITY Act.
- Ethereum reclaims $2,500 as immediate support, building on a major moving-average support cluster.
- XRP trades above its 200-day EMA, although further upside remains constrained below the key $1.40 psychological resistance level.
Bitcoin (BTC) edges higher, trading near $77,884 as of Monday, in tandem with broader gains across the cryptocurrency market. Ethereum (ETH) and Ripple (XRP) follow Bitcoin’s neutral-to-bullish trajectory, holding key support levels at $2,521 and $1.38, respectively.
Trump backs crypto ethics rules ahead of key CLARITY Act vote
United States (US) President Donald Trump has agreed on key ethics provisions in the CLARITY Act ahead of a key Senate vote on the bill on Tuesday. The updated provision, prohibiting public officials from issuing or sponsoring digital assets, empowers enforcement by both state attorneys general and the Department of Justice (DOJ), according to language unveiled by Senate Republicans late Sunday.
This concession was pivotal in securing Democratic support, which remains essential to advance Tuesday’s procedural vote in the Senate.
“A vote against the Clarity Act isn’t a principled stand against President Trump,” Sen. Cynthia Lummis, the lead author of the crypto bill, told The Associated Press. “It’s a vote against implementing tough restrictions on politicians for crypto investments.”
Despite Trump’s support for the CLARITY Act, it remains unclear whether the provision will be enough to convince Democratic lawmakers. According to The Hill, a Senate GOP poll shows that Trump consented to roughly 80% of all the demands.
“Democrats got what they wanted; now they need to take yes for an answer,” Lummis added.
The broader cryptocurrency market remains volatile as investors assess the impact of Tuesday's Senate CLARITY Act vote and the Federal Reserve (Fed) monetary policy decision on Wednesday. This volatility will likely persist in the coming sessions and could shape market direction.
Technical analysis: Bitcoin builds bullish momentum
Bitcoin trades at $77,844, holding a bullish near-term bias as price stays comfortably above the main Exponential Moving Averages (EMAs), suggesting a well-supported trend after reclaiming the descending resistance line, whose break point sits near $65,809.
Momentum is mixed, with the Moving Average Convergence Divergence (MACD) in negative territory and below its signal line, while the Relative Strength Index (RSI) around 56 hints at neutral-to-positive underlying pressure rather than outright overbought conditions.
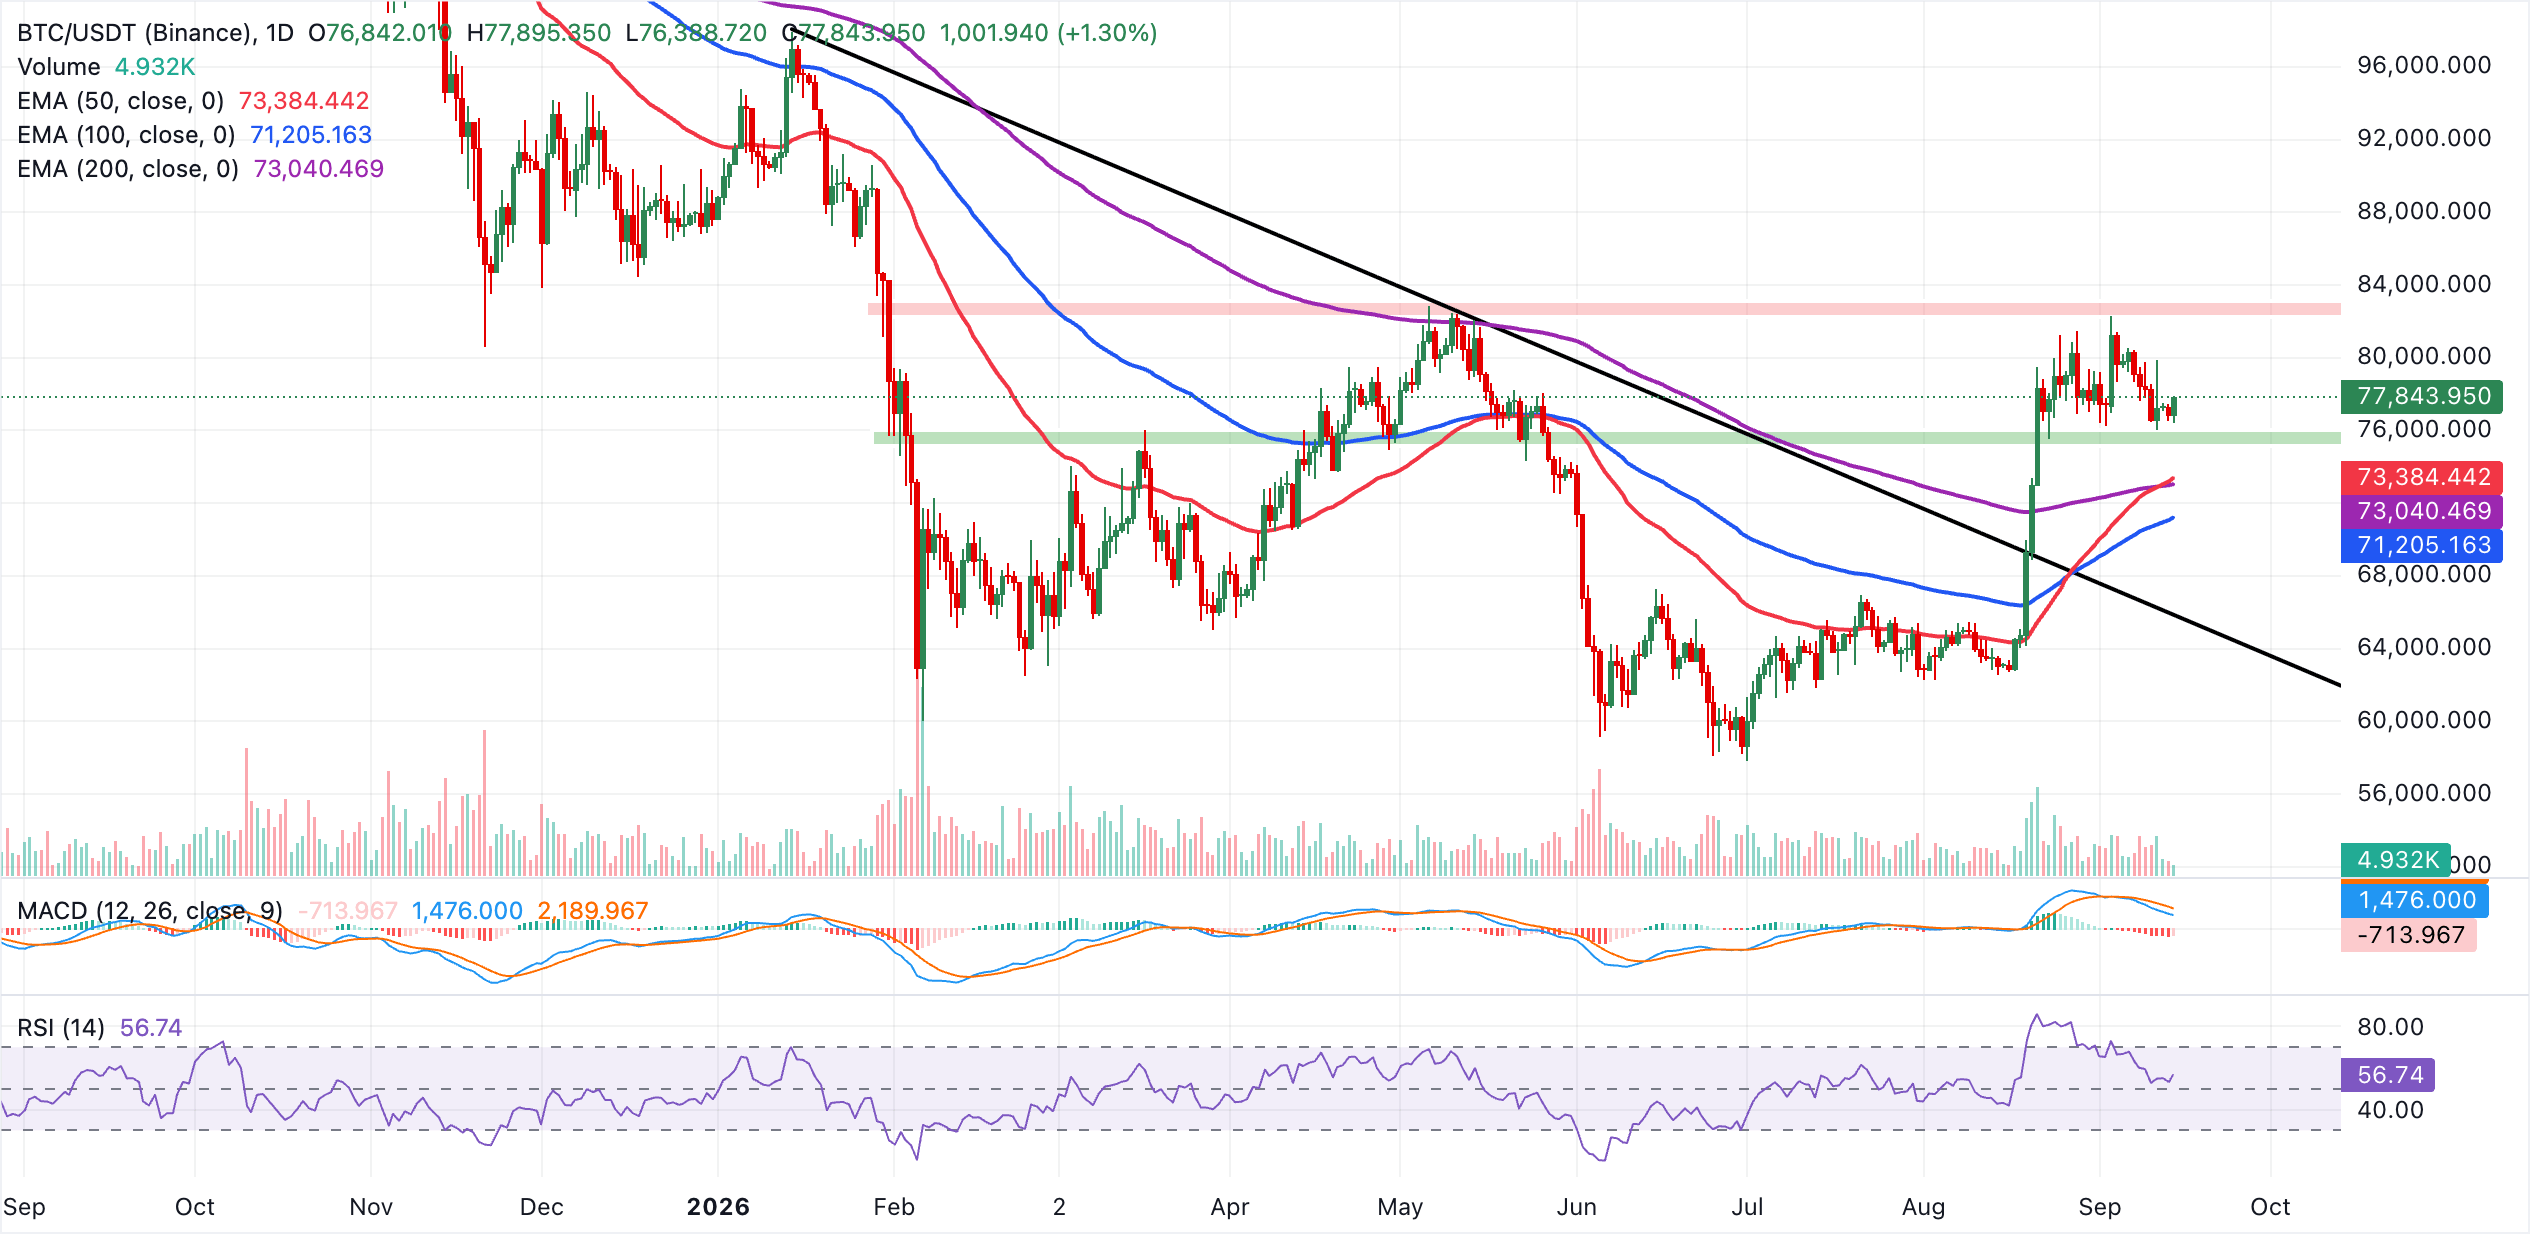
Initial support lies at the nearest psychological level at $76,000 ahead of a broader structural demand zone defined by the 50-day EMA at $73,384 and the 200-day EMA at $73,040, with the 100-day EMA at $71,205 providing an additional medium-term floor. A deeper setback would likely target the broken descending trendline around $65,810, where buyers could try to defend the longer-term bullish structure as long as daily closes remain above that reclaimed barrier.
Altcoins technical analysis: Ethereum and XRP advance as support holds
Ethereum trades at $2,521, extending its advance well above the key EMAs. The 50-day EMA at $2,265, together with the 100-day EMA at $2,146 and the 200-day EMA at $2,197, all sit comfortably below spot and suggest a firmly supported near-term bullish bias.
Momentum is mixed, as the RSI holds in a constructive zone near 62 while the MACD indicator has slipped below zero, hinting that bullish pressure is moderating rather than reversing.
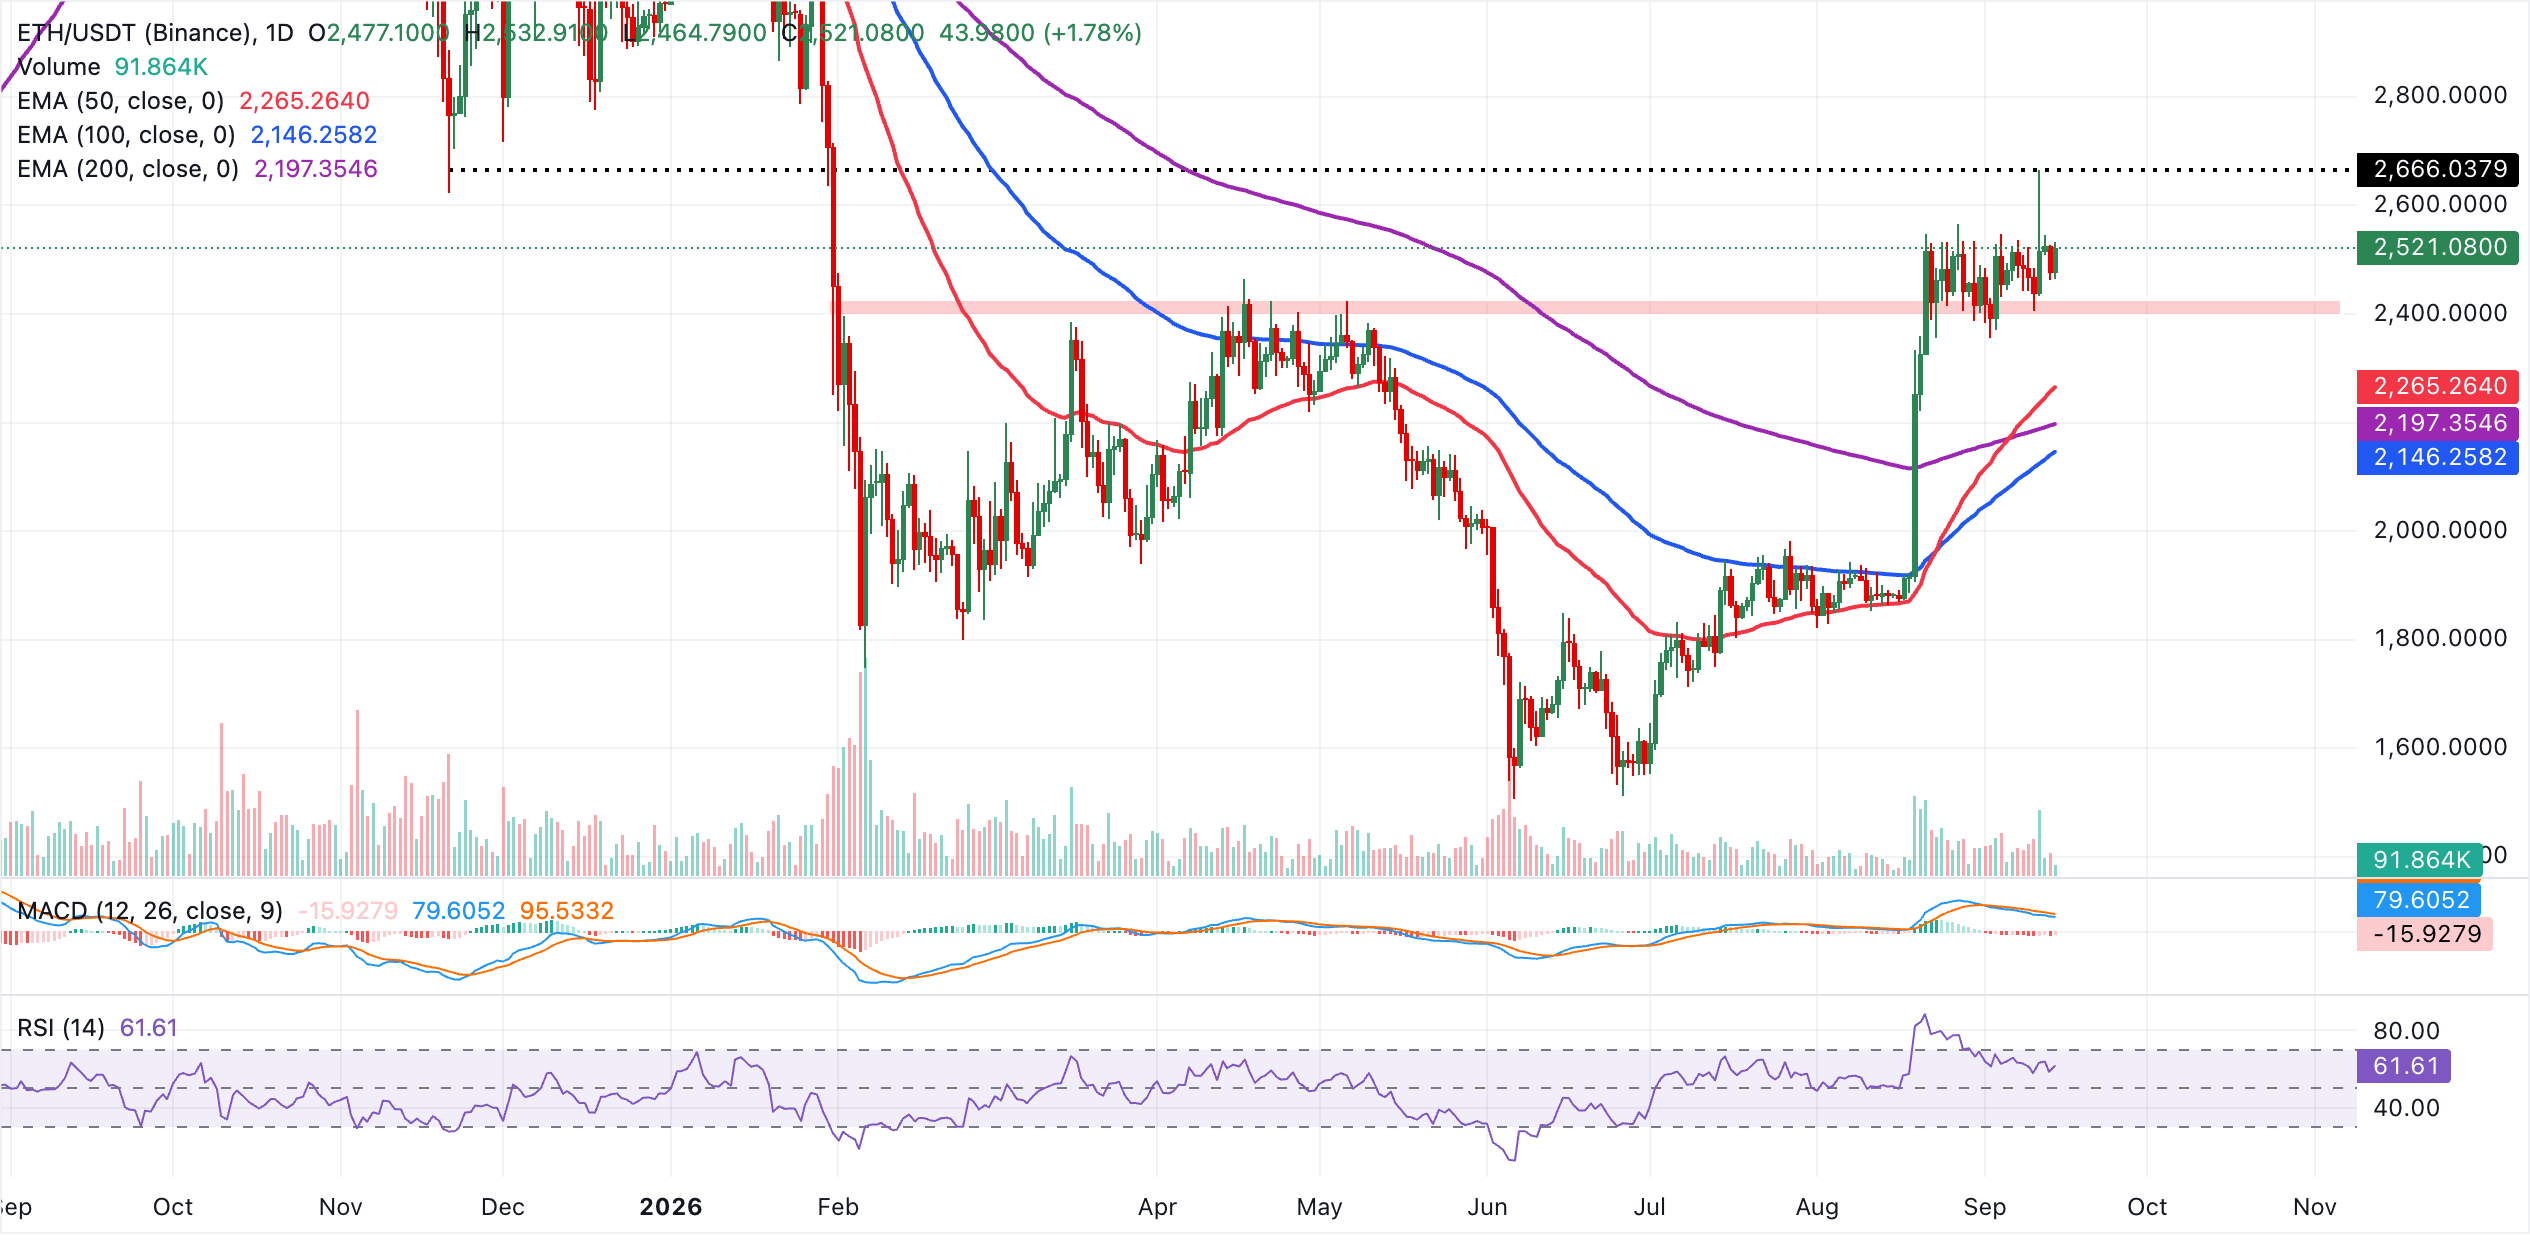
Initial support is seen at the 50-day EMA near $2,265, which marks the first technical floor should a pullback unfold. Below that, the broader bullish structure is reinforced by the 200-day EMA around $2,197 and the 100-day EMA near $2,146, where buyers would be expected to re-emerge on deeper dips. With no clear overhead resistance defined by the current moving average set on the daily chart, BTC’s path of least resistance remains to the upside as long as price holds above the $2,265 area.
XRP, on the other hand, holds above the 50-day Exponential Moving Average (EMA) at $1.28, the 100-day EMA at $1.25 and the 200-day EMA at $1.36, keeping the near-term bias bullish as price is supported by all major trend gauges. The RSI around 55 suggests moderately positive momentum, although the MACD remains below the zero line, hinting that upside traction is constructive but not aggressive.
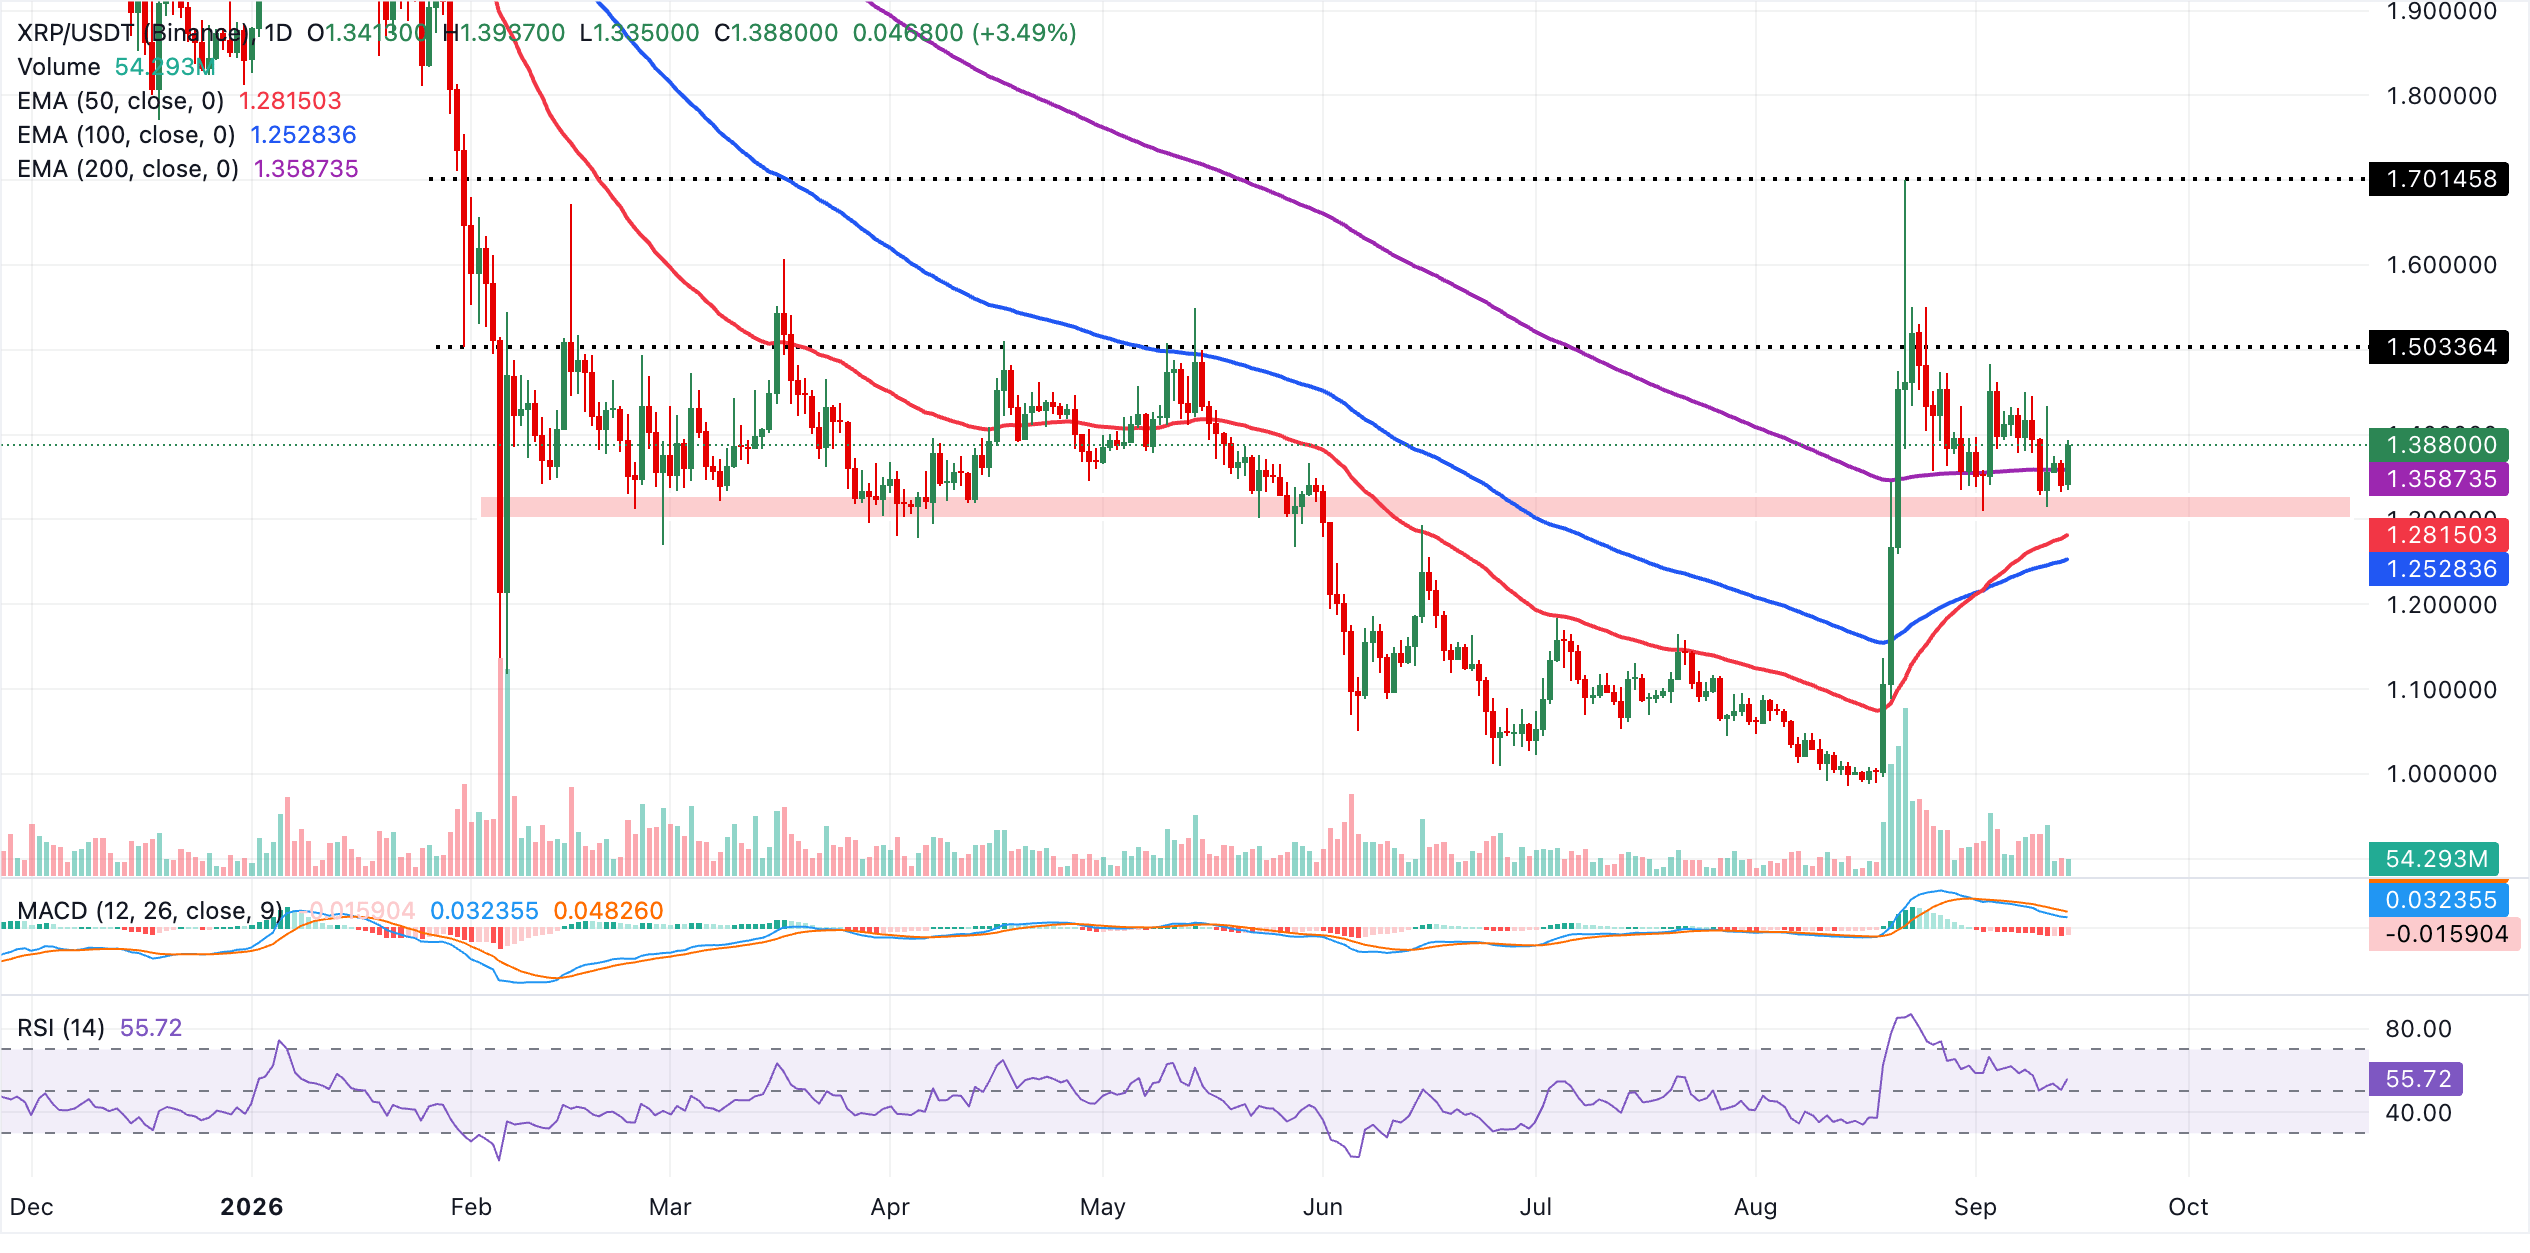
On the downside, immediate support is seen at the 200-day EMA at $1.36, with deeper demand clustered at the 50-day EMA at $1.28 and then the 100-day EMA at $1.25 should a broader pullback unfold. As long as XRP holds above these moving-average layers, the technical structure favors further consolidation with a bullish tilt, while any daily close below $1.36 would weaken the current positive setup and expose a test of the lower EMA supports.
(The technical analysis of this story was written with the help of an AI tool. Know more.)
Bitcoin, altcoins, stablecoins FAQs
Bitcoin is the largest cryptocurrency by market capitalization, a virtual currency designed to serve as money. This form of payment cannot be controlled by any one person, group, or entity, which eliminates the need for third-party participation during financial transactions.
Altcoins are any cryptocurrency apart from Bitcoin, but some also regard Ethereum as a non-altcoin because it is from these two cryptocurrencies that forking happens. If this is true, then Litecoin is the first altcoin, forked from the Bitcoin protocol and, therefore, an “improved” version of it.
Stablecoins are cryptocurrencies designed to have a stable price, with their value backed by a reserve of the asset it represents. To achieve this, the value of any one stablecoin is pegged to a commodity or financial instrument, such as the US Dollar (USD), with its supply regulated by an algorithm or demand. The main goal of stablecoins is to provide an on/off-ramp for investors willing to trade and invest in cryptocurrencies. Stablecoins also allow investors to store value since cryptocurrencies, in general, are subject to volatility.
Bitcoin dominance is the ratio of Bitcoin's market capitalization to the total market capitalization of all cryptocurrencies combined. It provides a clear picture of Bitcoin’s interest among investors. A high BTC dominance typically happens before and during a bull run, in which investors resort to investing in relatively stable and high market capitalization cryptocurrency like Bitcoin. A drop in BTC dominance usually means that investors are moving their capital and/or profits to altcoins in a quest for higher returns, which usually triggers an explosion of altcoin rallies.
Bài viết đề xuất


