


Ripple and Stellar outlook: Mixed signals keep traders at a crossroads
- XRP trades at $1.11 on Tuesday, with momentum indicators suggesting selling pressure is easing.
- XLM hovers near the $0.187 support zone, consolidating ahead of its next directional move.
- Mixed market sentiment in derivatives suggests growing indecision among traders, signaling heightened volatility ahead.
Ripple (XRP) and Stellar (XLM) trade within tight ranges on Tuesday as traders await the next directional move. XRP’s technical indicators suggest bearish momentum is fading, while XLM continues to consolidate near a critical support zone. Mixed derivatives metrics highlight growing market indecision, raising the likelihood of a volatile breakout in either direction in the coming days.
Derivatives positioning shows mixed bias
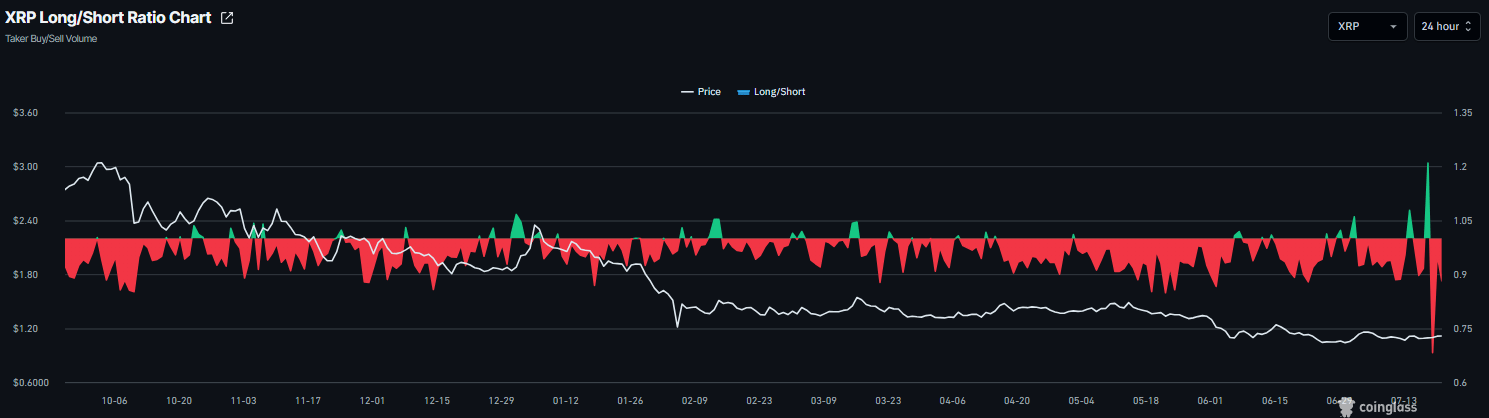
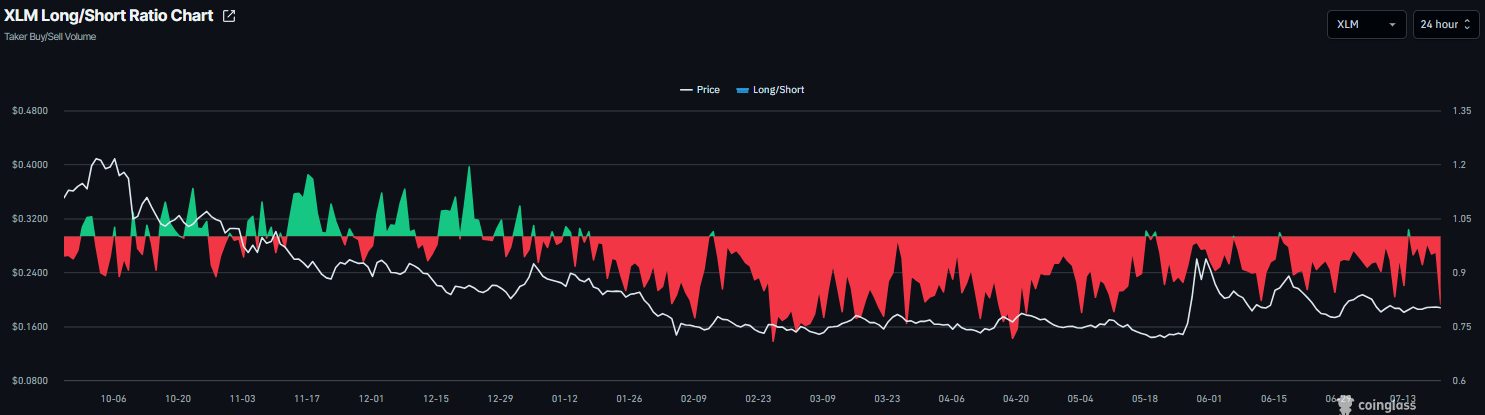
Derivatives data shows mixed sentiment. CoinGlass’ long-to-short ratio for both XRP and XLM reads 0.88 and 0.81, respectively, on Tuesday. The ratio being below one, indicates bearish sentiment, as traders are betting the assets' prices will fall.
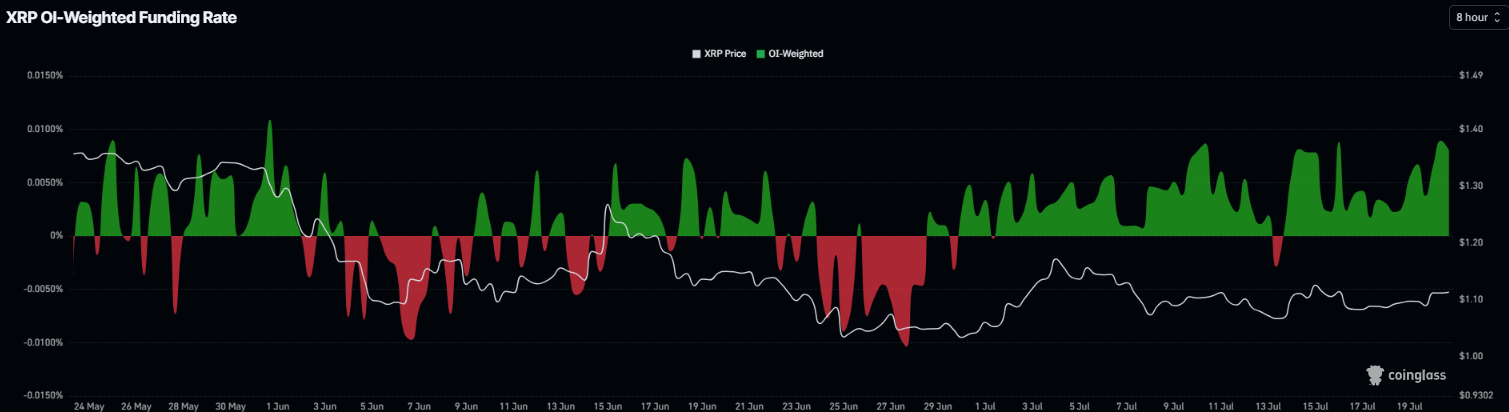
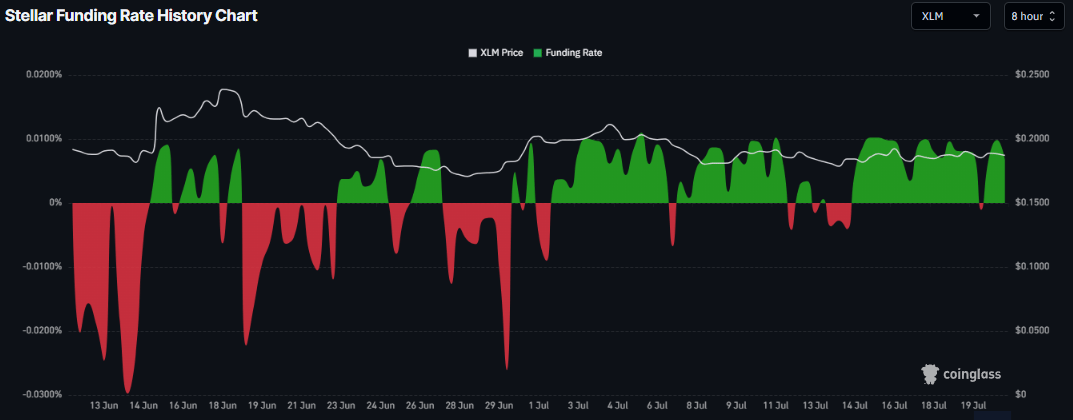
Meanwhile, the funding rates show a positive bias for both altcoins. XRP funding rates flipped positive on July 14 and continue to remain in bullish territory, reading 0.0081% on Tuesday. Similarly, for XLM, the metrics turned positive on Monday, reaching 0.0068% on Tuesday. These positive rates indicate that longs are paying shorts and project bullish sentiment.
On-chain data shows mixed sentiment
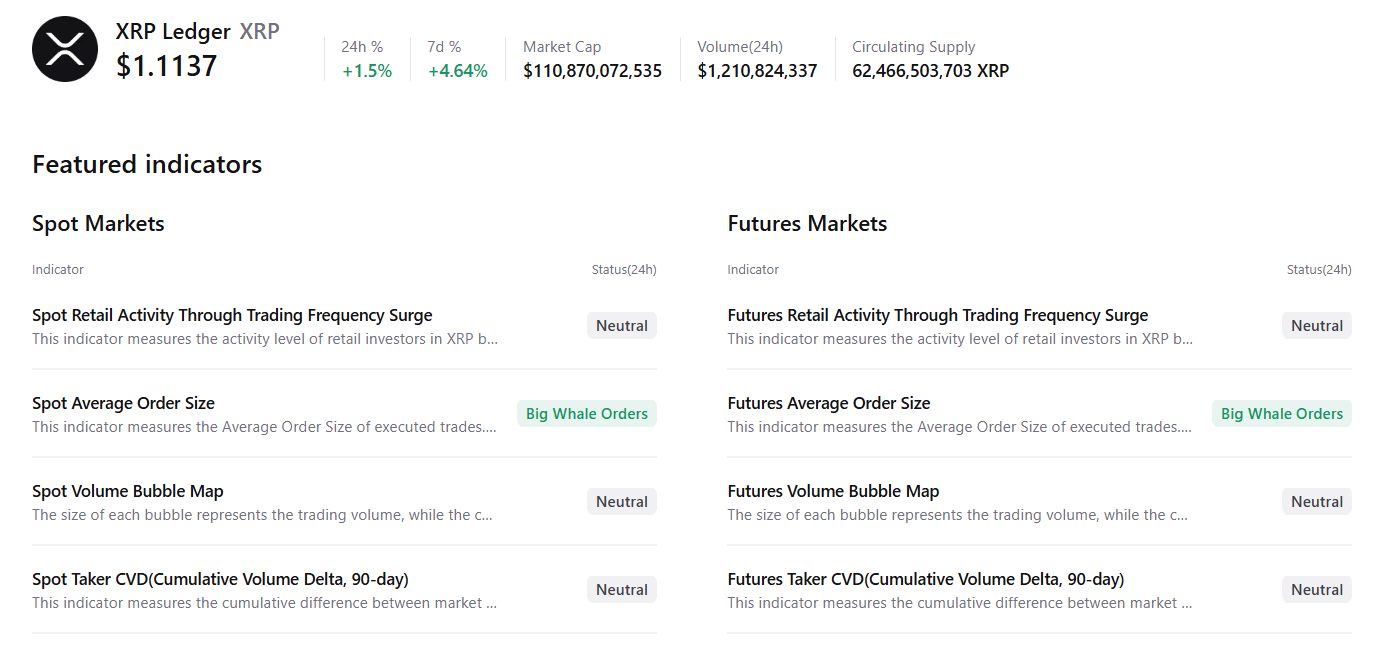
CryptoQuant’s summary data shows mixed bias. XRP’s spot and futures markets show large whale orders with neutral conditions in other metrics, supporting a potential recovery.
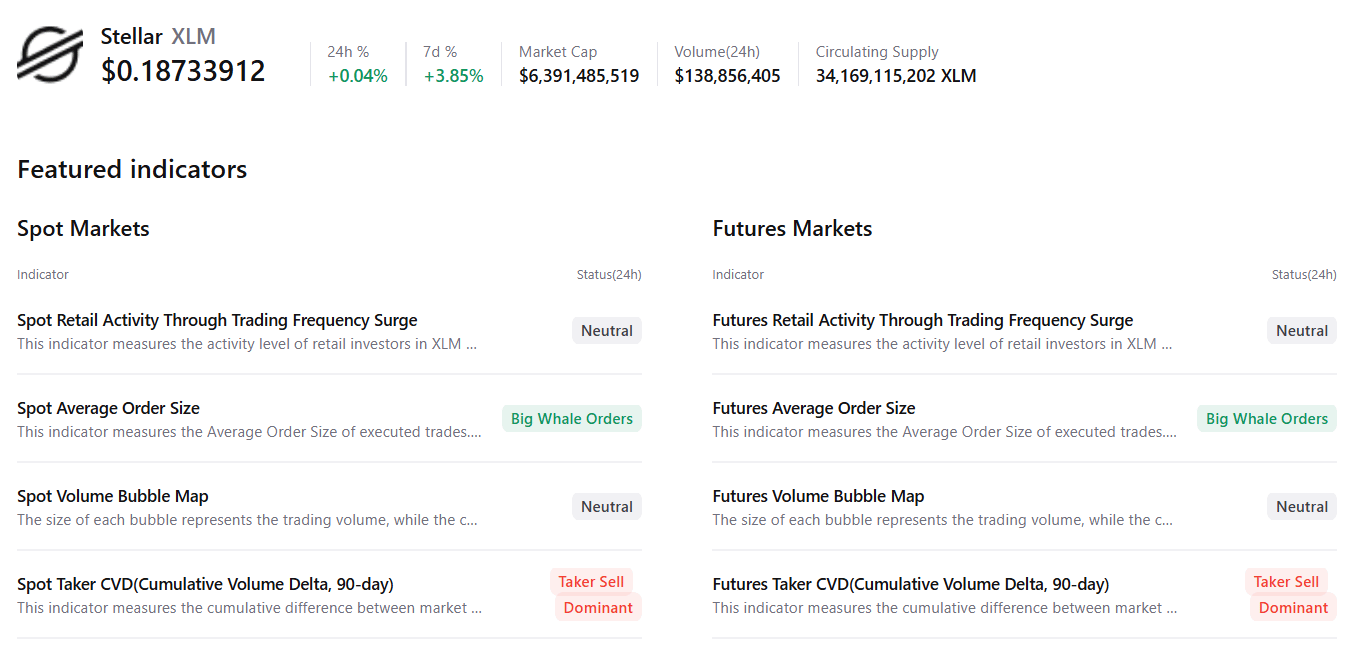
However, XLM shows selling-side dominance in both markets with large whale orders, hinting at cautious sentiment among traders and capping any potential recovery.
XRP technical outlook: Fading bearish strength
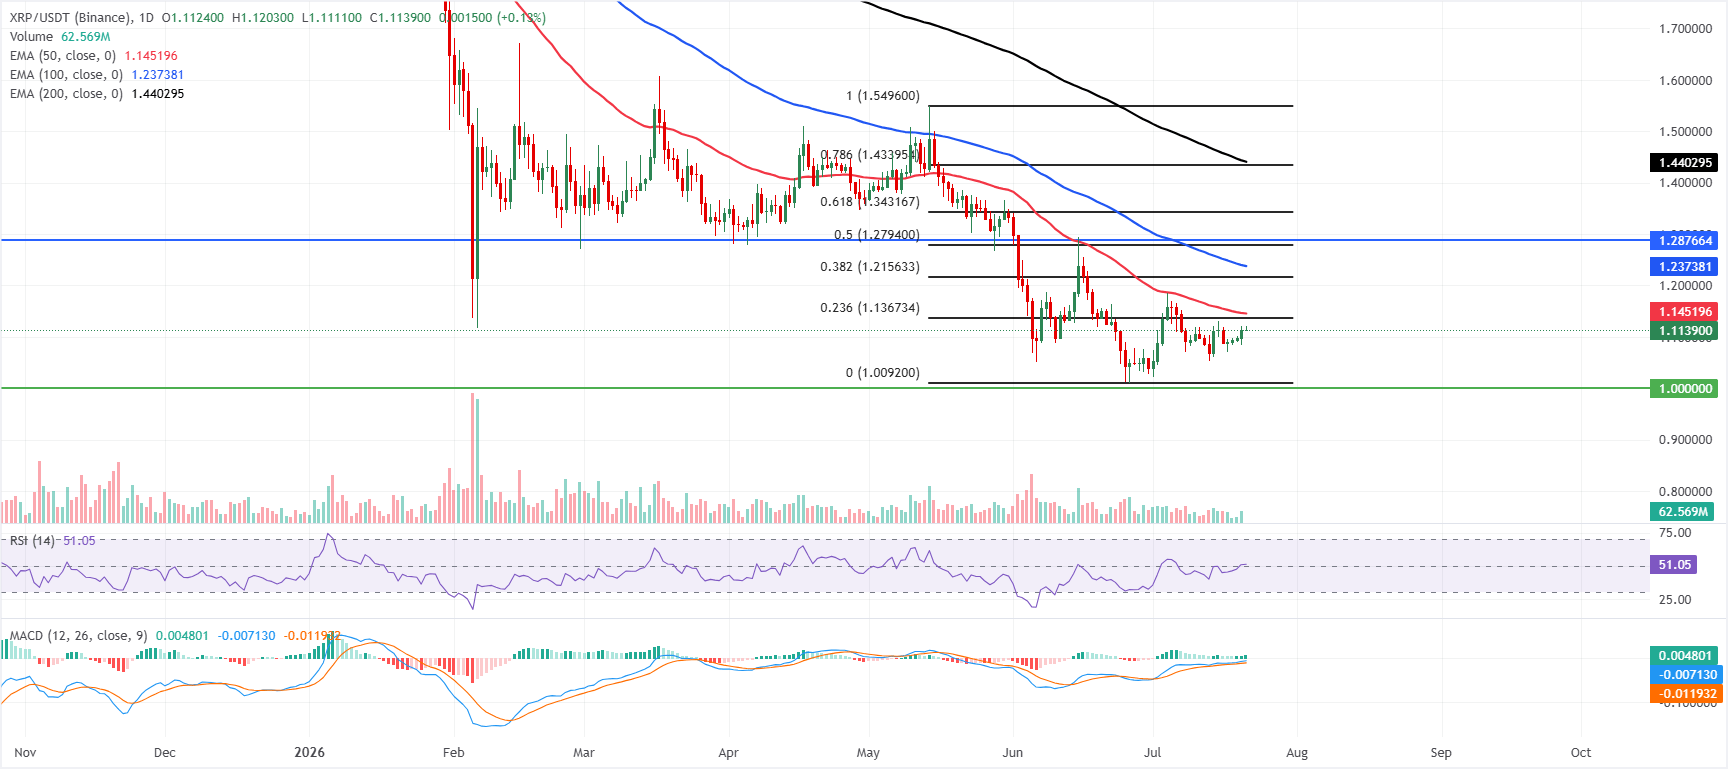
XRP price trades at $1.11 on Tuesday after a slight recovery in the previous day. However, XRP is holding below the short-, medium- and long-term Exponential Moving Averages (EMAs), which keeps the near-term bias capped despite improving momentum. The 50-day EMA at $1.14 and the 23.6% Fibonacci retracement at $1.13 sit just overhead as immediate resistance, while a mid-range Relative Strength Index (RSI) around 51 and a positive Moving Average Convergence Divergence (MACD) histogram hint that selling pressure is easing rather than reversing.
On the topside, initial resistance is clustered between the 23.6% Fibonacci retracement at $1.13 and the 50-day EMA at $1.14, followed by a broader structural band around the 38.2% Fibonacci retracement at $1.21 and the 100-day EMA at $1.23. Higher up, the 50% retracement level at $1.27 and the horizontal barrier at $1.28 precede deeper retracement resistance at $1.34, marking a more distant ceiling.
On the downside, immediate support is defined by the psychological horizontal floor at $1.00, where buyers would be expected to defend the broader bullish cycle.
XLM technical outlook: Consolidates around key support zones
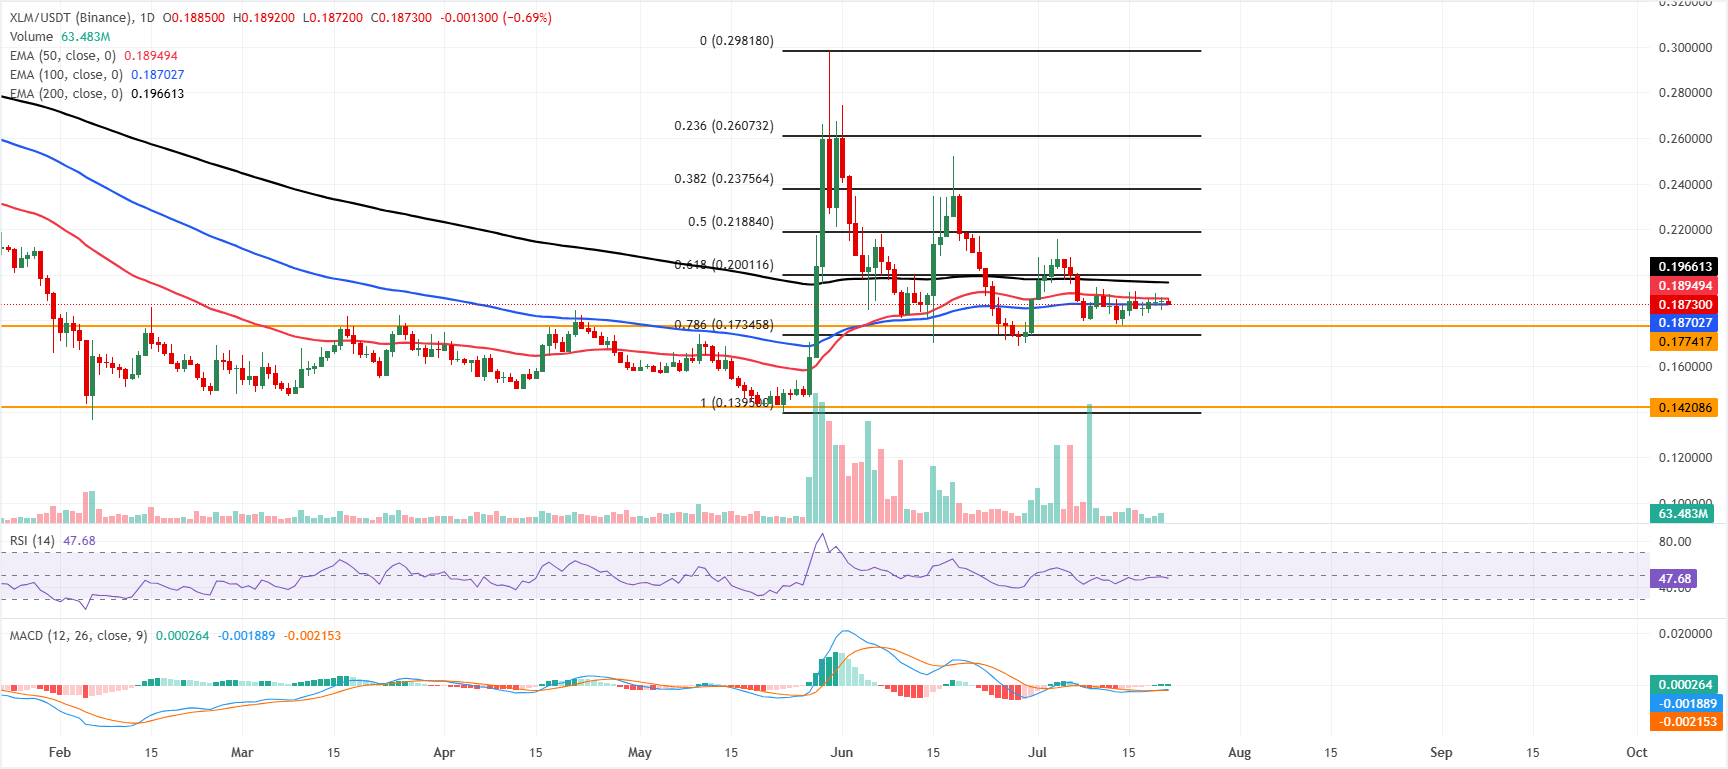
XLM price trades at $0.187 on Tuesday, consolidating below the key 50-day and 100-day EMAs around $0.187, keeping the near-term bias bearish despite a slight improvement in momentum. Price is marginally above the 100-day EMA at $0.187, hinting at tentative underlying support, while the RSI is near 47 and a mildly positive MACD reading suggests consolidative rather than impulsive selling pressure at current levels.
On the topside, immediate resistance is seen at the 50-day EMA at $0.189, followed by the 200-day EMA at $0.196 and the 61.8% Fibonacci retracement at $0.200.
On the downside, initial support comes from the 100-day EMA at $0.187, ahead of the horizontal floor at $0.177 and the 78.6% Fibonacci retracement at $0.173, with a deeper cushion only at the $0.142 horizontal level if bearish pressure resumes.
(The technical analysis of this story was written with the help of an AI tool. Know more.)
Bài viết đề xuất


