


Democrats win House and Senate in US midterms: Why isn’t all bad news for crypto
The biggest story this week was Tuesday’s US midterm elections, which saw Democrats win control of both the House and the Senate in a clear blue wave.
The results reflected US voters’ frustration with high prices and the state of the economy. That feeling helped Democratic candidates win even in areas that usually vote Republican.
This political shift in the US has triggered sharp price swings across the cryptocurrency market, as investors weighed the potential implications of a Democrat-controlled Congress, leading to extreme volatility and liquidations across risky assets this week.
Volatility triggers wave of liquidations
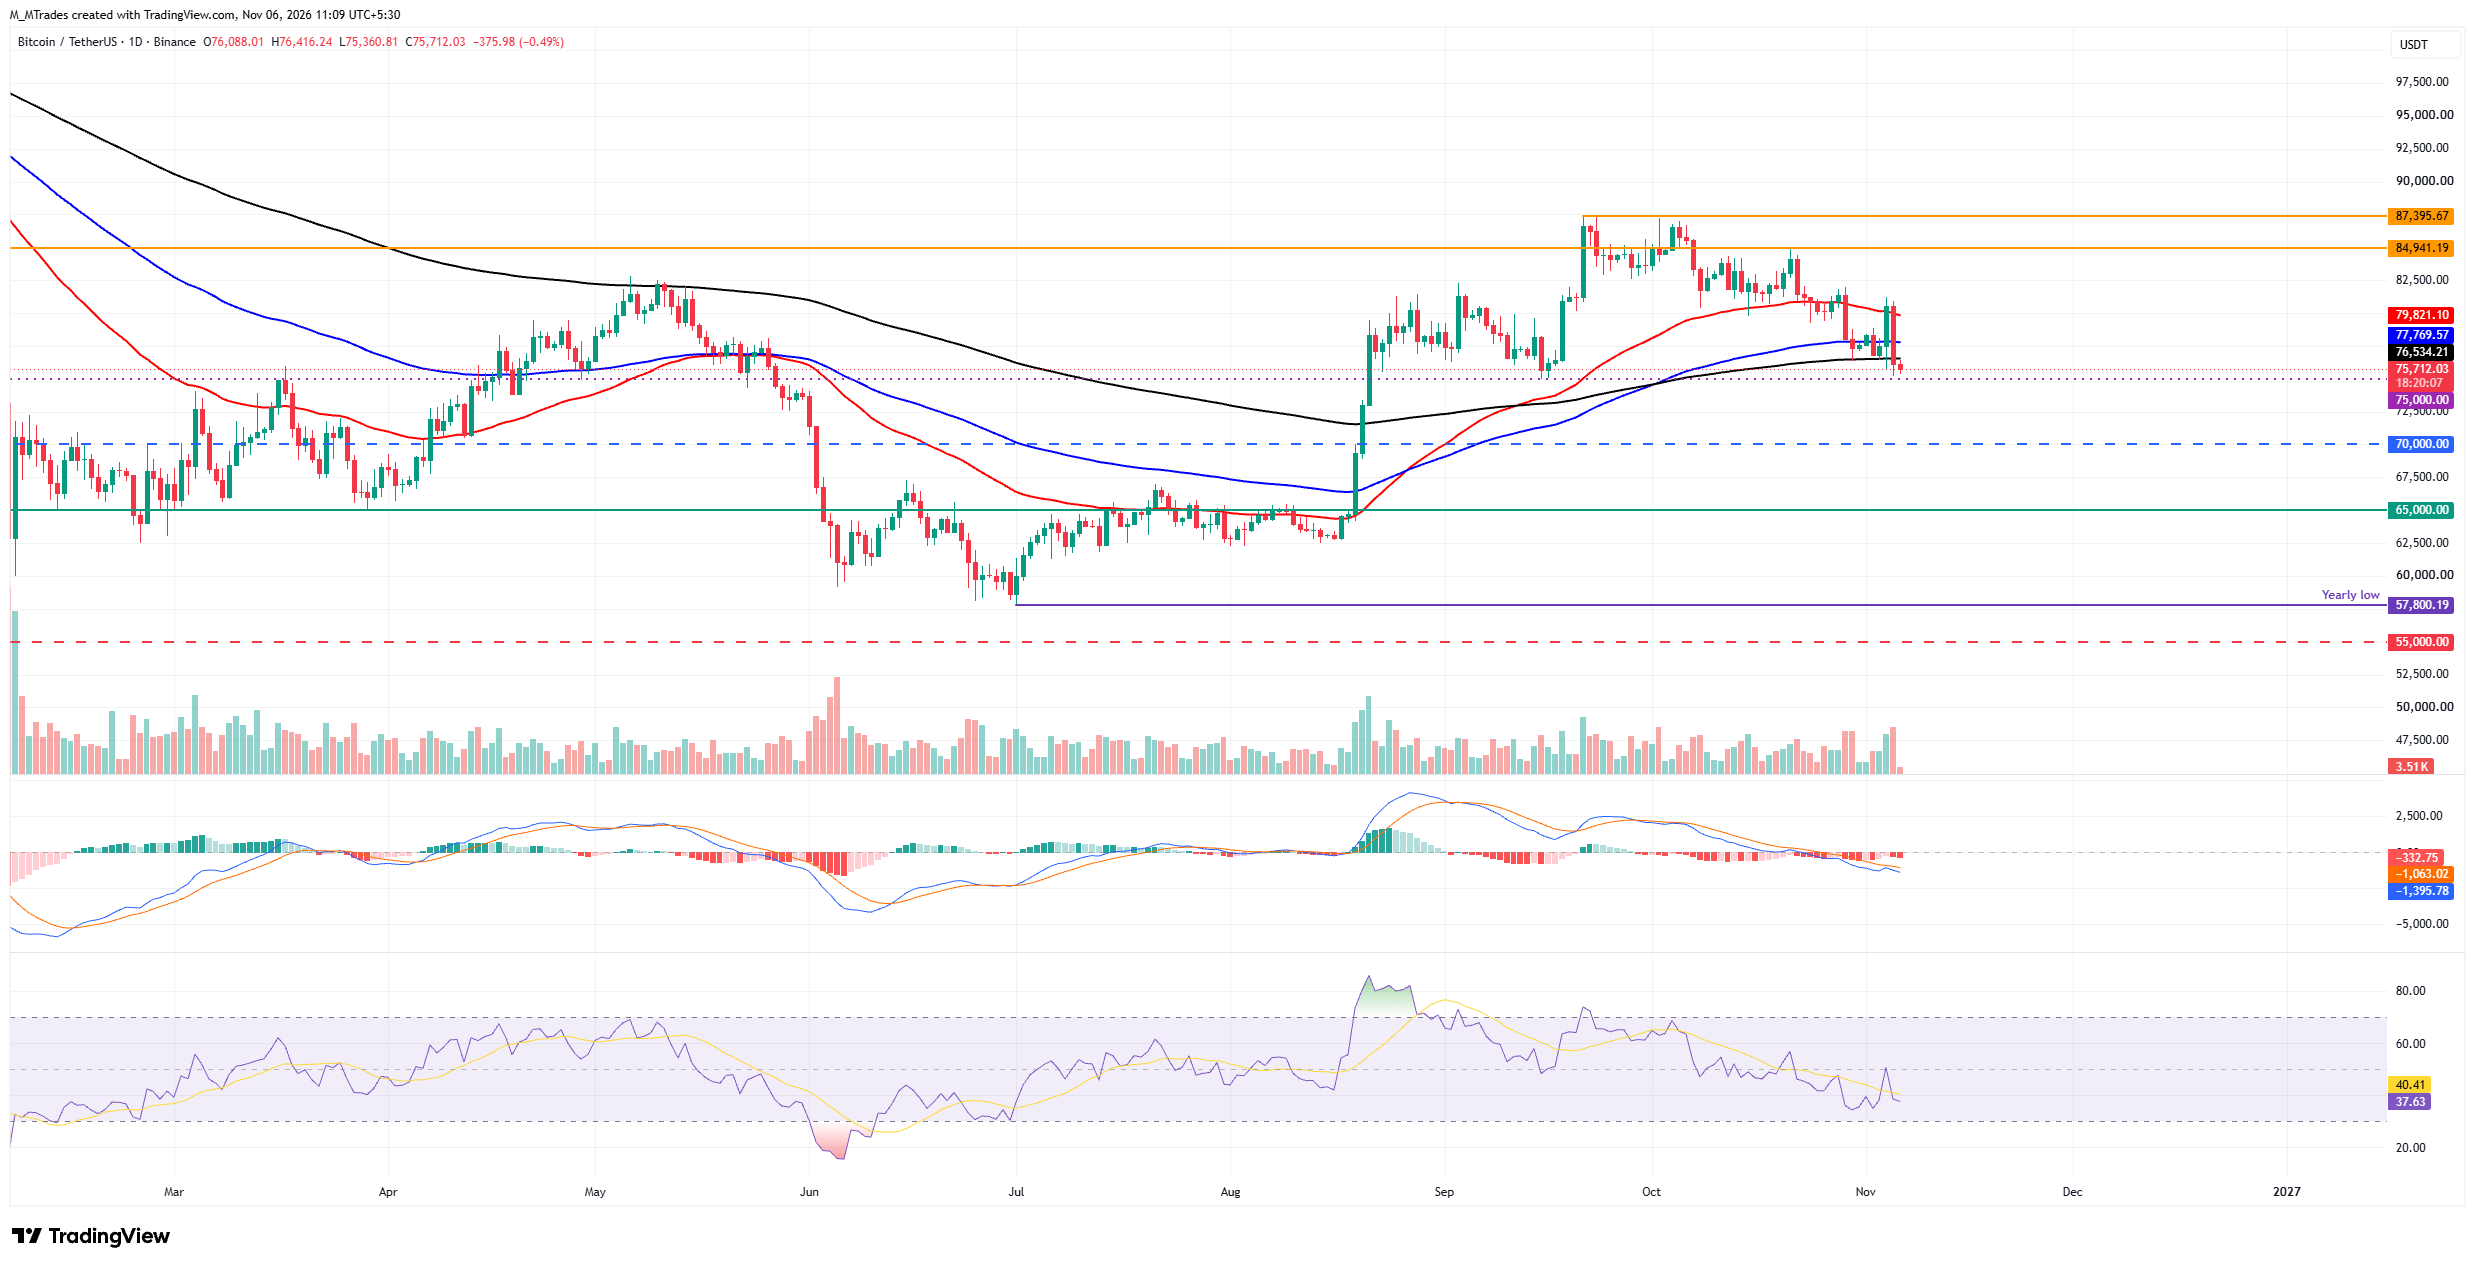
When major political news lands, the market reacts with extreme volatility. Bitcoin (BTC) briefly fell toward the mid-$75,000s as election results started coming out during the early Asian session on Wednesday, then climbed back once things became clearer and closed above $80,500, with nearly 4% gains that day.
However, this price was short-lived as it faced renewed selling pressure on Thursday, amid concerns that Democrats’ control of both chambers of the US Congress could lead to tighter crypto and Artificial Intelligence (AI) regulations. A sharp sell-off in US tech stocks on Thursday erased BTC's recent gains, with the Crypto King falling 5.49% and closing below the 200-day Exponential Moving Average (EMA) support around $76,534.
Momentum also shows weakening signs, with the daily Relative Strength Index (RSI) around 37 and pointing down toward oversold conditions, indicating a strong bearish trend. Adding to this, the Moving Average Convergence Divergence (MACD) remains in negative territory, with rising red histogram bars further suggesting a bearish outlook for BTC.
BTC continues to trade in red on Friday, moving below $75,800 at the time of writing.
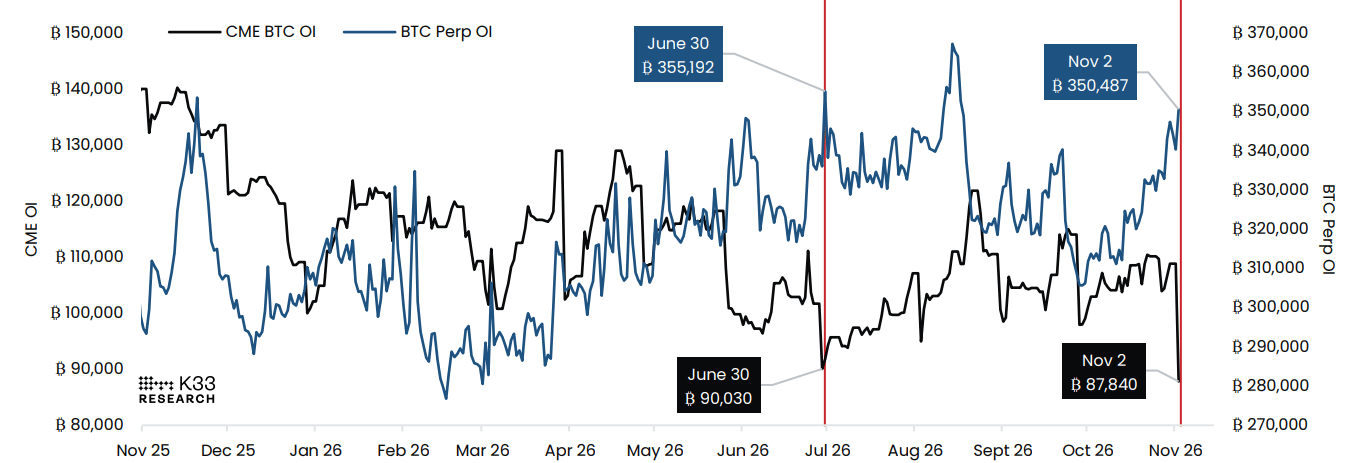
The volatile move in either direction after the midterms was expected, given the divergence between Bitcoin’s Chicago Mercantile Exchange (CME) futures and perpetual (perp) futures positioning, along with three-month implied volatility hovering near historic lows.
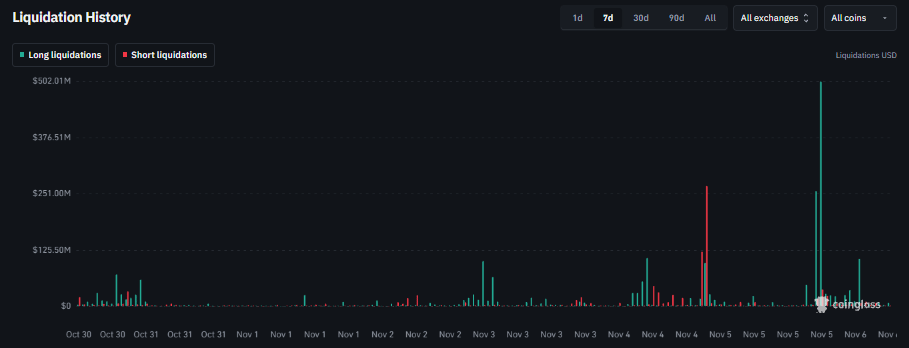
Over $2.25 billion in positions were liquidated from the crypto market amid the US midterm elections. Wednesday’s rebound triggered mostly short positions, while Thursday’s decline wiped out longs, as shown in the chart below. These liquidations signal a sharp shift in sentiment and highlight uncertainty and leveraged positioning across the sector.
Political gridlock could benefit crypto
Gridlock in Washington can actually help cryptocurrencies. With divided power between Congress and the White House, fewer major policy surprises can suddenly hit risk assets.
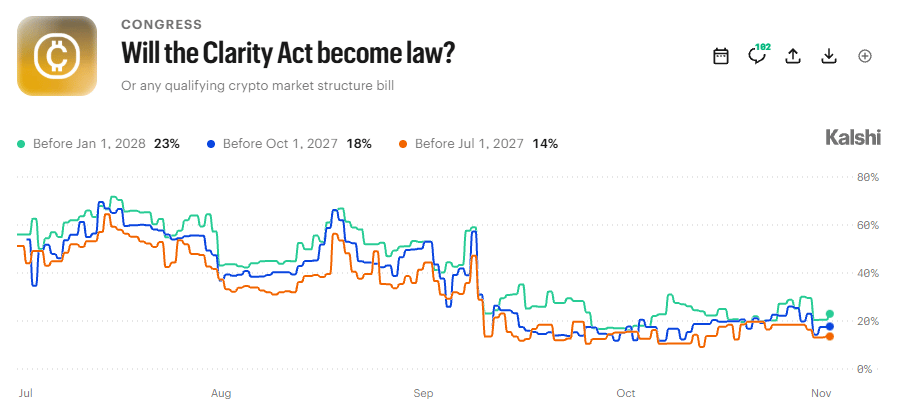
However, Democrats controlling both the House and Senate also raises a real warning for the crypto industry. It could stall or delay important related legislation such as the CLARITY Act.
Prediction markets like Kalshi have already priced in a tougher path for industry-friendly bills, with the odds of the CLARITY Act passing before July 1, 2027 having fallen to 14%, down from 19% before the US midterm elections on November 1.
The outlook has also weakened over longer time horizons. Over the same period mentioned above, the odds of the CLARITY Act passing before October 1, 2027 and January 1, 2028, have dropped to 18% and 23% from 27% and 29%, respectively.
Binance hack still lingers
Meanwhile, last week’s Binance hack is still in the background. Midterm election headlines have taken most of the attention, but security concerns remain.
So far, Binance is absorbing the full financial impact and has replenished 98% of the affected user balances through its own corporate treasury, SAFU fund, and other internal resources.
However, roughly $3 billion in stolen assets remains under the attackers’ control, mostly in BTC and ETH, which cannot be easily frozen. If these funds start moving again, that could bring fresh FUD (fear, uncertainty, and doubt) back into the market.
What does this mean for the crypto market?
Overall, the Democrats’ victory has added uncertainty to the industry, as investors assess the potential impact of a Democrat-controlled Congress on crypto and AI regulations when the new Congress convenes on January 3, 2027.
Despite this political shift in Washington, interest rate decisions, geopolitical developments in the Middle East, overall market liquidity and demand for Exchange Traded Funds (ETFs) are likely to play a greater role in driving crypto prices.
Cryptocurrency metrics FAQs
The developer or creator of each cryptocurrency decides on the total number of tokens that can be minted or issued. Only a certain number of these assets can be minted by mining, staking or other mechanisms. This is defined by the algorithm of the underlying blockchain technology. On the other hand, circulating supply can also be decreased via actions such as burning tokens, or mistakenly sending assets to addresses of other incompatible blockchains.
Market capitalization is the result of multiplying the circulating supply of a certain asset by the asset’s current market value.
Trading volume refers to the total number of tokens for a specific asset that has been transacted or exchanged between buyers and sellers within set trading hours, for example, 24 hours. It is used to gauge market sentiment, this metric combines all volumes on centralized exchanges and decentralized exchanges. Increasing trading volume often denotes the demand for a certain asset as more people are buying and selling the cryptocurrency.
Funding rates are a concept designed to encourage traders to take positions and ensure perpetual contract prices match spot markets. It defines a mechanism by exchanges to ensure that future prices and index prices periodic payments regularly converge. When the funding rate is positive, the price of the perpetual contract is higher than the mark price. This means traders who are bullish and have opened long positions pay traders who are in short positions. On the other hand, a negative funding rate means perpetual prices are below the mark price, and hence traders with short positions pay traders who have opened long positions.
Bài viết đề xuất


