


Crypto Today: Bitcoin, Ethereum, XRP fall as hawkish Fed tone weighs on sentiment
- Bitcoin slips to $80,000 on Thursday as the Fed holds rates steady while keeping a hawkish stance.
- Ethereum corrects, trading near the key 200-day EMA at $2,316, with a close below potentially triggering a deeper correction.
- XRP trades below key support at $1.300, at risk of further decline if it fails to hold.
Bitcoin (BTC), Ethereum (ETH) and Ripple (XRP) face a pullback on Thursday as the Federal Reserve’s (Fed) hawkish tone following its decision to hold interest rates steady weighs on broader cryptocurrency market sentiment. BTC slips toward $80,000, while ETH approaches its 200-day Exponential Moving Average (EMA) at $2,316 and XRP trades below the $1.300 support level, putting all three cryptocurrencies at risk of further losses.
Fed rate hold and hawkish stance weigh on BTC, ETH and XRP
The Fed held its policy rate steady at 3.75%-4.00% on Wednesday after its two-day October policy meeting. The decision wasn’t unanimous. Among the two officials who wanted a 25-basis-point hike were Lisa Cook and Beth Hammack, while Chair Kevin Warsh said the Fed would use the coming flow of information to decide whether further action is needed.
Warsh said during his press conference that officials have “made clear our readiness to act as circumstances require, and we have shown our willingness to act.”
“It’s our responsibility to get inflation down,” Warsh highlighted. “That’s the reason the FOMC’s discussion over the last couple of days focused mainly on the price stability side of our remit,” he added.
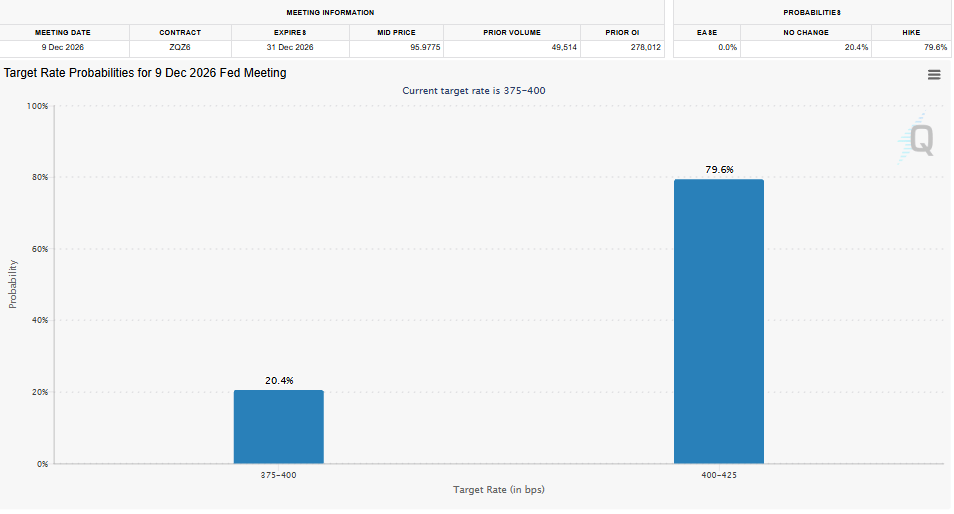
Market participants had already priced in steady rates, but the hawkish undertone and inflation concerns in forward guidance add to a cautious market backdrop and weigh on risky assets such as cryptos. According to the CME FedWatch Tool, the probability of the Fed tightening at the December 9 meeting rose slightly to 79.6% on Thursday, up from 78.33% on Tuesday. The shift toward tighter monetary policy is mildly supporting safe-haven assets, with the 10-year Treasury yield holding above 5% and the US Dollar Index (DXY) above $102, while weighing on risky assets such as BTC, ETH and XRP, which slid to $80,000, $2,300 and $1.300, respectively on Thursday.
Meanwhile, the stronger-than-expected economic growth and persistent inflation data on Thursday are further supporting the USD while capping the broader crypto market.
The US annual Personal Consumption Expenditures (PCE) inflation accelerated to 3.6% YoY in September from 3.4% in August, matching market estimates; monthly PCE came in at 0.5% from the previous 0.3%. Core PCE, excluding fluctuating food and energy costs, rose 3.1% from a year earlier and 0.3% monthly. Moreover, the US Gross Domestic Product (GDP) grew at an annual rate of 3.4% in the third quarter, the US Bureau of Economic Analysis' (BEA) first estimate showed on the same day. This print followed the 2.2% expansion recorded in the second quarter and came in better than the market expectations of 3.2%.
Bitcoin ETFs see inflows, Ethereum outflows and XRP stays muted
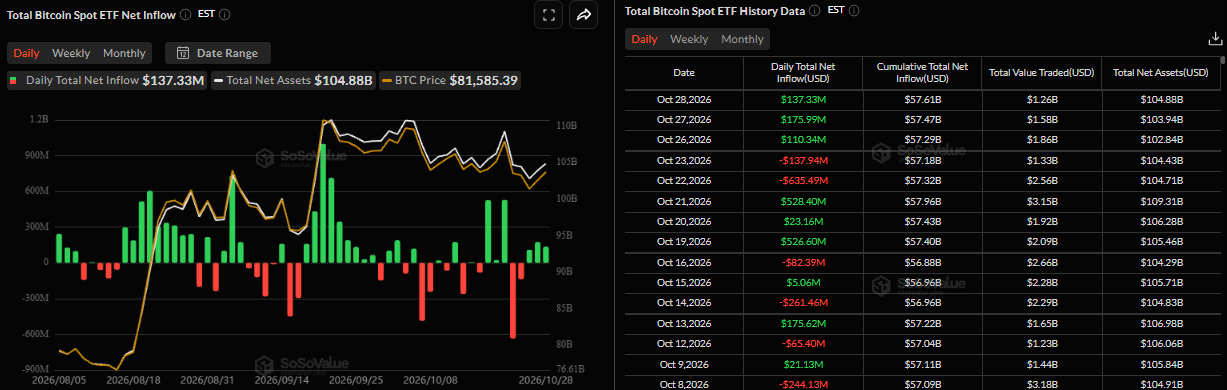
Appetite for digital asset investment products remains mixed so far this week. SoSoValue data showed that spot Bitcoin ETFs recorded inflows of $137.33 million on Wednesday, marking the third consecutive week of inflows. These daily inflows so far indicate modest institutional buying interest but remain less substantial than last week, suggesting investors are taking a cautious approach.
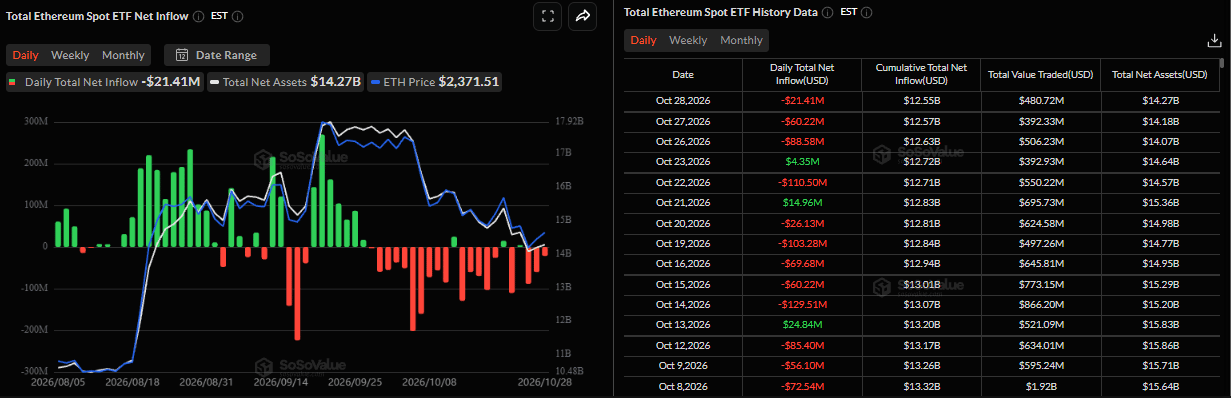
For ETH, institutional demand showed signs of weakness. SoSoValue data showed that spot Ethereum ETFs recorded a slight outflow of $21.41 million on Wednesday, marking the third consecutive day of withdrawals.
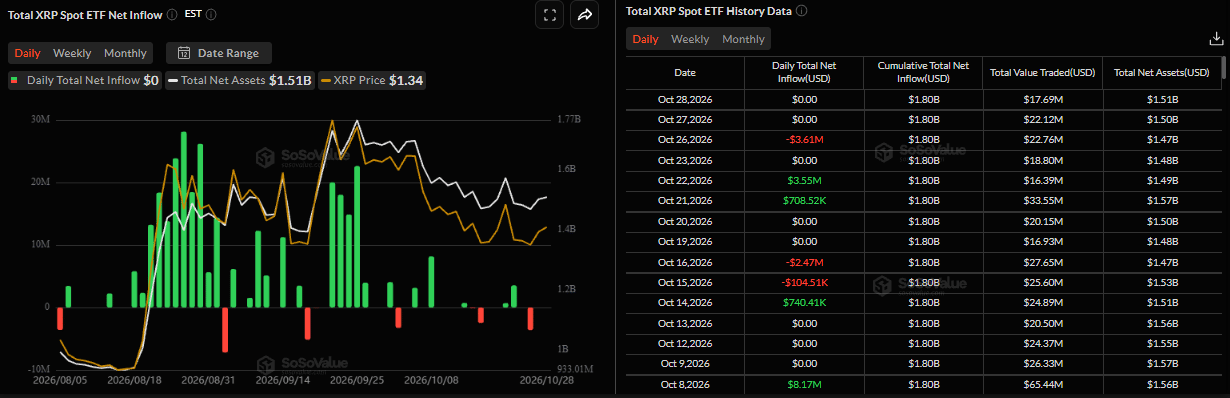
Meanwhile, institutional demand for XRP remained muted on Wednesday and Tuesday, while Monday saw a mild outflow of $3.61 million, indicating fading demand and interest among traders.
Technical analysis: Bitcoin weakens
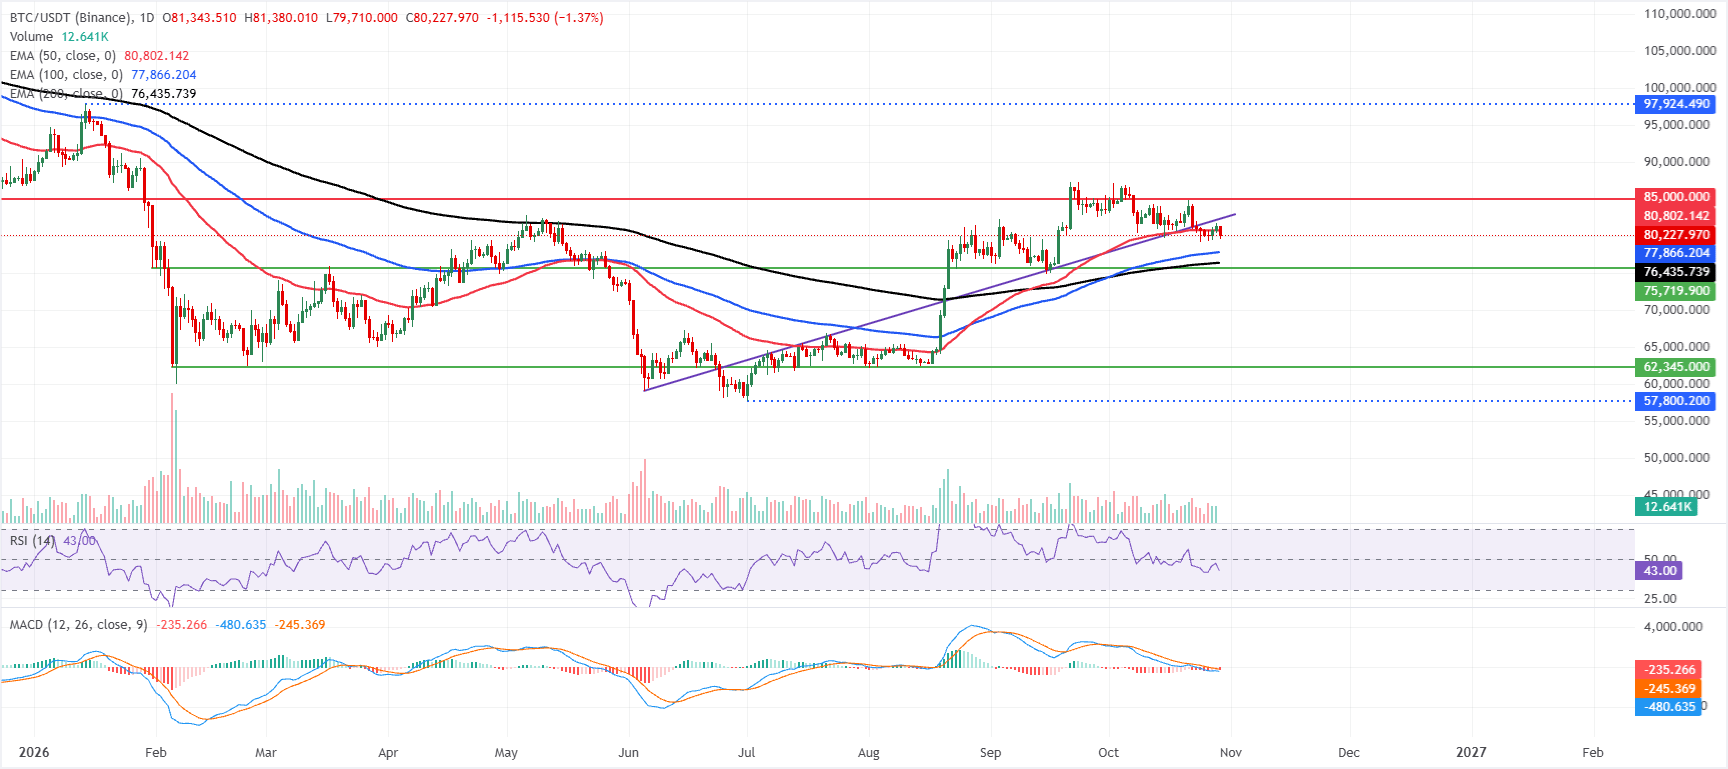
Bitcoin price trades at $80,227 on Thursday, holding above the 100-day and 200-day Exponential Moving Averages (EMAs) at $77,866 and $76,435, respectively, but capped by the 50-day EMA at $80,802.
This setup suggests a neutral-to-bearish near-term tone, with price losing upside momentum as the Relative Strength Index (RSI) slips to 43. At the same time, the Moving Average Convergence Divergence (MACD) remains in negative territory and below its zero line, suggesting fading bullish pressure despite the broader uptrend base still intact above the longer EMAs.
On the topside, immediate resistance is seen at the 50-day EMA near $80,802, followed by the horizontal barrier at $85,000, where previous supply could re-emerge.
On the downside, the first meaningful support sits at the 100-day EMA around $77,866, ahead of a deeper structural floor at the 200-day EMA near $76,435; a daily close below these levels would reinforce the bearish bias and open the door to a more pronounced corrective phase.
Technical analysis: Ethereum retains bearish near-term bias, XRP slips below support
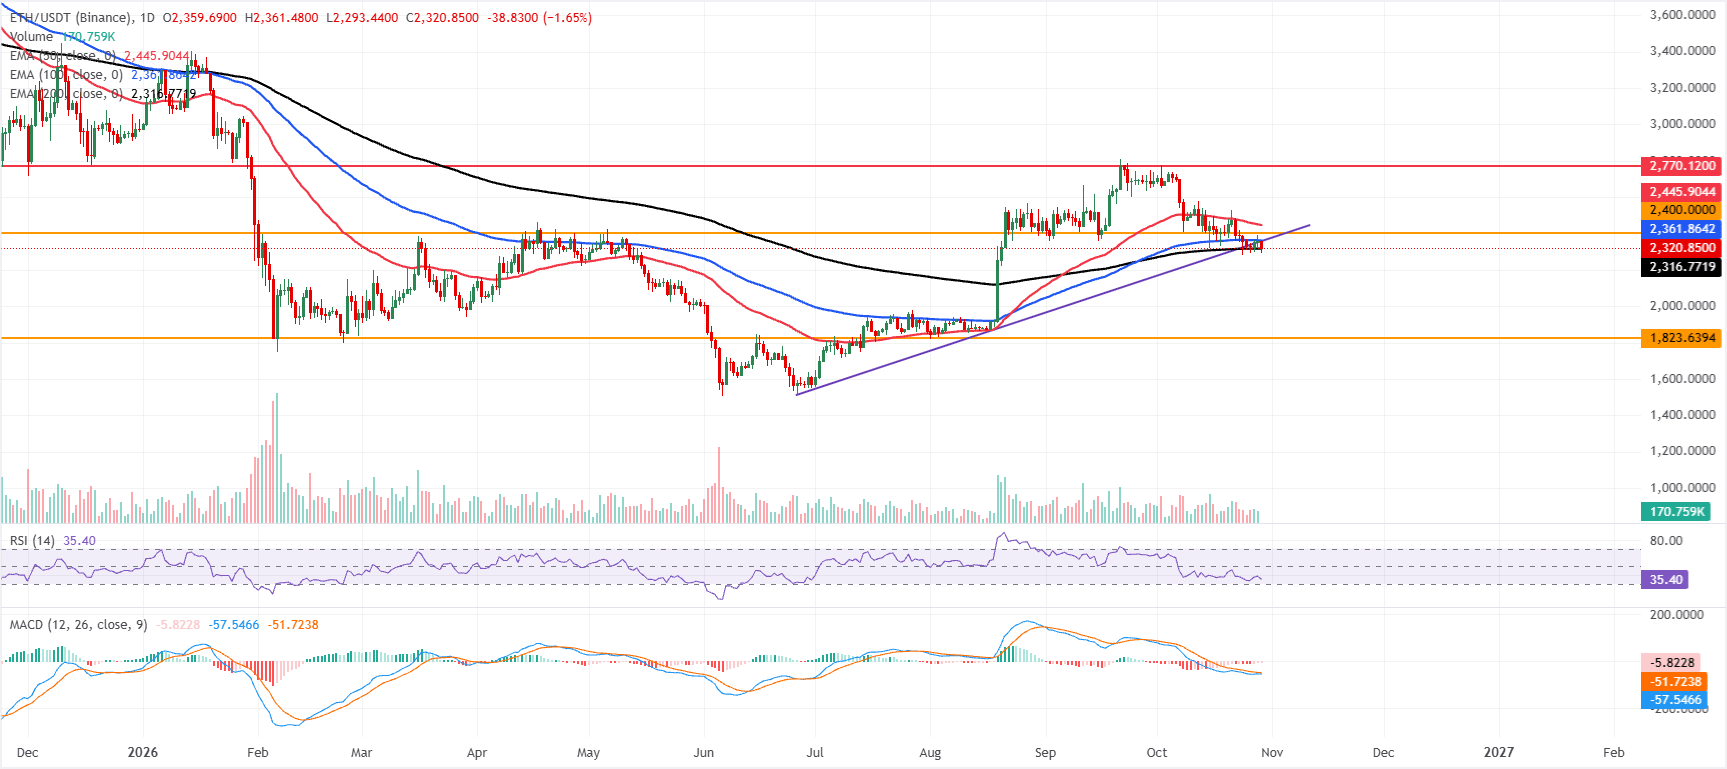
Ethereum price trades at $2,320, retaining a bearish near-term bias as price has slipped just under the 100-day and 50-day EMAs at $2,361 and $2,445 respectively, while clinging to the 200-day EMA support at $2,316. ETH has also fallen back below the broken ascending trendline reference near $2,360 and remains capped beneath the horizontal barrier at $2,400. At the same time, a subdued RSI around 35 and a negative but improving MACD line suggest weak but stabilizing downside momentum rather than a decisive bullish turn.
On the downside, immediate support is essentially the current price area backed by the 200-day EMA at $2,316, with a deeper structural floor seen at the horizontal level around $1,823.
On the topside, initial resistance is located at the former trendline and short-term pivot near $2,360, followed by the $2,400 horizontal cap; a sustained break above these would expose the 50-day EMA at $2,445 and, further up, the higher resistance zone around $2,770.
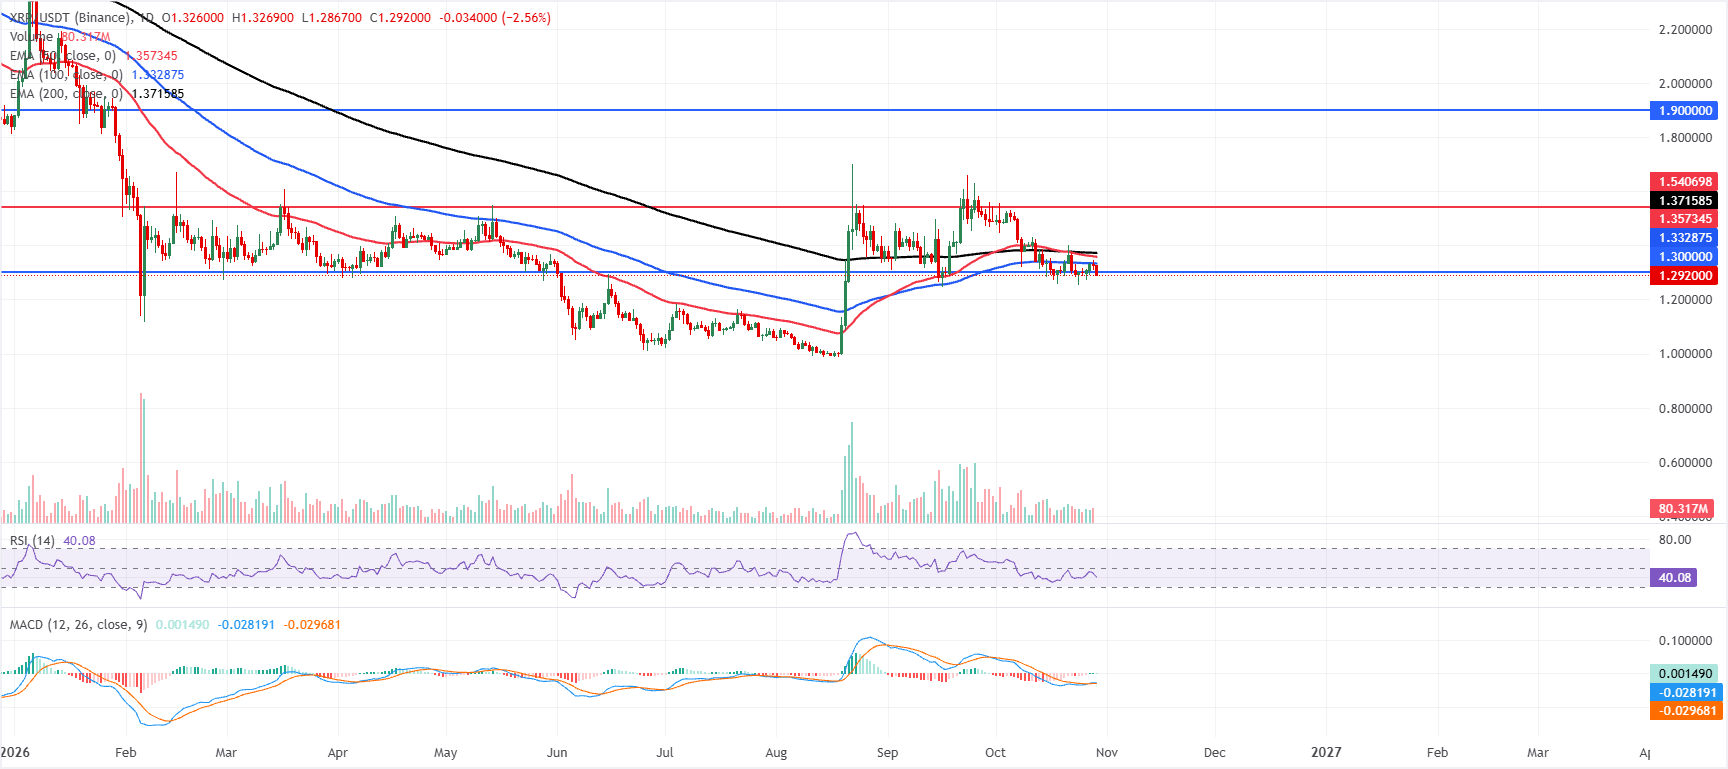
XRP trades at $1.292, maintaining a bearish near-term tone as spot holds beneath all key Exponential Moving Averages (EMAs). The 100-day EMA at $1.332, the 50-day EMA at $1.357, and the 200-day EMA at $1.371 sit overhead as a layered cap, suggesting rallies remain vulnerable as long as price stays below this cluster.
Momentum is mixed: the RSI at 40 leans soft and below neutral, while the MACD has just turned marginally positive, hinting at only tentative attempts to stabilize rather than a clear bullish reversal.
On the topside, initial resistance is seen at the nearby horizontal level of $1.300, with further barriers at the 100-day EMA around $1.332 and the 50-day EMA at $1.357. Above these, the 200-day EMA at $1.371 reinforces a broader corrective ceiling, ahead of higher resistance levels at $1.540 and $1.900. With no meaningful support levels defined below the current price in the present dataset, any downside extension would leave XRP exposed to fresh selling until new demand zones emerge on the chart.
(The technical analysis of this story was written with the help of an AI tool. Know more.)
Cryptocurrency prices FAQs
Token launches influence demand and adoption among market participants. Listings on crypto exchanges deepen the liquidity for an asset and add new participants to an asset’s network. This is typically bullish for a digital asset.
A hack is an event in which an attacker captures a large volume of the asset from a DeFi bridge or hot wallet of an exchange or any other crypto platform via exploits, bugs or other methods. The exploiter then transfers these tokens out of the exchange platforms to ultimately sell or swap the assets for other cryptocurrencies or stablecoins. Such events often involve an en masse panic triggering a sell-off in the affected assets.
Macroeconomic events like the US Federal Reserve’s decision on interest rates influence crypto assets mainly through the direct impact they have on the US Dollar. An increase in interest rate typically negatively influences Bitcoin and altcoin prices, and vice versa. If the US Dollar index declines, risk assets and associated leverage for trading gets cheaper, in turn driving crypto prices higher.
Halvings are typically considered bullish events as they slash the block reward in half for miners, constricting the supply of the asset. At consistent demand if the supply reduces, the asset’s price climbs.
Bài viết đề xuất


