

Solana Price Forecast: SOL stalls around $100 amid weak institutional demand

Nguồn Fxstreet
  • Solana hovers above $100 on Monday after a 2% decline the previous week, marking its third straight week of losses.
  • SOL-focused ETFs recorded over $8 million in outflows on Friday, bringing their weekly total to more than $17 million.
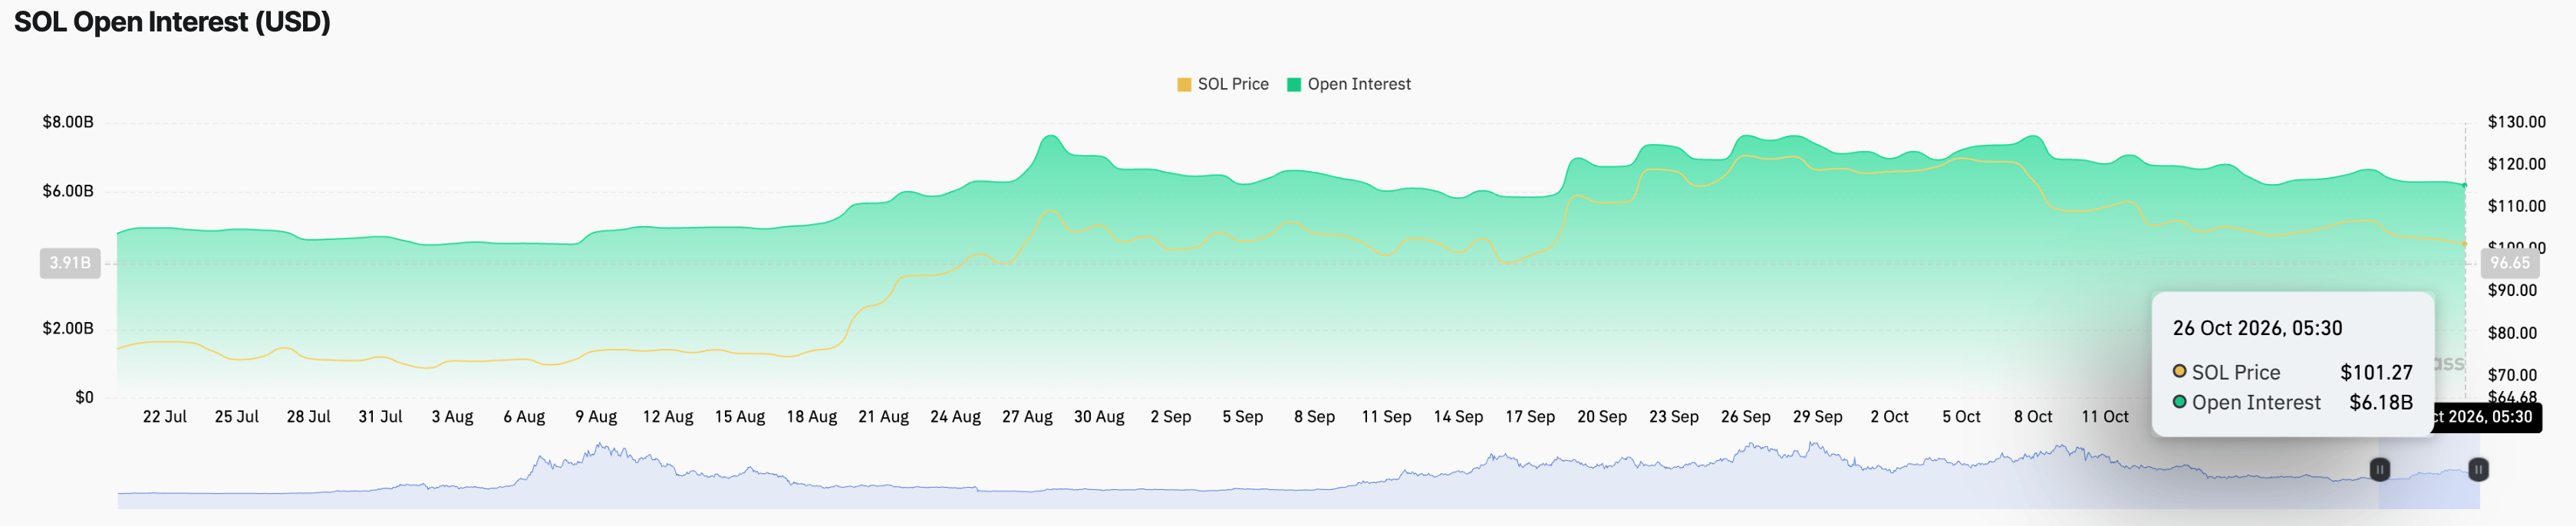
  • Solana loses retail demand, with its futures Open Interest declining to $6.18 billion, from $6.34 billion last week.

Solana (SOL) price sustains above $100 on Monday, maintaining a near-term bearish bias after three consecutive weeks of losses, including a 2% decline last week. SOL-focused Exchange Traded Funds (ETFs) continue to face selling pressure from institutional investors, resulting in the third weekly outflow of over $17 million, while retail demand eases as Open Interest declines. The technical outlook for SOL is bearish, pressuring the long-term support of the 200-day Exponential Moving Average (EMA) around $98.

Solana ETFs face persistent selling pressure

Solana-focused ETFs face their third straight weekly outflow, with $17.30 million last week, bringing the monthly total to $72.24 million. Another week of outflows could push the monthly total above $1 million, marking the largest monthly outflow since June’s $786,580. Typically, ETF outflows suggest institutional investors are selling shares, reflecting reduced confidence in the underlying asset.

On the retail side, Solana futures are losing demand. CoinGlass data shows that SOL futures Open Interest (OI) is down to $6.18 billion on Monday, from $6.34 billion last week, indicating a reduced notional value of active contracts amid a declining spot price and a potential positional wipeout.

Taken together, the Layer-1 token continues to face weak demand, despite last week’s Alpenglow upgrade, which replaced the old TowerBFT system with a new engine, Votor, reducing transaction finality from roughly 12 seconds to a targeted 150 milliseconds.
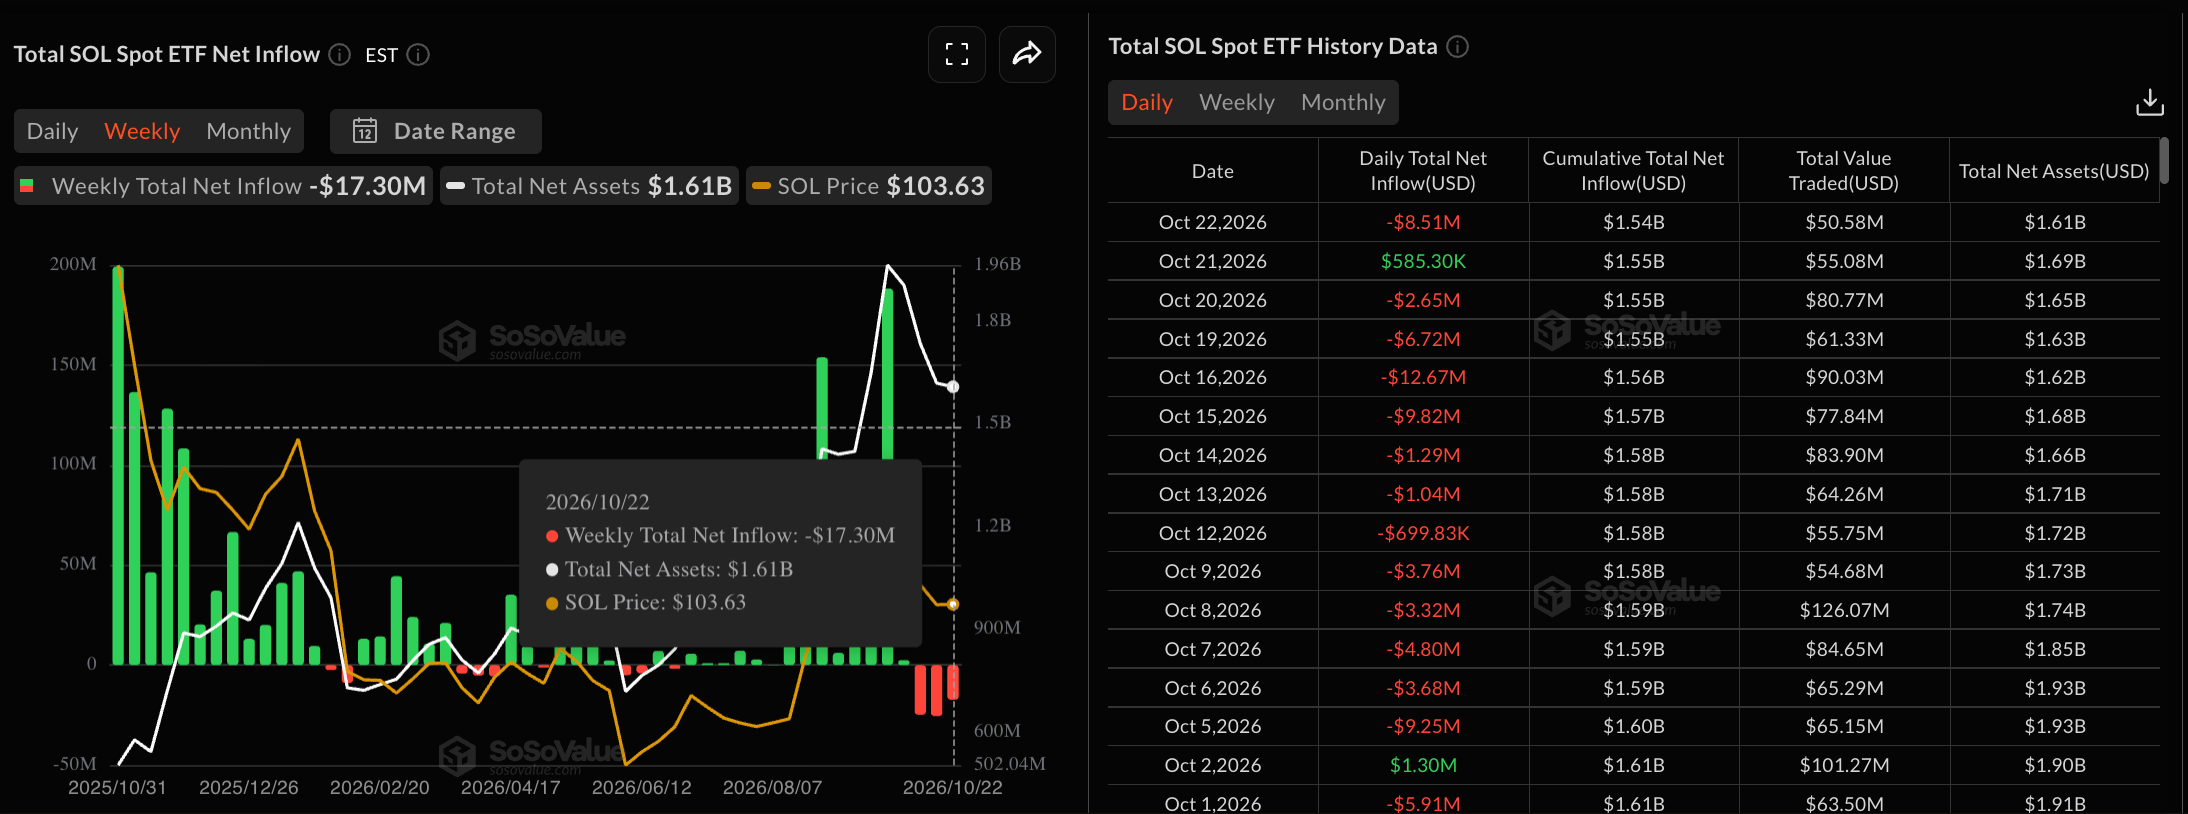
SOL ETFs data. Source: Sosovalue
SOL Open Interest chart. Source: CoinGlass

Technical outlook: Will SOL price rebound from $100?

Solana trades at $101.45 at press time on Monday, retaining a capped bias below the 50-day EMA at $105.99 while staying above the 200-day EMA at $98.27. This split in the major averages suggests a corrective phase within a broader uptrend, with the upward-sloping support trendline around $86.67 reinforcing the underlying structure.

Momentum remains soft, as the Relative Strength Index (RSI) is at 36 on the daily chart, while the Moving Average Convergence Divergence (MACD) line is marginally below the signal line in negative territory, hinting at persistent downside pressure.

The 200-day EMA at $98.27 offers the first meaningful layer of support, and a confirmed break below it could extend the decline toward the rising trendline near $86.67, where stronger buying interest would be expected if the pullback continues.

Chart Analysis SOL/USDT (Binance)
SOL/USDT daily price chart.

On the topside, initial resistance is located at the 50-day EMA near $105.99, which guards the path toward the more distant horizontal barrier at the September 25 high of $122.94.

(The technical analysis of this story was written with the help of an AI tool. Know more.)

Tuyên bố miễn trừ trách nhiệm: Chỉ dành cho mục đích thông tin. Hiệu suất trong quá khứ không đảm bảo cho kết quả trong tương lai.
placeholder
Nhìn lại lịch sử giá vàng trong 50 năm qua. Liệu vàng còn tiếp tục thời kỳ hoàng kim thêm 50 năm nữa? Trong 50 năm qua, vàng vẫn luôn giữ được vị thế là tài sản được ưa chuộng và phổ biến nhất thế giới. Giao dịch vàng luôn được các nhà đầu tư quan tâm do mức độ thanh khoản cao và tầm ảnh hưởng lớn đến toàn bộ thị trường tài chính. Vậy, lịch sử giá vàng như thế nào và cách đầu tư vàng ra sao? Chúng ta sẽ cùng tìm hiểu qua bài viết dưới đây.
Tác giả  Nhóm Traderins
ngày11 tháng 12 năm 2023
Trong 50 năm qua, vàng vẫn luôn giữ được vị thế là tài sản được ưa chuộng và phổ biến nhất thế giới. Giao dịch vàng luôn được các nhà đầu tư quan tâm do mức độ thanh khoản cao và tầm ảnh hưởng lớn đến toàn bộ thị trường tài chính. Vậy, lịch sử giá vàng như thế nào và cách đầu tư vàng ra sao? Chúng ta sẽ cùng tìm hiểu qua bài viết dưới đây.
placeholder
WTI đạt mức tăng khiêm tốn trên mức 88,50$ nhờ mức giảm bất ngờ của EIA, xung đột ở Trung Đông được chú ýWest Texas Intermediate (WTI), chuẩn dầu thô của Mỹ, đang giao dịch quanh mức 88,55$ trong đầu phiên giao dịch châu Á vào thứ Năm. WTI ghi nhận mức tăng khiêm tốn khi tồn kho dầu thô Mỹ bất ngờ giảm vào tuần trước
Tác giả  FXStreet
10 tháng 08 ngày Thứ Năm
West Texas Intermediate (WTI), chuẩn dầu thô của Mỹ, đang giao dịch quanh mức 88,55$ trong đầu phiên giao dịch châu Á vào thứ Năm. WTI ghi nhận mức tăng khiêm tốn khi tồn kho dầu thô Mỹ bất ngờ giảm vào tuần trước
placeholder
Chỉ số đô la Mỹ giảm từ mức đỉnh 18 tháng; trượt xuống dưới 102,50Chỉ số Đô la Mỹ (DXY), theo dõi đồng bạc xanh so với một rổ tiền tệ, giảm nhẹ trong phiên châu Á vào thứ Ba, xóa bớt một phần mức tăng mạnh của ngày hôm trước lên mức cao mới kể từ tháng 4 năm 2025.
Tác giả  FXStreet
10 tháng 13 ngày Thứ Ba
Chỉ số Đô la Mỹ (DXY), theo dõi đồng bạc xanh so với một rổ tiền tệ, giảm nhẹ trong phiên châu Á vào thứ Ba, xóa bớt một phần mức tăng mạnh của ngày hôm trước lên mức cao mới kể từ tháng 4 năm 2025.
placeholder
Yên Nhật tăng lên mức cao nhất trong một tuần khi lợi suất trái phiếu Mỹ giảm gây áp lực lên USDCặp USD/JPY kéo dài đà giảm do bị từ chối của ngày hôm trước từ khu vực 159,00, hay đỉnh ba tuần, thu hút một số lực bán tiếp diễn trong phiên giao dịch châu Á vào thứ Năm.
Tác giả  FXStreet
10 tháng 15 ngày Thứ Năm
Cặp USD/JPY kéo dài đà giảm do bị từ chối của ngày hôm trước từ khu vực 159,00, hay đỉnh ba tuần, thu hút một số lực bán tiếp diễn trong phiên giao dịch châu Á vào thứ Năm.
placeholder
WTI giảm xuống gần 101,00$ khi Trump loại trừ các cuộc tấn công ngay lập tức vào IranGiá dầu West Texas Intermediate (WTI) giảm sau khi ghi nhận mức tăng hơn 4% trong phiên giao dịch trước đó, dao động quanh mức 101,10$ trong phiên giao dịch châu Á vào thứ Hai.
Tác giả  FXStreet
5 giờ trước
Giá dầu West Texas Intermediate (WTI) giảm sau khi ghi nhận mức tăng hơn 4% trong phiên giao dịch trước đó, dao động quanh mức 101,10$ trong phiên giao dịch châu Á vào thứ Hai.
sản phẩm liên quan
goTop
quote