


Crypto Today: Bitcoin, Ethereum and XRP stall ahead of key CLARITY Act vote
- Bitcoin falls and trades between $76,000 support and $78,000 resistance as US Senate prepares for critical CLARITY Act vote.
- Ethereum faces headwinds, sliding below $2,500 as momentum indicators signal persistent technical weakness.
- XRP gives back Monday's gains, edging closer to the 200-day EMA support.
Cryptocurrency prices are under pressure on Tuesday, with Bitcoin (BTC) retreating below $77,000. This pullback comes on the heels of last week's failed breakout and is echoed across major altcoins, as Ethereum (ETH) and Ripple (XRP) both slip below key psychological levels at $2,500 and $1.40, respectively.
Volatility remains elevated as market participants brace for a potential Federal Reserve (Fed) rate hike decision on Wednesday. Meanwhile, Tuesday's upcoming United States (US) Senate vote on the CLARITY Act adds another layer of uncertainty, further impacting price action.
Crypto market make-or-break moment as Senate votes on CLARITY Act
The US Senate is expected to vote on the CLARITY Act later on Tuesday after US President Donald Trump agreed to new ethics guidelines released by Republican lawmakers in a revised 630-page draft that includes Democratic provisions in a bid to reach the required 60 votes needed to pass the bill.
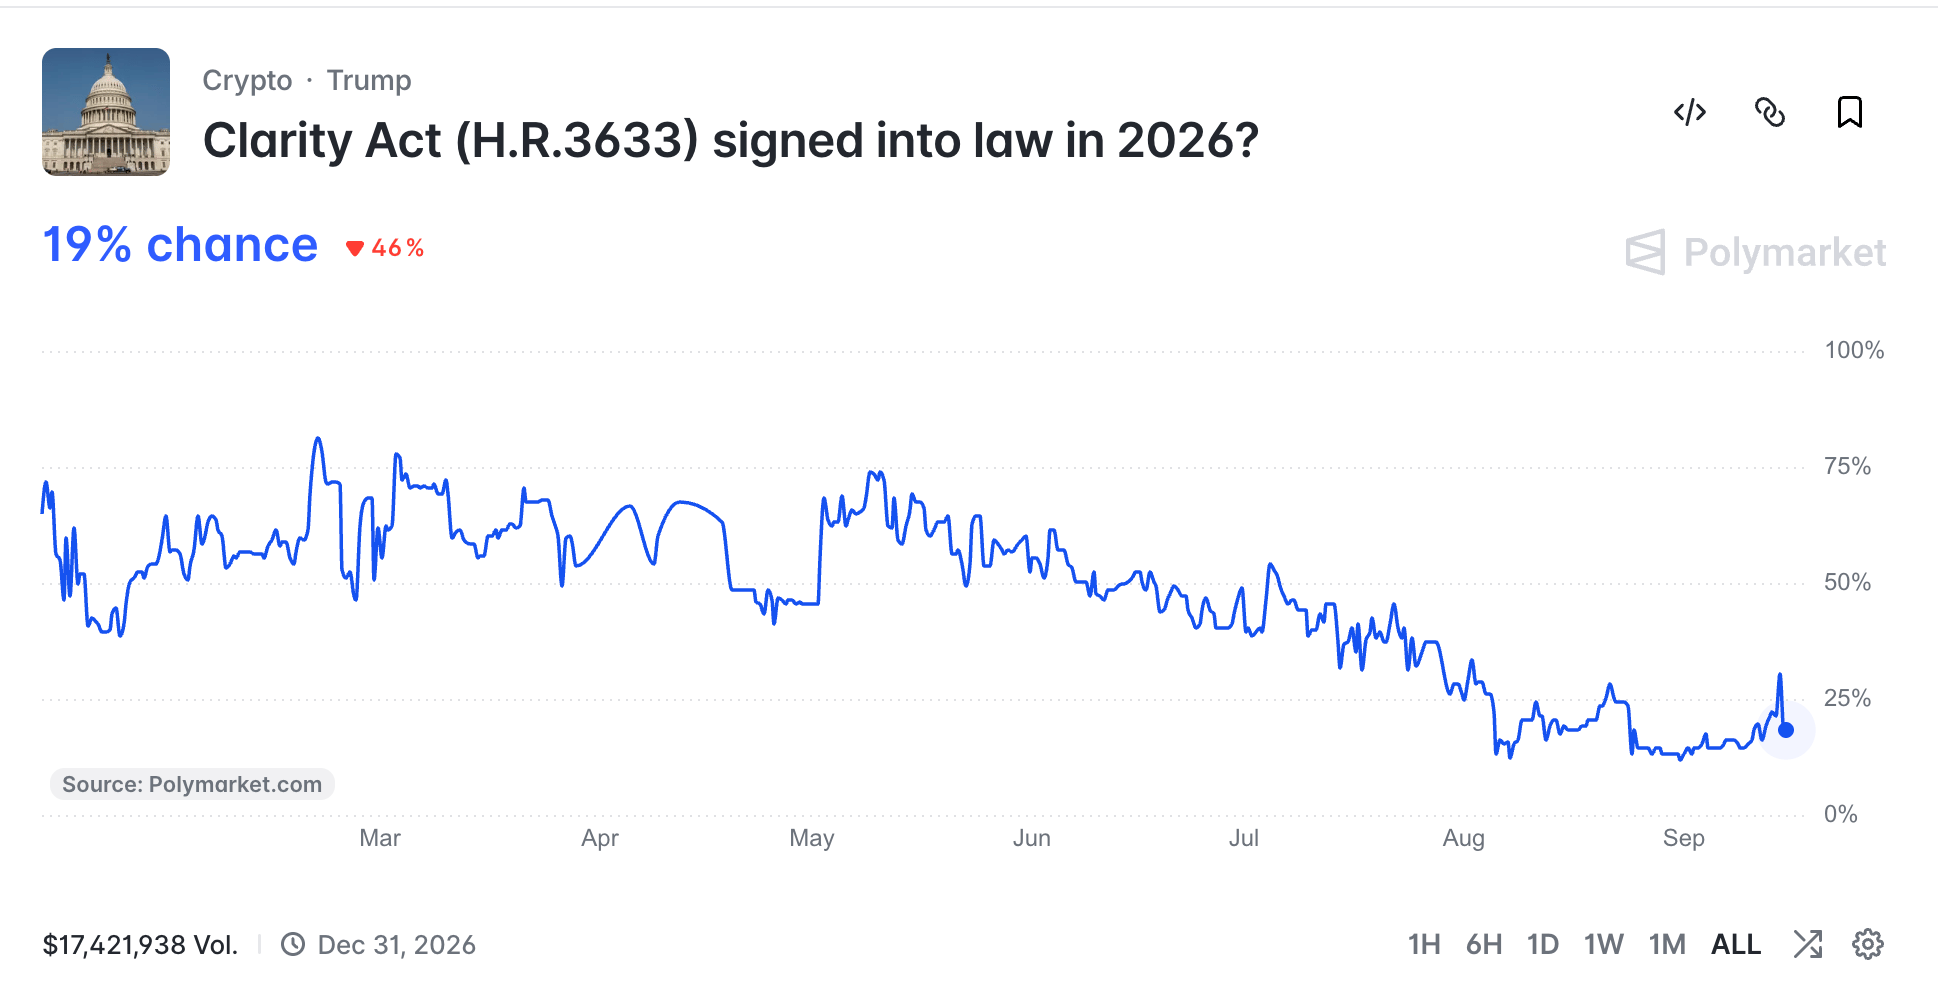
Despite Trump agreeing to new rules, traders are pricing a low probability of the bill passing. Polymarket shows a 19% chance that the CLARITY Act will be signed into law in 2026. Still, a surprise passage has not been priced in, which could boost the crypto market’s outlook with Bitcoin likely to gather the momentum for a sustained breakout above $80,000.
“Republicans have since released an updated consolidated text addressing several of the earlier sticking points and now the president is publicly pushing for passage,” Artemis stated in a recent report, adding, “he told the executives at the White House that the bill would "keep us ahead of China," and SEC Chair Paul Atkins has backed it as well.”
The CLARITY Act is a market structure bill that outlines the roles of the Commodity Futures Trading Commission (CFTC) and the Securities and Exchange Commission (SEC) in regulating the crypto industry. It answers pertinent questions that have long weighed on the industry, including how to categorize crypto assets as either securities or commodities.
“It formally brings these intermediaries inside the Bank Secrecy Act framework so know your customer and anti-money laundering rules apply the same way they do in traditional finance,” Artemis added.
Technical analysis: Bitcoin loses strength as support holds
Bitcoin trades just below $77,000 as technical weakness persists after a failed breakout above $80,000. Despite the Crypto King losing ground, the outlook remains relatively constructive above the main Exponential Moving Averages (EMAs), suggesting the broader uptrend remains intact despite recent consolidation.
Momentum, however, is mixed, with the Relative Strength Index (RSI) having cooled to a neutral 52 while the Moving Average Convergence Divergence (MACD) remains in negative territory, hinting that upside traction is slowing even as price stays structurally supported.
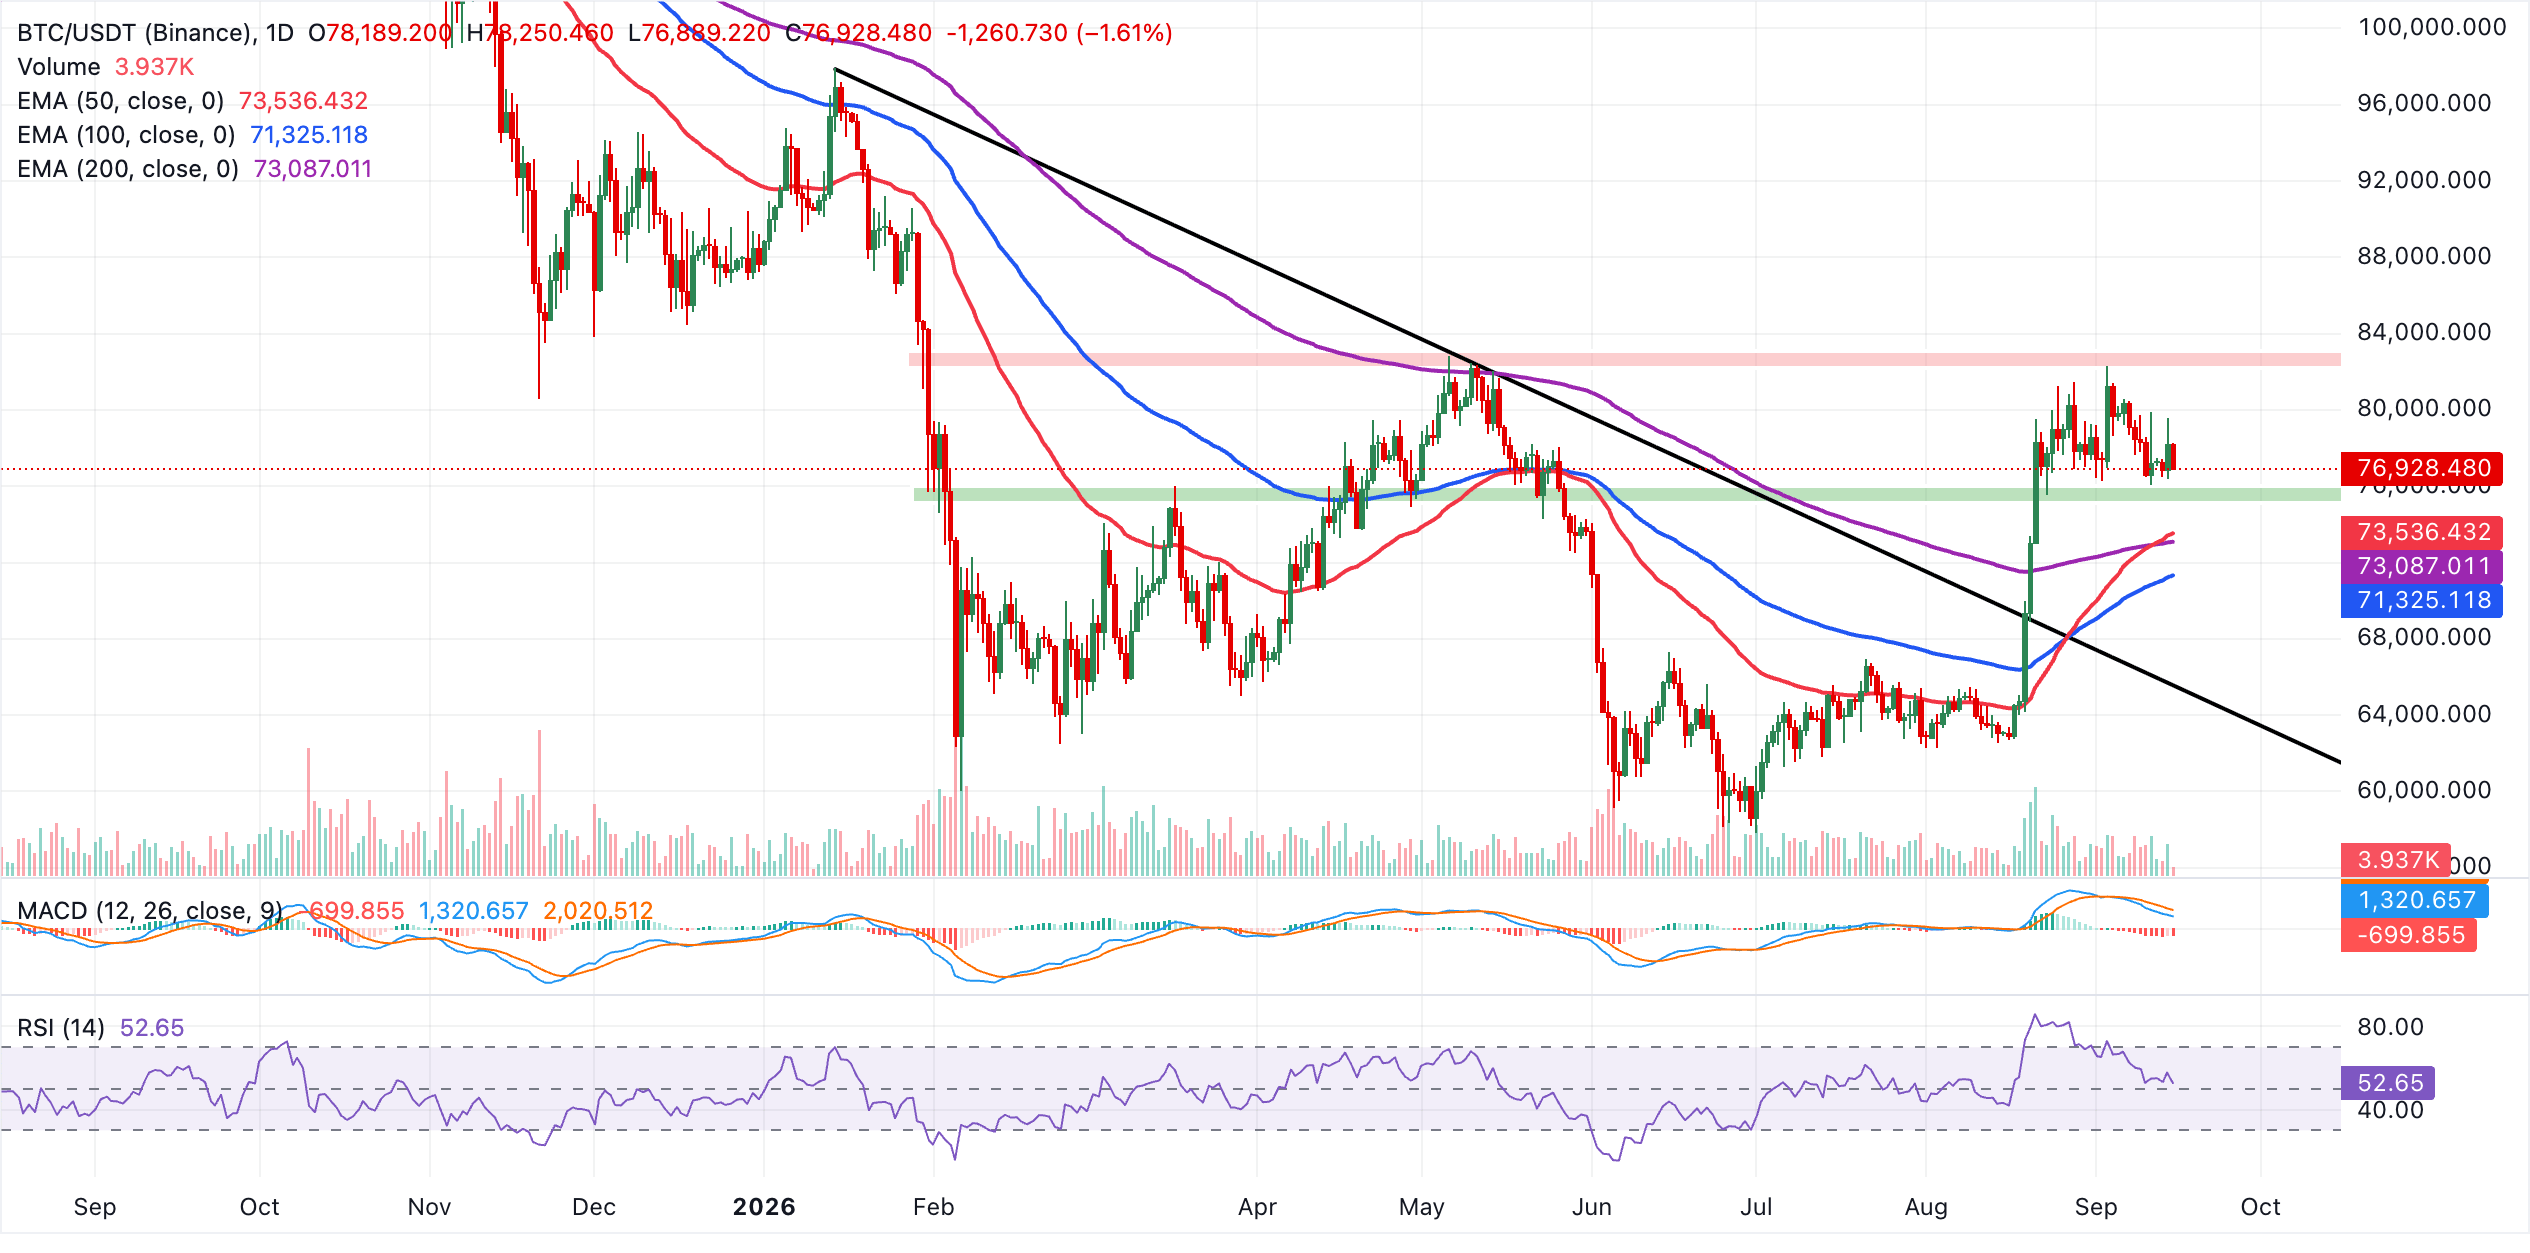
On the downside, immediate support emerges at the 50-day EMA near $73,536, reinforced by the 200-day EMA at $73,087 as a secondary cushion. A deeper pullback would bring the 100-day EMA at $71,325 into focus, while the prior downtrend resistance, now turned support around the trendline break at $65,520, marks a more distant floor if corrective pressure intensifies. With no nearby overhead levels flagged by the current setup, bulls retain the structural advantage as long as BTC holds above the clustered EMA support band.
Altcoins technical outlook: Ethereum and XRP bears return
Ethereum slides and trades below $2,500 despite maintaining a bullish near-term bias, as price holds well above the 50-day, 100-day, and 200-day EMAs. The stacked configuration of these EMAs below spot reinforces an underlying uptrend, even as the MACD remains negative, hinting that the latest advance is losing some momentum.
The RSI around 57 stays in positive territory without being overbought, suggesting buyers still retain control but with less aggressive follow-through than in early February.
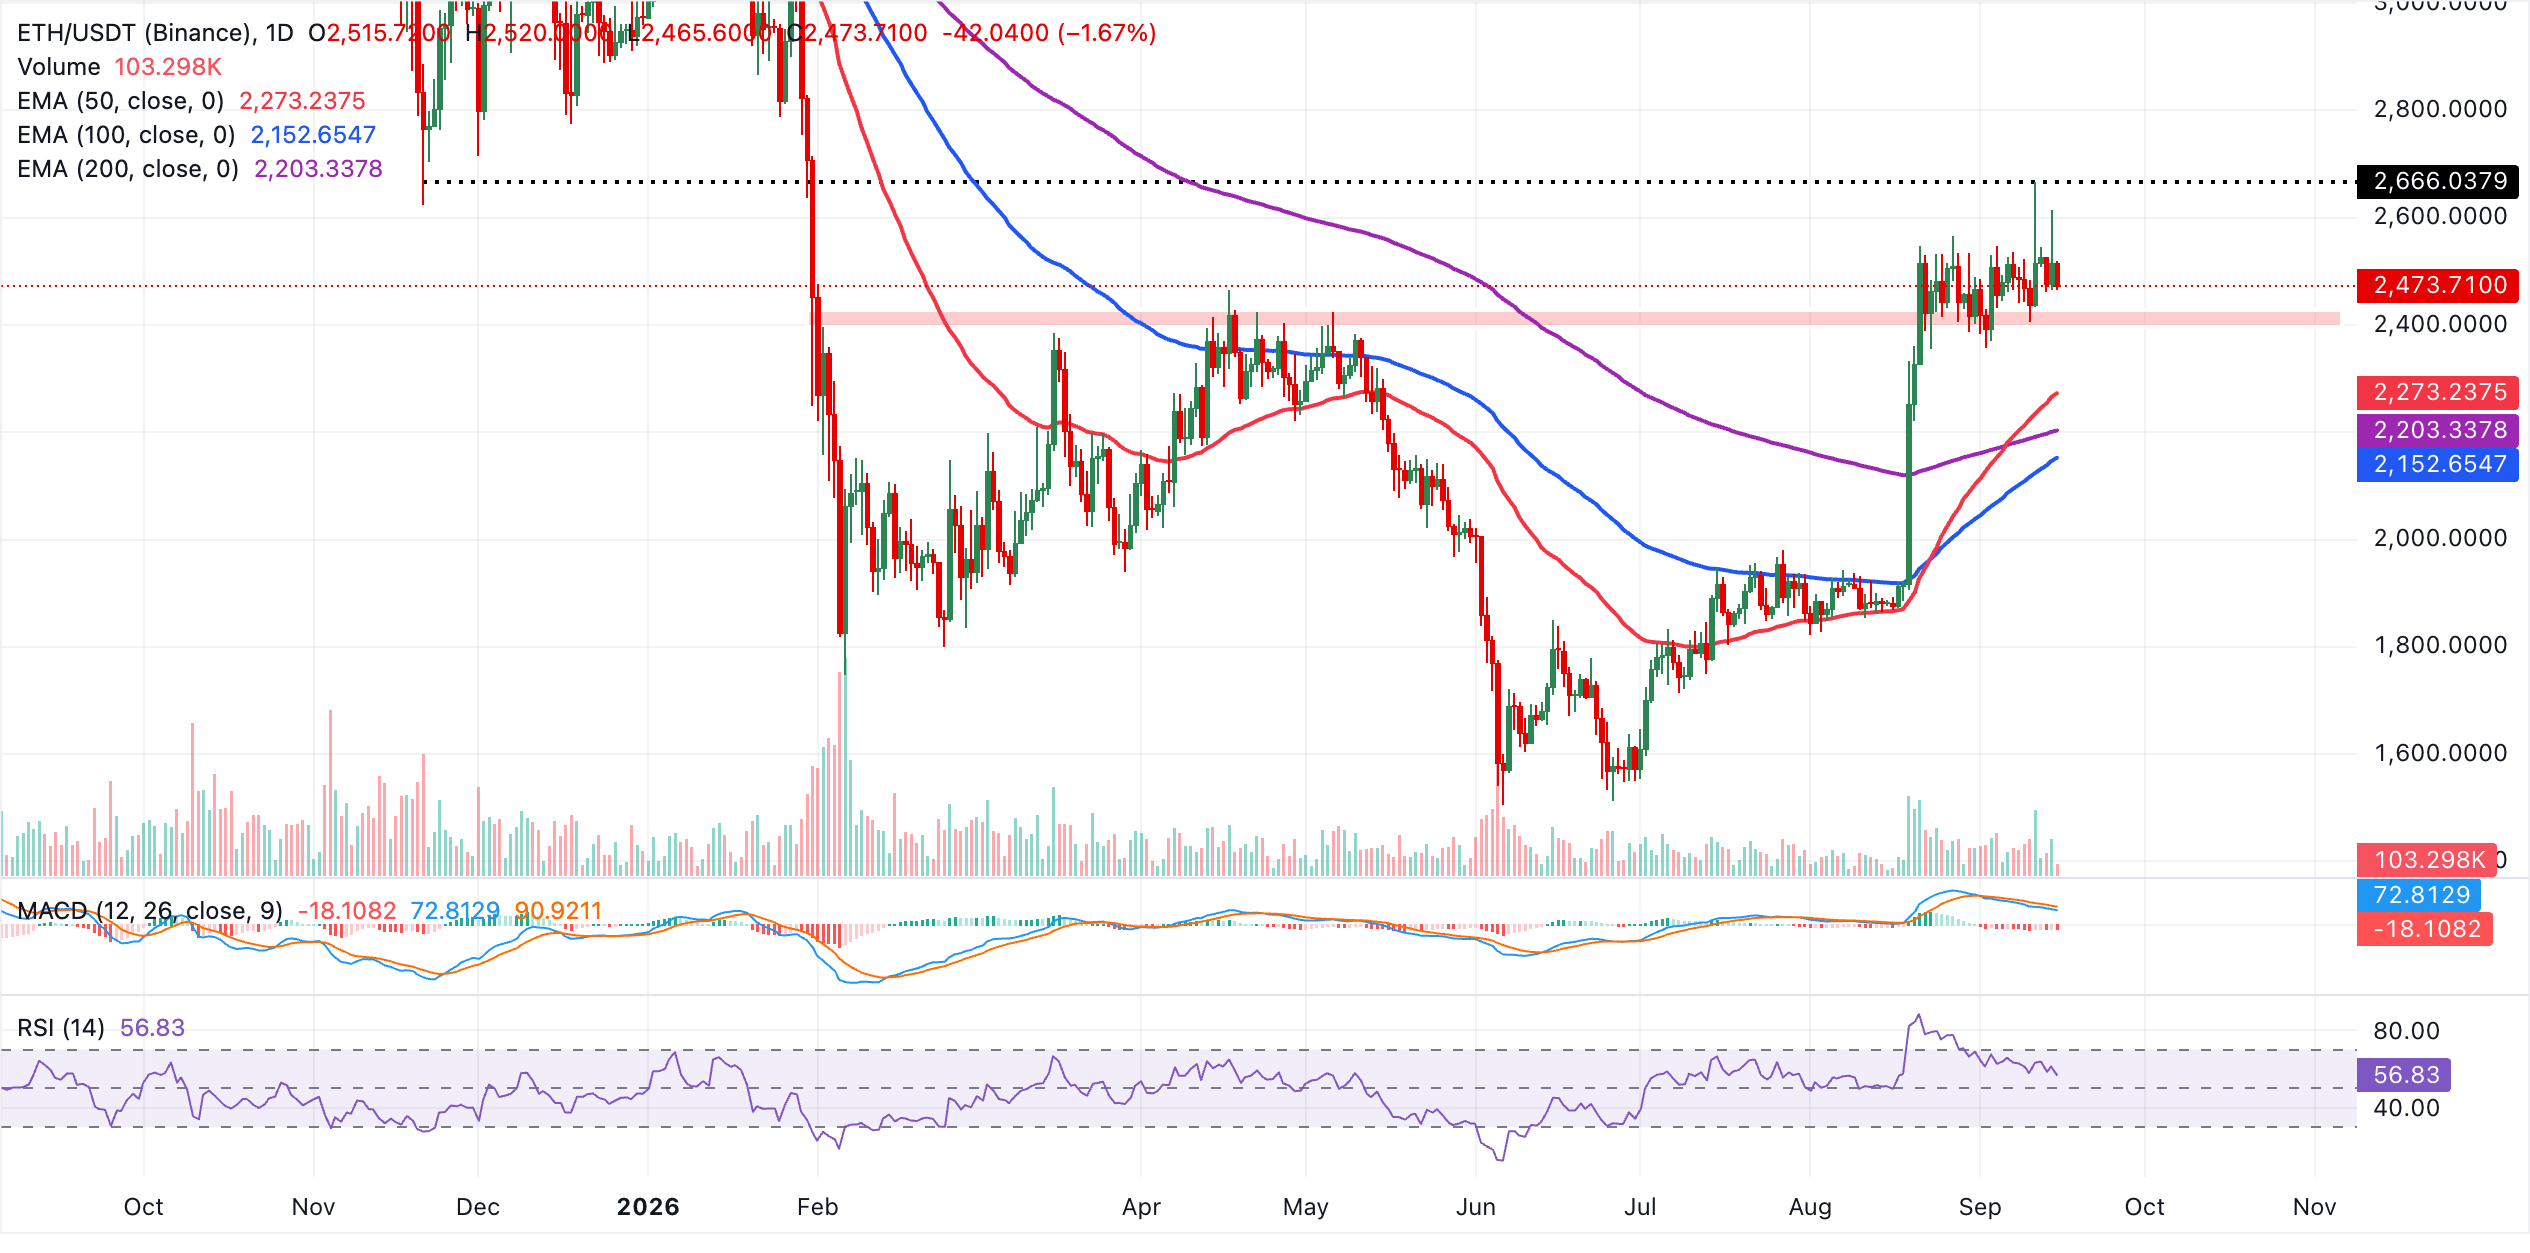
On the downside, immediate support is at the 50-day EMA near $2,273, with deeper cushions at the 200-day EMA around $2,203 and the 100-day EMA at 2,153. A daily close below the 50-day EMA would weaken the current constructive structure and open the door to a broader corrective phase toward the longer-term averages, while holding above these layers keeps the broader bullish trend intact and leaves the path open for a retest of recent highs once momentum stabilizes.
As for XRP, the spot price faces growing headwinds following Monday's brief recovery near $1.50. Despite the ongoing correction, the remittance token holds a constructive near-term bias as it sits above the 50-day, 100-day and 200-day EMAs, reinforcing a broader supportive structure.
Meanwhile, the RSI at 55 stays just above neutral, hinting at modest bullish pressure, although the MACD line remains below zero and its signal line, suggesting upside momentum is not yet strong and rallies could remain measured.
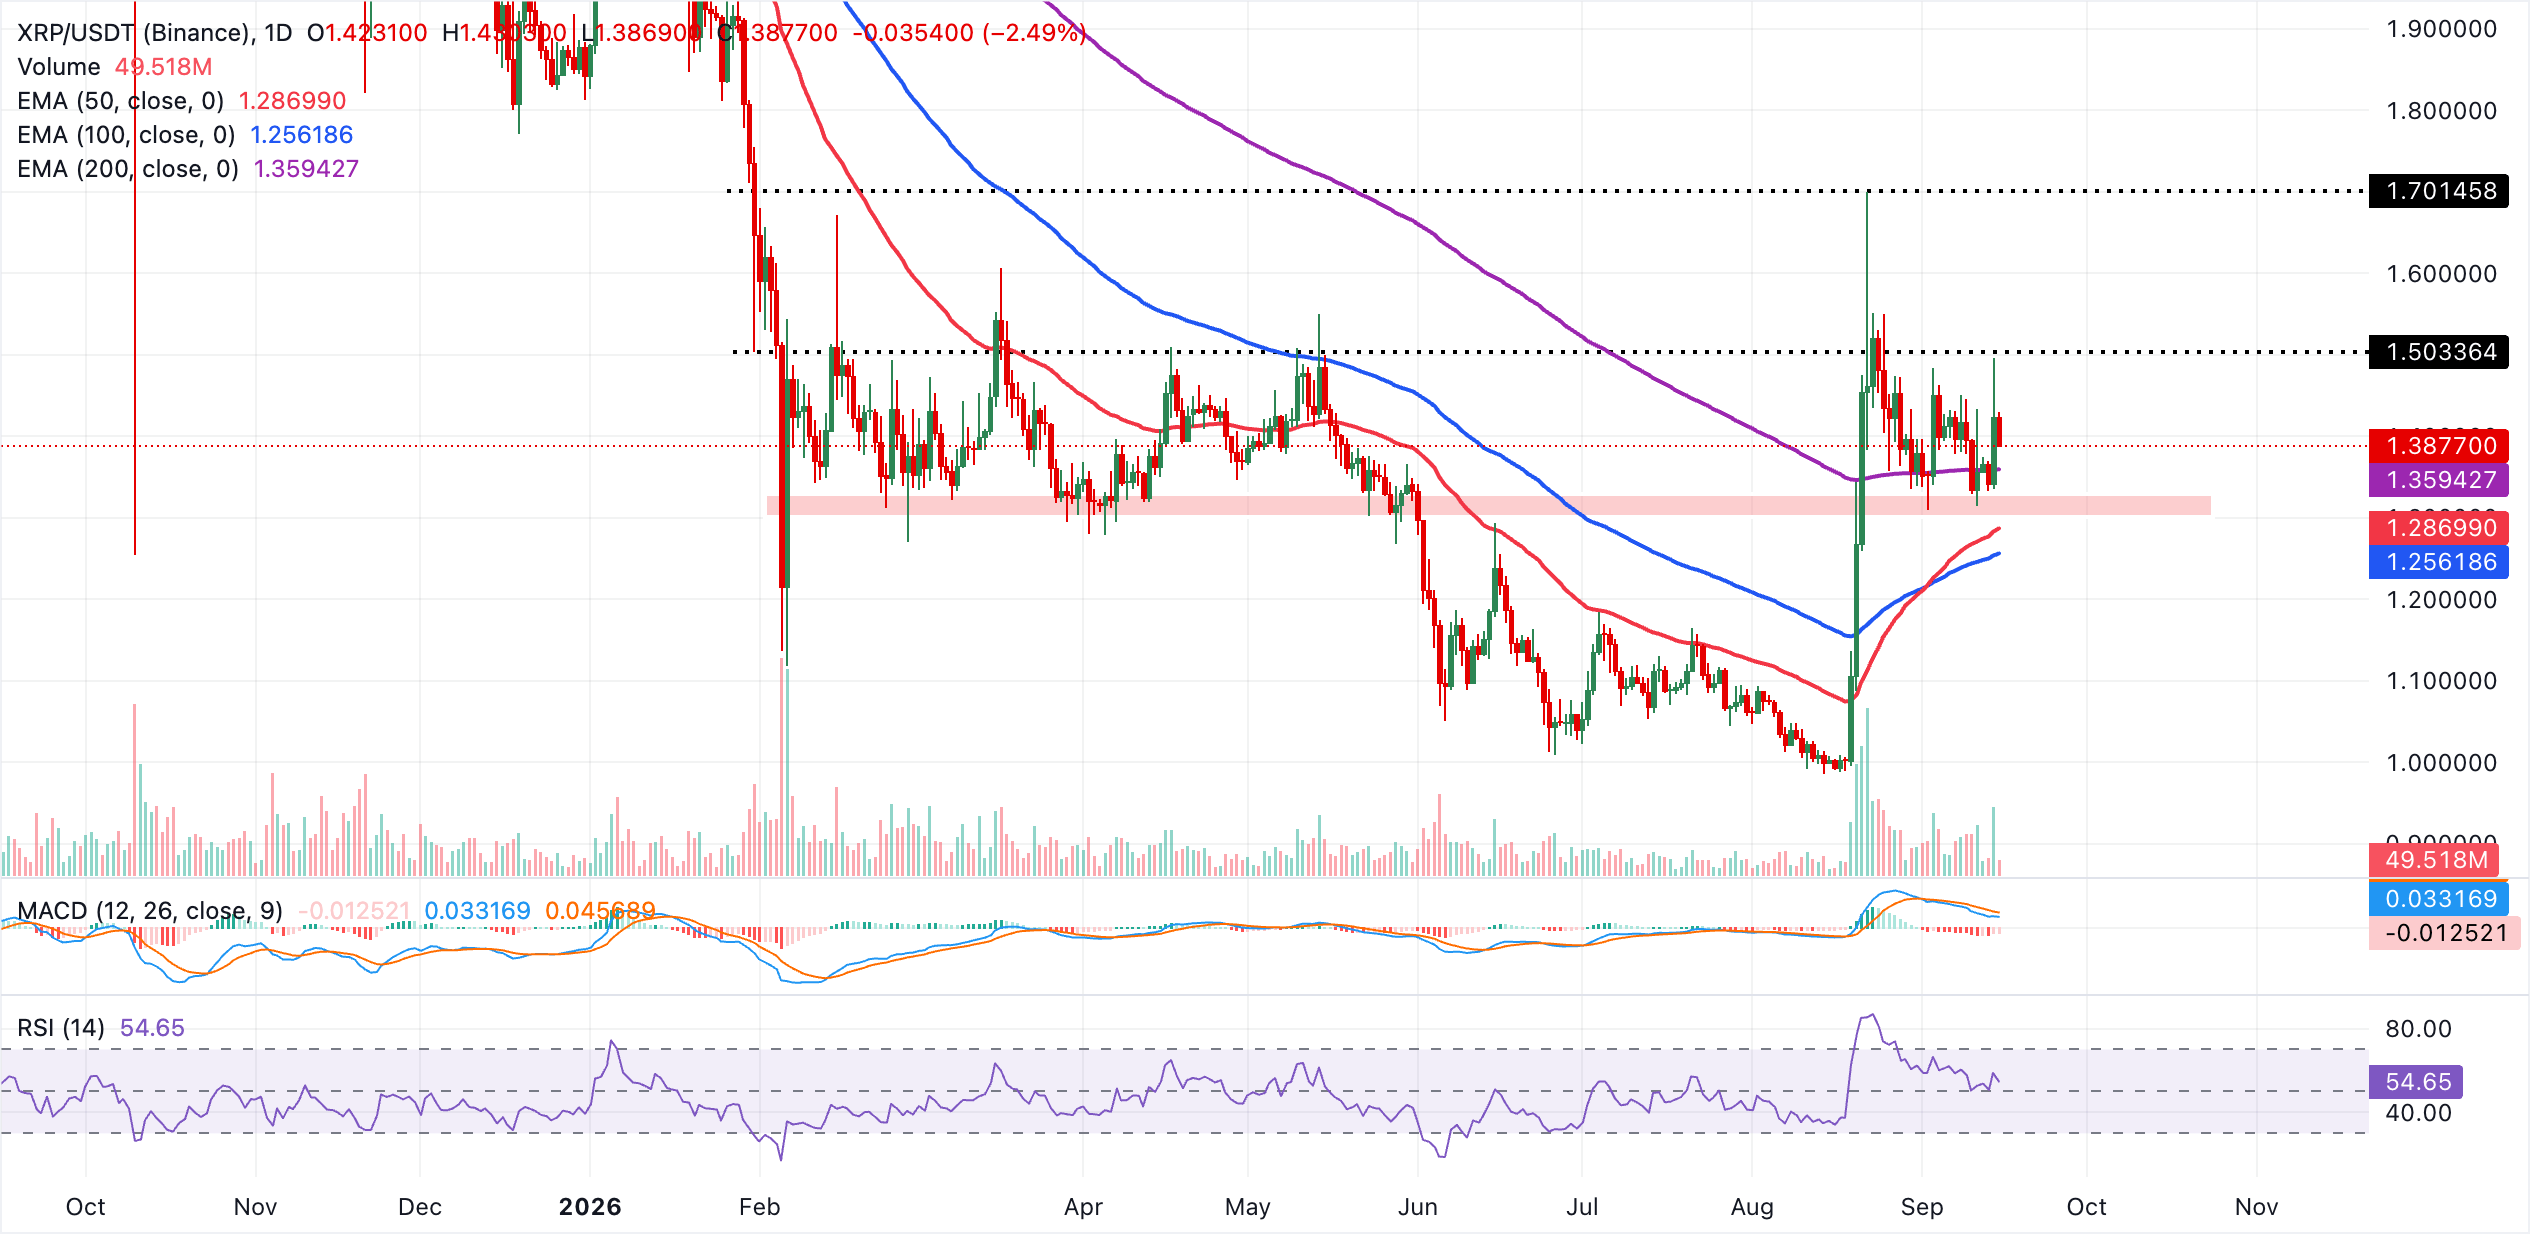
Immediate support lies at the 200-day EMA near $1.36, where a pullback could first attempt to stabilize, before the 50-day EMA at $1.29 and the 100-day EMA at $1.26 step in as deeper cushions if selling extends. With no clear indicator-based resistance levels on the daily chart, the focus remains on how price behaves around these EMAs. Holding above $1.36 would keep the bullish bias intact, while a sustained break back below the shorter EMAs would hint that the recent advance is losing traction.
(The technical analysis of this story was written with the help of an AI tool. Know more.)
Bitcoin, altcoins, stablecoins FAQs
Bitcoin is the largest cryptocurrency by market capitalization, a virtual currency designed to serve as money. This form of payment cannot be controlled by any one person, group, or entity, which eliminates the need for third-party participation during financial transactions.
Altcoins are any cryptocurrency apart from Bitcoin, but some also regard Ethereum as a non-altcoin because it is from these two cryptocurrencies that forking happens. If this is true, then Litecoin is the first altcoin, forked from the Bitcoin protocol and, therefore, an “improved” version of it.
Stablecoins are cryptocurrencies designed to have a stable price, with their value backed by a reserve of the asset it represents. To achieve this, the value of any one stablecoin is pegged to a commodity or financial instrument, such as the US Dollar (USD), with its supply regulated by an algorithm or demand. The main goal of stablecoins is to provide an on/off-ramp for investors willing to trade and invest in cryptocurrencies. Stablecoins also allow investors to store value since cryptocurrencies, in general, are subject to volatility.
Bitcoin dominance is the ratio of Bitcoin's market capitalization to the total market capitalization of all cryptocurrencies combined. It provides a clear picture of Bitcoin’s interest among investors. A high BTC dominance typically happens before and during a bull run, in which investors resort to investing in relatively stable and high market capitalization cryptocurrency like Bitcoin. A drop in BTC dominance usually means that investors are moving their capital and/or profits to altcoins in a quest for higher returns, which usually triggers an explosion of altcoin rallies.
Bài viết đề xuất


