


Bitcoin Price Forecast: BTC remains range-bound as liquidation risks build
- Bitcoin faces mild pressure, trading below $77,000 on Tuesday after a 1.75% recovery the previous day.
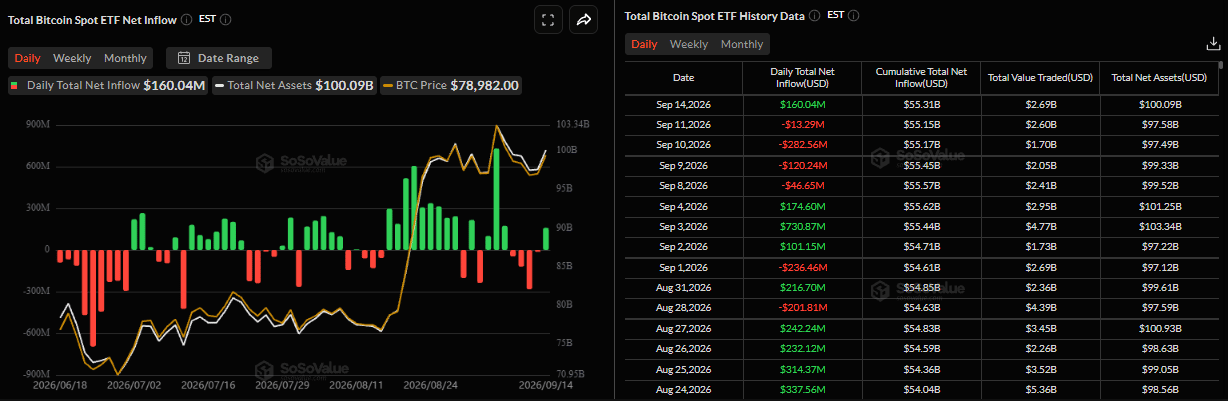
- US-listed spot ETFs recorded an inflow of $160.04 million on Monday, snapping a four-day outflow streak.
- Bitfinex report highlights $82,000 and $76,000 as key liquidation zones, warning that a break above or below could trigger massive wipeouts.
Bitcoin (BTC) faces mild pressure, trading below $77,000 at the time of writing on Tuesday following a recovery the previous day. Institutional demand shows early signs of return with spot Exchange Traded Funds (ETFs) recording an inflow on Monday, snapping a four-day outflow streak. Meanwhile, the latest Bitfinex Alpha report notes that Crypto King price action remains range-bound, and liquidation risks are building in the near term.
Institutional demand shows early signs of return
Institutional demand started the week on a positive note. SoSoValue data shows that spot ETFs recorded an inflow of $160.04 million on Monday, breaking the four-day streak of outflow since last week. If these inflows continue through the week, BTC could extend its recovery.
Bitfinex sees liquidation risks building around BTC
Bitfinex’s Alpha market report published on Monday highlighted that BTC’s recent consolidation reflects limited selling pressure but insufficient demand to sustain a breakout. BTC has remained within a 5.5% range for more than 24 trading sessions, while leverage has continued to build around both ends of the range.
“Meanwhile, higher energy costs, rising real yields and weakening consumer confidence are creating a more difficult macroeconomic backdrop ahead of the Federal Reserve (Fed) Wednesday’s decision on rates,” added the analyst.
According to Bitfinex’s Alpha market report, key liquidation zones sit around $82,000 on the upside and $75,000–$76,000 on the downside. A sustained breakout above $82,000 could trigger the main pool of short liquidations, while a move below $76,000 could set off cascading long liquidations. Liquidation clusters are common when price stays trapped in a narrow range for an extended period.
The analyst further explained that the difference between the two liquidation bands is that the higher band has a limited number of positions and is concentrated at a certain strike price of $82,000. The lower band has evenly distributed strikes, collectively amounting to a large number of potential long liquidations.
“Given this week’s impending rate decision, it would not be surprising to see both zones tested, with the nature of any move governed by the different liquidation structures sitting just beyond the current range extremes,” concluded the analyst.
Bitcoin technical outlook: Consolidates near recent highs
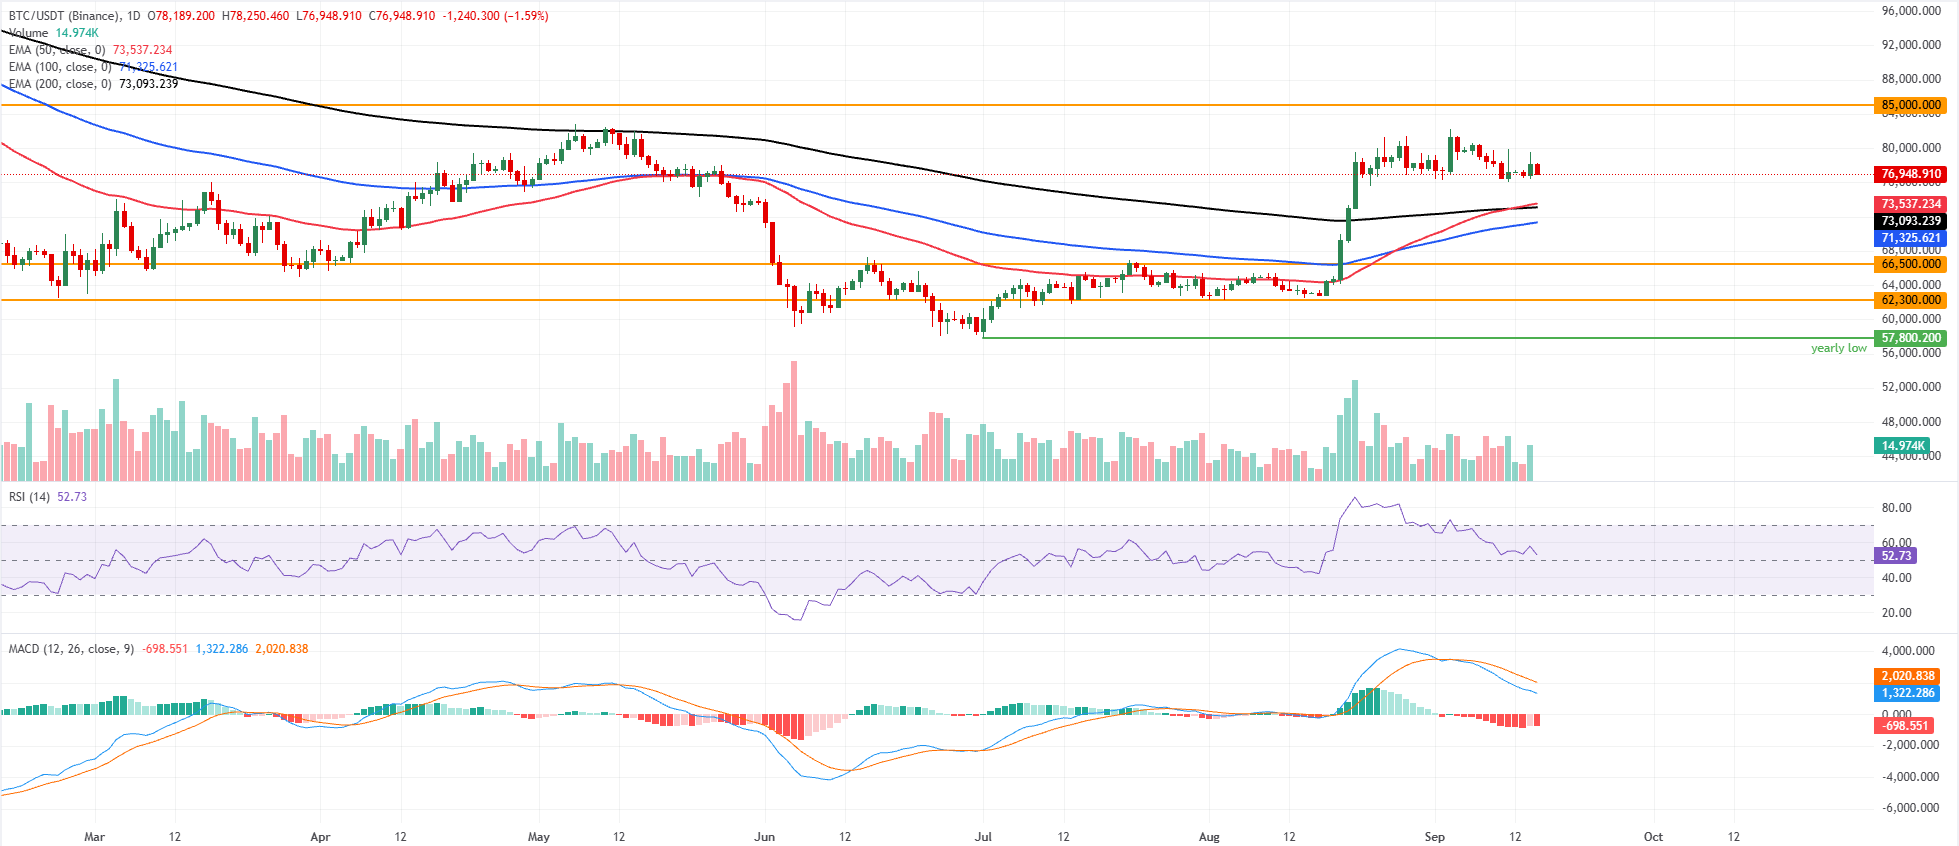
Bitcoin price trades at $76,948 on Tuesday after a mild recovery the previous day. The Crypto King holds a constructive bullish bias as it stays well above its key Exponential Moving Averages (EMAs). The 50-day EMA at $73,537, together with the 200-day EMA at $73,093 and the 100-day EMA at $71,325, forms a layered demand zone beneath spot and suggests the broader uptrend remains intact despite the recent consolidation off the highs.
The Relative Strength Index (RSI) has eased back toward a neutral 52, hinting at cooling momentum. At the same time, the Moving Average Convergence Divergence (MACD) remains in negative territory, reinforcing that upside follow-through may be slower even as price action remains supported above the medium- and long-term moving averages.
On the downside, immediate support is implied by the current consolidation band just above the 50-day EMA at $73,537, with additional support at the 200-day EMA at $73,093 and the 100-day EMA at $71,325, where buyers would be expected to re-emerge on deeper pullbacks. Below those dynamic levels, horizontal cushions appear at $66,500 and then $62,300, marking more significant structural floors.
On the topside, the next notable resistance sits at the horizontal level around $85,000, and a decisive daily close above this barrier would be needed to reassert the broader bullish trend and open the door to fresh highs.
(The technical analysis of this story was written with the help of an AI tool. Know more.)
Bitcoin, altcoins, stablecoins FAQs
Bitcoin is the largest cryptocurrency by market capitalization, a virtual currency designed to serve as money. This form of payment cannot be controlled by any one person, group, or entity, which eliminates the need for third-party participation during financial transactions.
Altcoins are any cryptocurrency apart from Bitcoin, but some also regard Ethereum as a non-altcoin because it is from these two cryptocurrencies that forking happens. If this is true, then Litecoin is the first altcoin, forked from the Bitcoin protocol and, therefore, an “improved” version of it.
Stablecoins are cryptocurrencies designed to have a stable price, with their value backed by a reserve of the asset it represents. To achieve this, the value of any one stablecoin is pegged to a commodity or financial instrument, such as the US Dollar (USD), with its supply regulated by an algorithm or demand. The main goal of stablecoins is to provide an on/off-ramp for investors willing to trade and invest in cryptocurrencies. Stablecoins also allow investors to store value since cryptocurrencies, in general, are subject to volatility.
Bitcoin dominance is the ratio of Bitcoin's market capitalization to the total market capitalization of all cryptocurrencies combined. It provides a clear picture of Bitcoin’s interest among investors. A high BTC dominance typically happens before and during a bull run, in which investors resort to investing in relatively stable and high market capitalization cryptocurrency like Bitcoin. A drop in BTC dominance usually means that investors are moving their capital and/or profits to altcoins in a quest for higher returns, which usually triggers an explosion of altcoin rallies.
Bài viết đề xuất


