


Bitcoin Price Forecast: Strong ETF demand supports BTC as elevated Fed hike bets cap upside
- Bitcoin price consolidates near recent highs around $79,500 on Monday, after gaining over 3.4% last week.
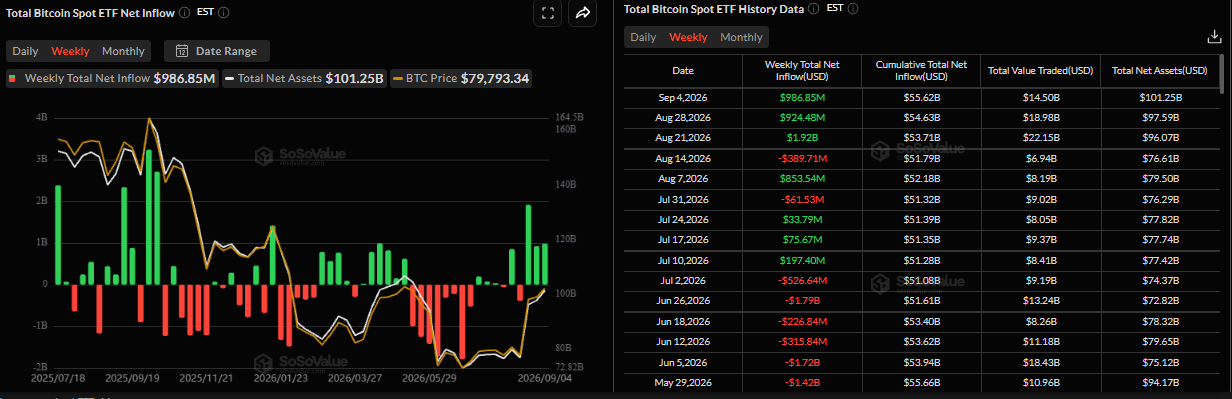
- US-listed spot ETFs record a net inflow of $986.85 million last week, marking the third week of heavy inflows.
- Rising tensions between the US and Iran, along with a resilient US labor market, keep Fed tightening expectations elevated, potentially weighing on BTC.
Bitcoin (BTC) trades near $79,500 at the time of writing on Monday, consolidating near the recent highs after gaining more than 3.4% last week. Strong institutional demand continues to support BTC, with US-listed spot Bitcoin Exchange Traded Funds (ETFs) recording nearly $1 billion in net inflows for the third straight week. However, rising geopolitical tensions between the US and Iran, coupled with a resilient US labor market, keep Federal Reserve (Fed) tightening expectations elevated and could weigh on BTC.
Billions of dollars in inflows
Institutional demand for Bitcoin remained strong last week. SoSoValue data showed spot ETFs recorded a net weekly inflow of $986.85 million last week, marking the third week of heavy inflows. If these inflows continue and intensify, BTC could support gains ahead.
Higher Oil prices and strong US jobs data cap BTC
Market sentiment remains cautious amid rising tensions between the US and Iran over confrontation in the Strait of Hormuz. In the latest developments, the US forces struck three Iranian oil tankers on Saturday, while Iran's Islamic Revolutionary Guard Corps said it had targeted six vessels in retaliation. The tit-for-tat attacks have heightened concerns about the security of shipping through the strategic waterway and intensified fears of a prolonged disruption to supplies from the Middle East, supporting Oil prices and fueling inflation fears.
Adding to the inflation concerns, the latest US Nonfarm Payrolls (NFP) report released on Friday showed that the labor market remains resilient. The US economy added 162K new jobs in August, far above consensus estimates of 56K. Other details showed the Unemployment Rate remained unchanged at 4.1%, as expected, while annual wage inflation, as measured by the change in average hourly earnings, fell to 3.1% from 3.2%.
Rising energy prices and a stronger-than-expected labor market add to inflationary risks and keep Fed tightening expectations elevated, potentially weighing on risky assets such as Bitcoin.
Bitcoin technical outlook: Hovers around recent highs
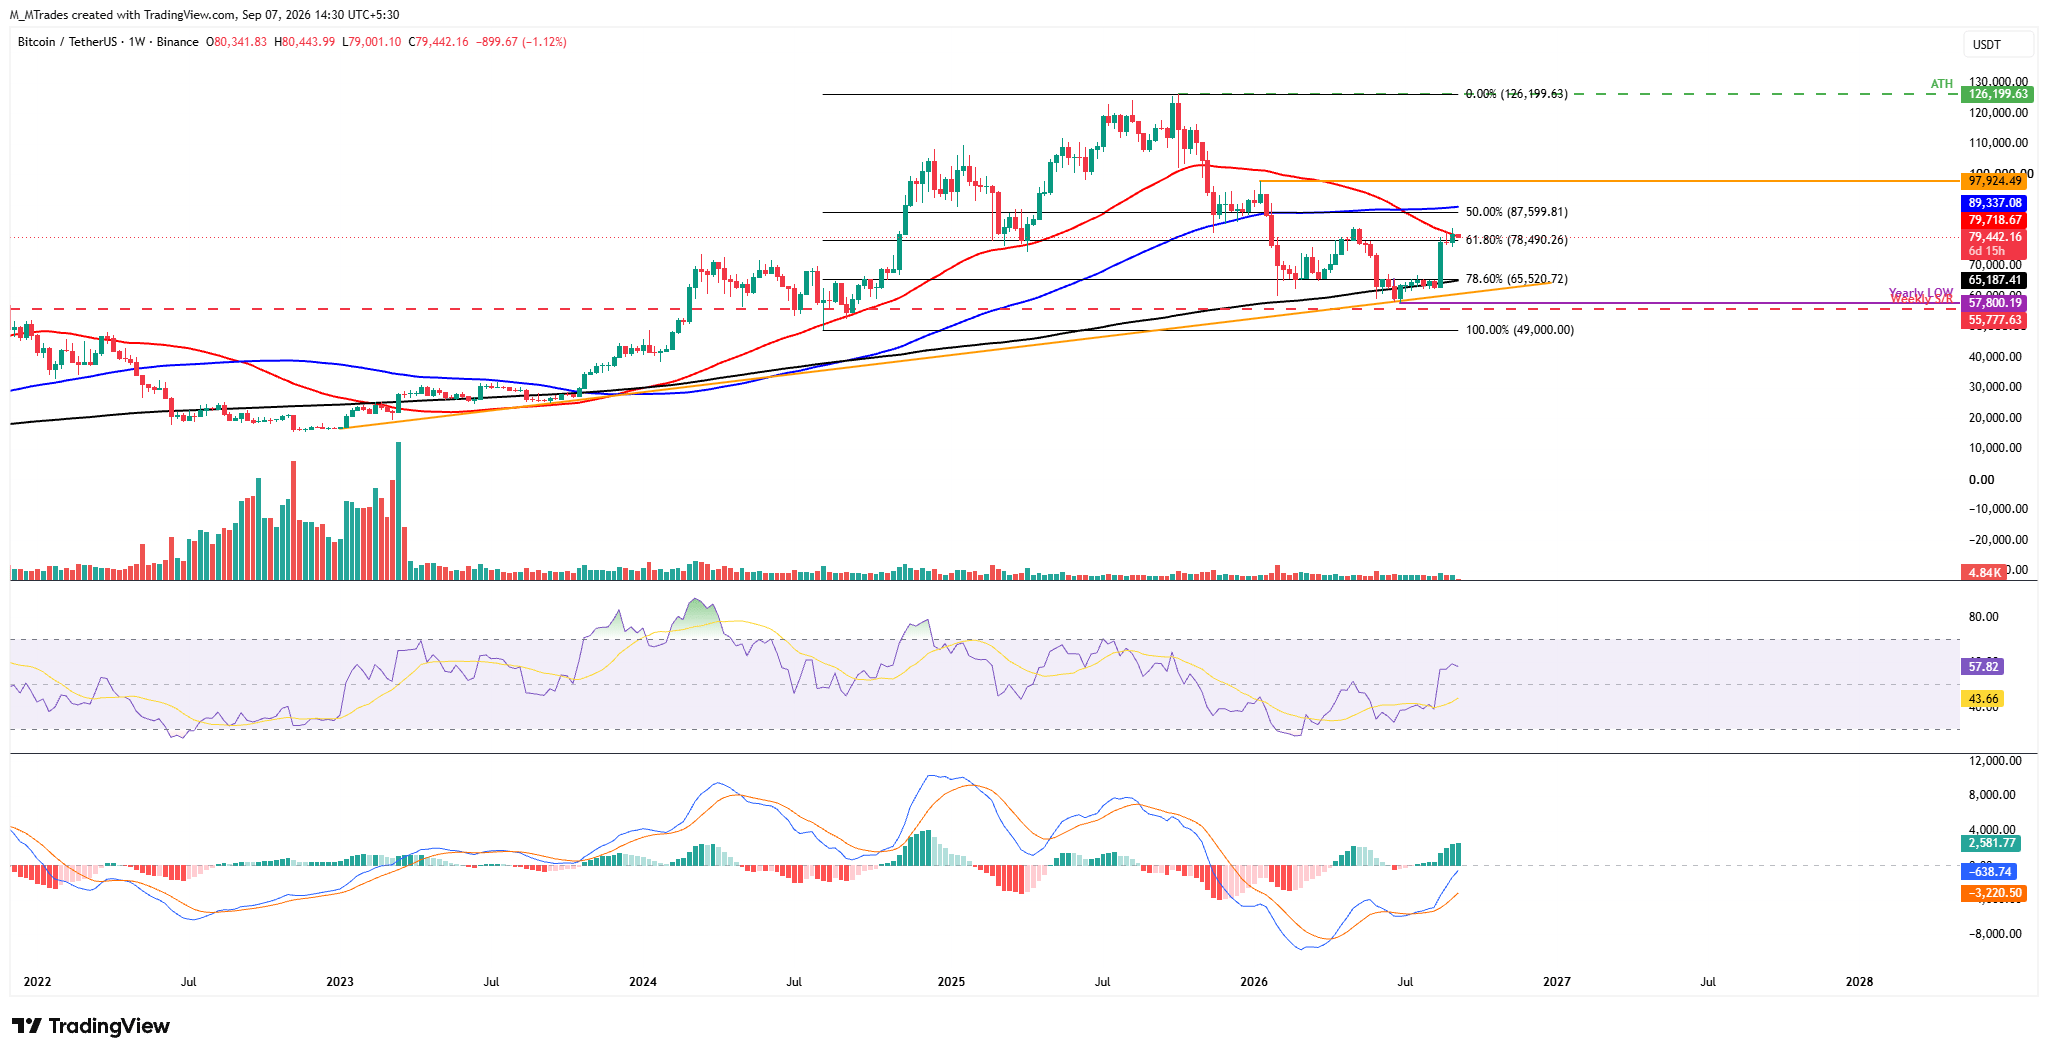
The Crypto King is trading slightly below $79,500 at the time of writing on Monday after gaining 3.42% last week and closing above the 50-week Simple Moving Average (SMA) for the first time since early November 2025 at $79,718.
If BTC finds support around the 50-week SMA at $79,718 on a weekly basis, it could extend the rally toward the 50% retracement level at $87,599 (drawn from the August 2024 low of $49,000 to the October 2025 record high of $126,199), followed by the 100-week SMA at $89,175.
Momentum remains strong and shows signs of optimism. On the weekly chart, the Relative Strength Index (RSI) stays firmly above the neutral level of 50, reading 57 on Monday, indicating improving momentum. In addition, the Moving Average Convergence Divergence (MACD) flipped to a bullish crossover in mid-July and remains intact, with rising green histogram bars, supporting a positive outlook.
On the other hand, if BTC corrects and the 50-day SMA at $79,718 fails to hold, the Crypto King could extend the decline toward the key psychological level of $70,000.
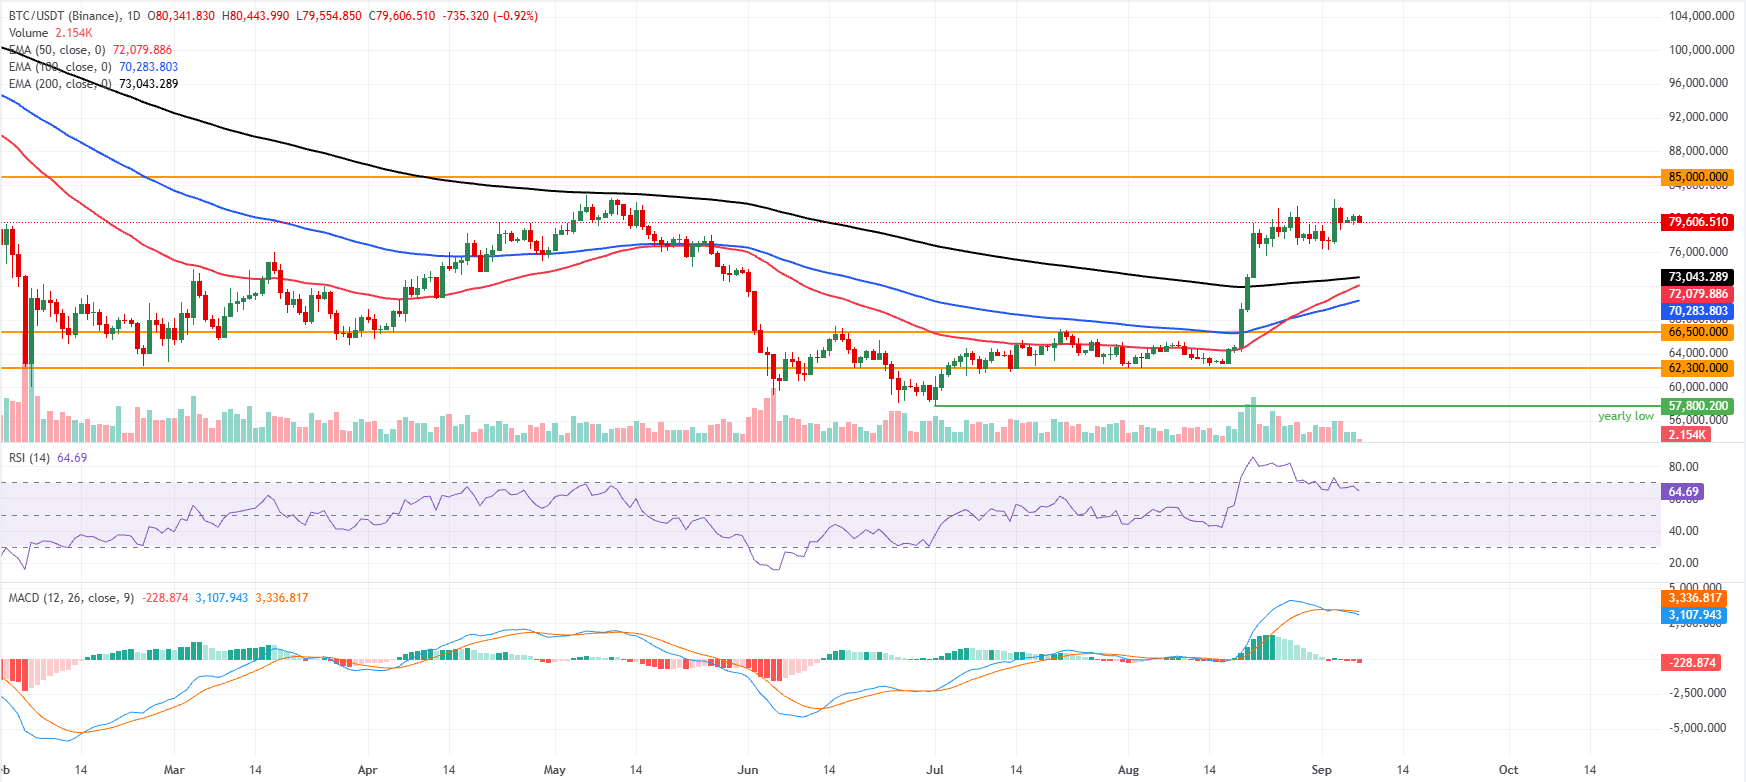
On the daily chart, BTC holds a bullish bias as it sits well above the 50-day, 100-day, and 200-day Exponential Moving Averages (EMAs), clustered between roughly $70,300 and $73,000. The elevated positioning over these dynamic supports suggests the broader uptrend remains intact, even as the daily RSI eases from prior extremes toward the mid-60s and the MACD stays in negative territory, hinting at lingering corrective pressure within an overall constructive structure.
On the downside, initial support emerges at the 200-day EMA near $73,043, reinforced by the 50-day EMA around $72,080 and the 100-day EMA close to $70,284, before stronger horizontal cushions appear at $66,500 and then $62,300.
On the topside, the next notable obstacle aligns with the horizontal resistance zone around $85,000, where a clear daily close above would likely reopen the path toward fresh highs. In contrast, failure to clear this cap could see the pair rotate back toward the EMA support band.
(The technical analysis of this story was written with the help of an AI tool. Know more.)
Bitcoin, altcoins, stablecoins FAQs
Bitcoin is the largest cryptocurrency by market capitalization, a virtual currency designed to serve as money. This form of payment cannot be controlled by any one person, group, or entity, which eliminates the need for third-party participation during financial transactions.
Altcoins are any cryptocurrency apart from Bitcoin, but some also regard Ethereum as a non-altcoin because it is from these two cryptocurrencies that forking happens. If this is true, then Litecoin is the first altcoin, forked from the Bitcoin protocol and, therefore, an “improved” version of it.
Stablecoins are cryptocurrencies designed to have a stable price, with their value backed by a reserve of the asset it represents. To achieve this, the value of any one stablecoin is pegged to a commodity or financial instrument, such as the US Dollar (USD), with its supply regulated by an algorithm or demand. The main goal of stablecoins is to provide an on/off-ramp for investors willing to trade and invest in cryptocurrencies. Stablecoins also allow investors to store value since cryptocurrencies, in general, are subject to volatility.
Bitcoin dominance is the ratio of Bitcoin's market capitalization to the total market capitalization of all cryptocurrencies combined. It provides a clear picture of Bitcoin’s interest among investors. A high BTC dominance typically happens before and during a bull run, in which investors resort to investing in relatively stable and high market capitalization cryptocurrency like Bitcoin. A drop in BTC dominance usually means that investors are moving their capital and/or profits to altcoins in a quest for higher returns, which usually triggers an explosion of altcoin rallies.
Bài viết đề xuất


