


Crypto Today: Bitcoin, Ethereum, XRP bulls accelerate rally amid rising ETF inflows
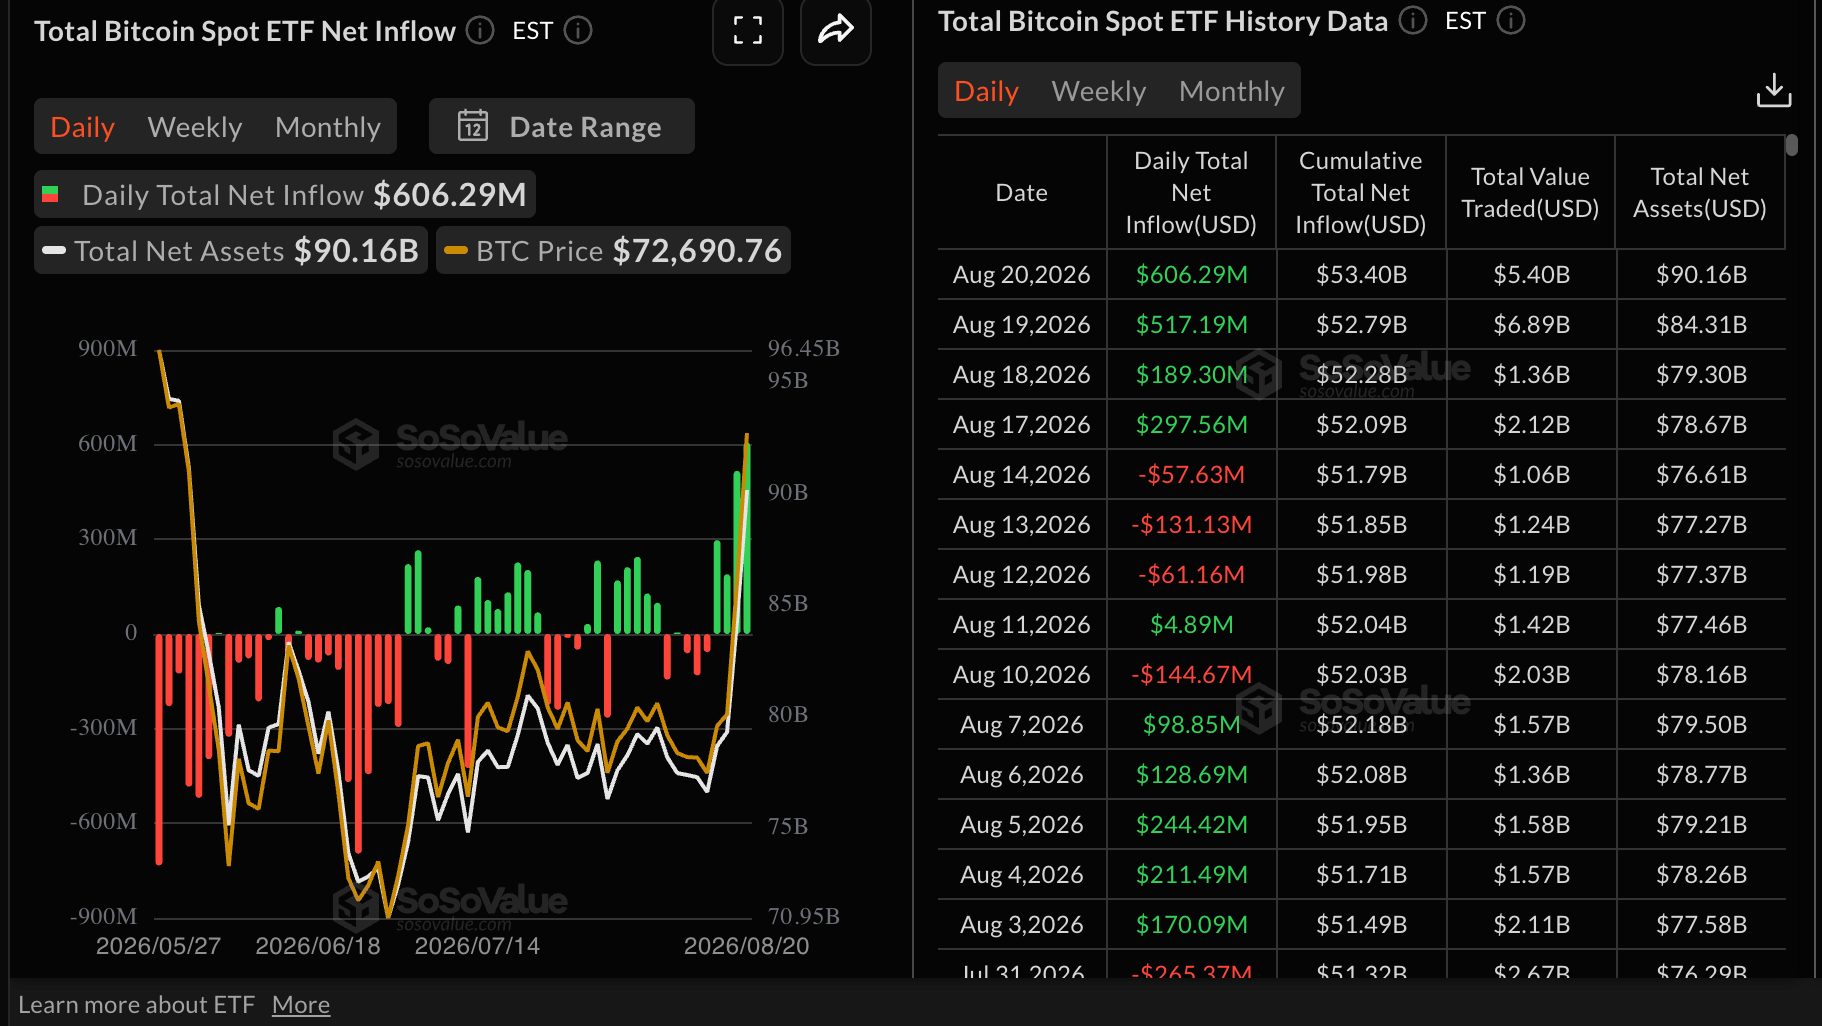
- Bitcoin extends its bullish momentum for the fifth straight day, buoyed by $606 million in ETF inflows.
- Ethereum approaches the $2,400 resistance, matching levels last seen in early May.
- XRP gains by more than 7% on Friday to trade above $1.35 while key moving averages provide support.
The cryptocurrency market remains bullish on Friday, led by Bitcoin’s (BTC) surge above $77,000. Altcoins, including Ethereum (ETH) and Ripple (XRP), mirror BTC’s positive outlook, trading near $2,400 and $1.35, respectively.
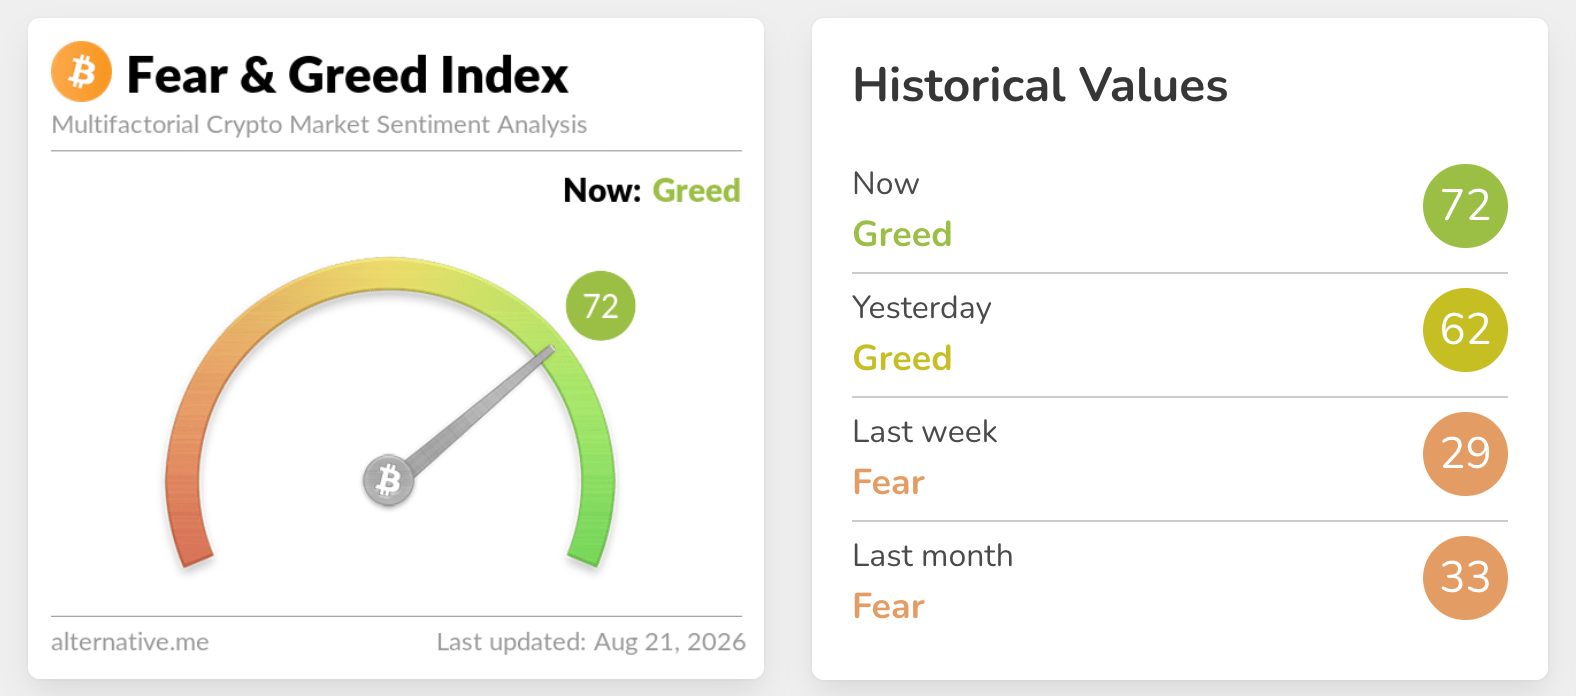
Market sentiment is very strong, as reflected in the Fear & Greed Index, currently at 72, up from 62 the day before. This suggests that risk appetite continues to grow, fuelling the ongoing rally.
Crypto ETFs extend bullish streak
Bitcoin spot Exchange-Traded Funds (ETFs) extended their bullish streak on Wednesday, attracting approximately $606 million in inflows. Inflows are now on their fourth consecutive day, totaling $1.6 billion through Thursday.
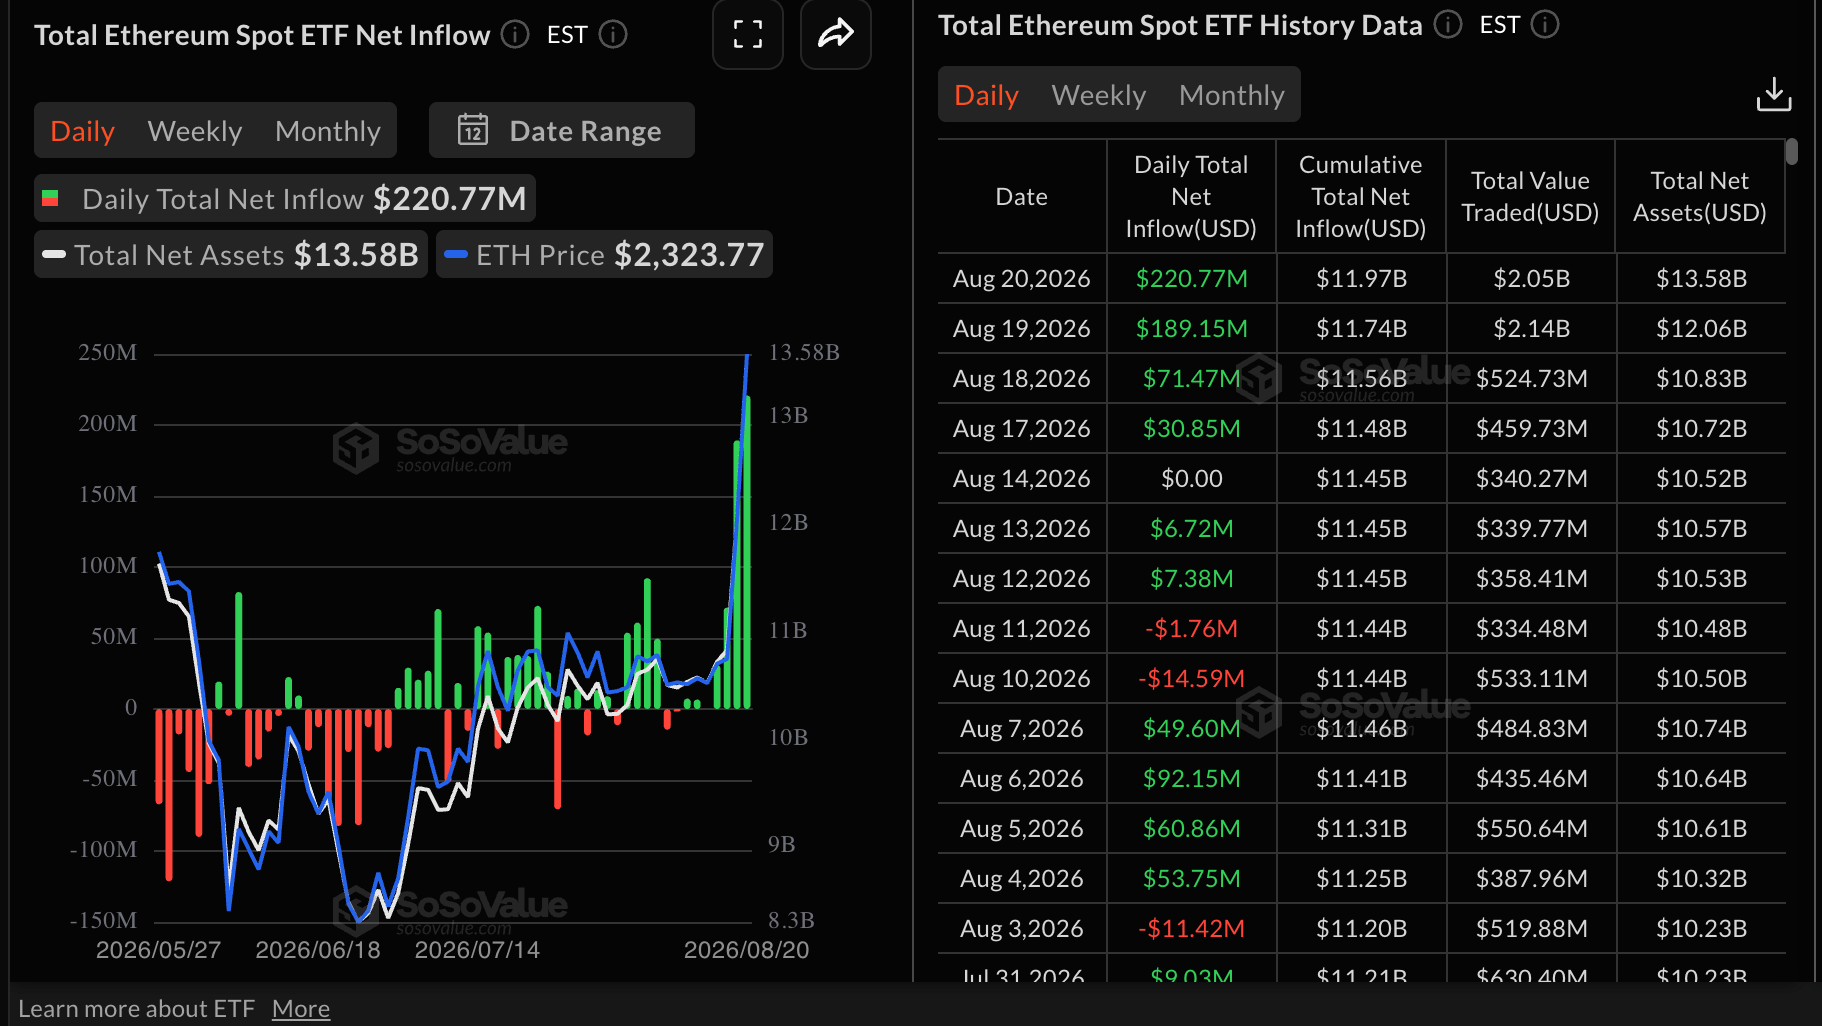
Ethereum split ETFs experienced another bullish day, with inflows totaling $221 million on Thursday. This marked a notable increase from $189 million on Wednesday, $71 million on Tuesday, and $31 million on Monday. Cumulatively, weekly inflows average $512 million through Thursday.
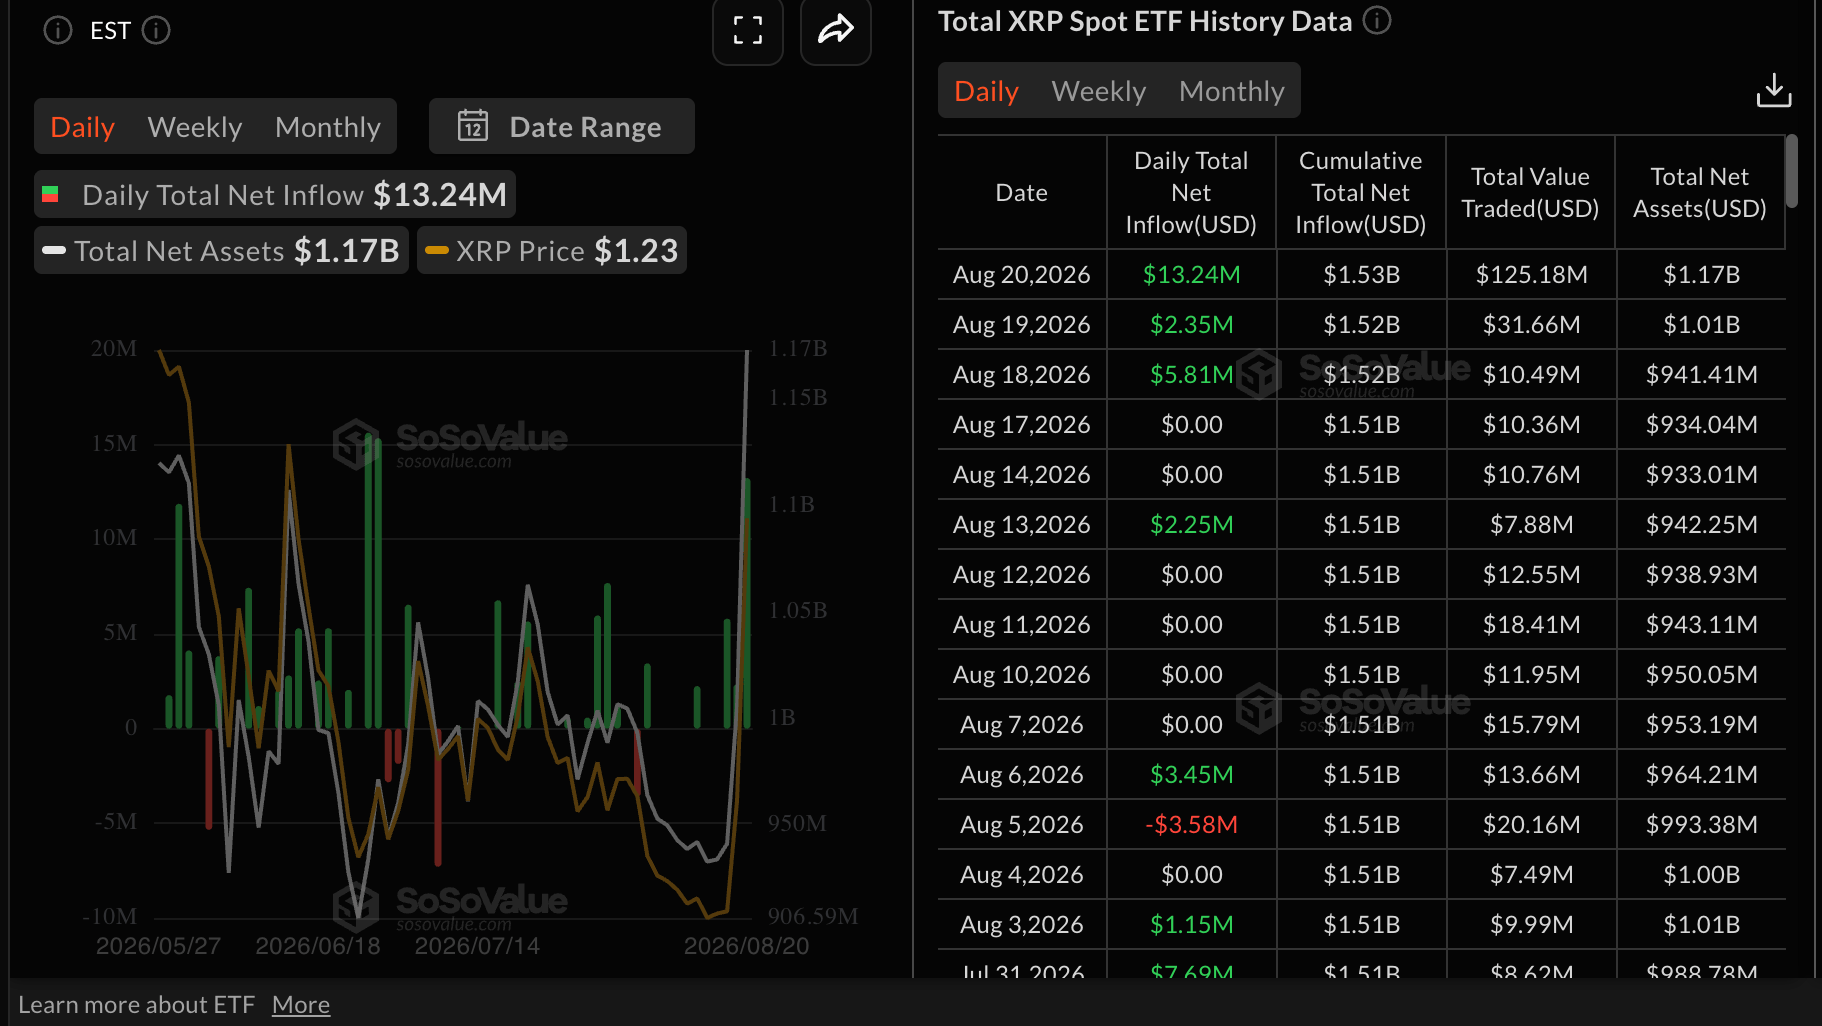
US-listed XRP spot ETFs have similarly maintained a bullish outlook this week, with inflows rising to roughly $13.2 million on Thursday, up from $2.35 million on Wednesday. Cumulative inflows rose to $1.53 billion, up from $1.52 billion the day before. Meanwhile, net assets under management edged higher to $1.17 billion, from $1.01 billion over the same 24-hour period.
Technical analysis: Bitcoin extends breakout
Bitcoin trades above $77,000, sustaining a bullish near-term bias as price holds comfortably above the 50-day, 100-day and 200-day Exponential Moving Averages (EMAs). The SuperTrend line at about $68,681 also sits below spot, reinforcing an underlying demand zone, while the Relative Strength Index (RSI) hovers deep in overbought territory near 85, suggesting strong but potentially stretched upside momentum, in line with an expanding positive Moving Average Convergence Divergence (MACD) profile.
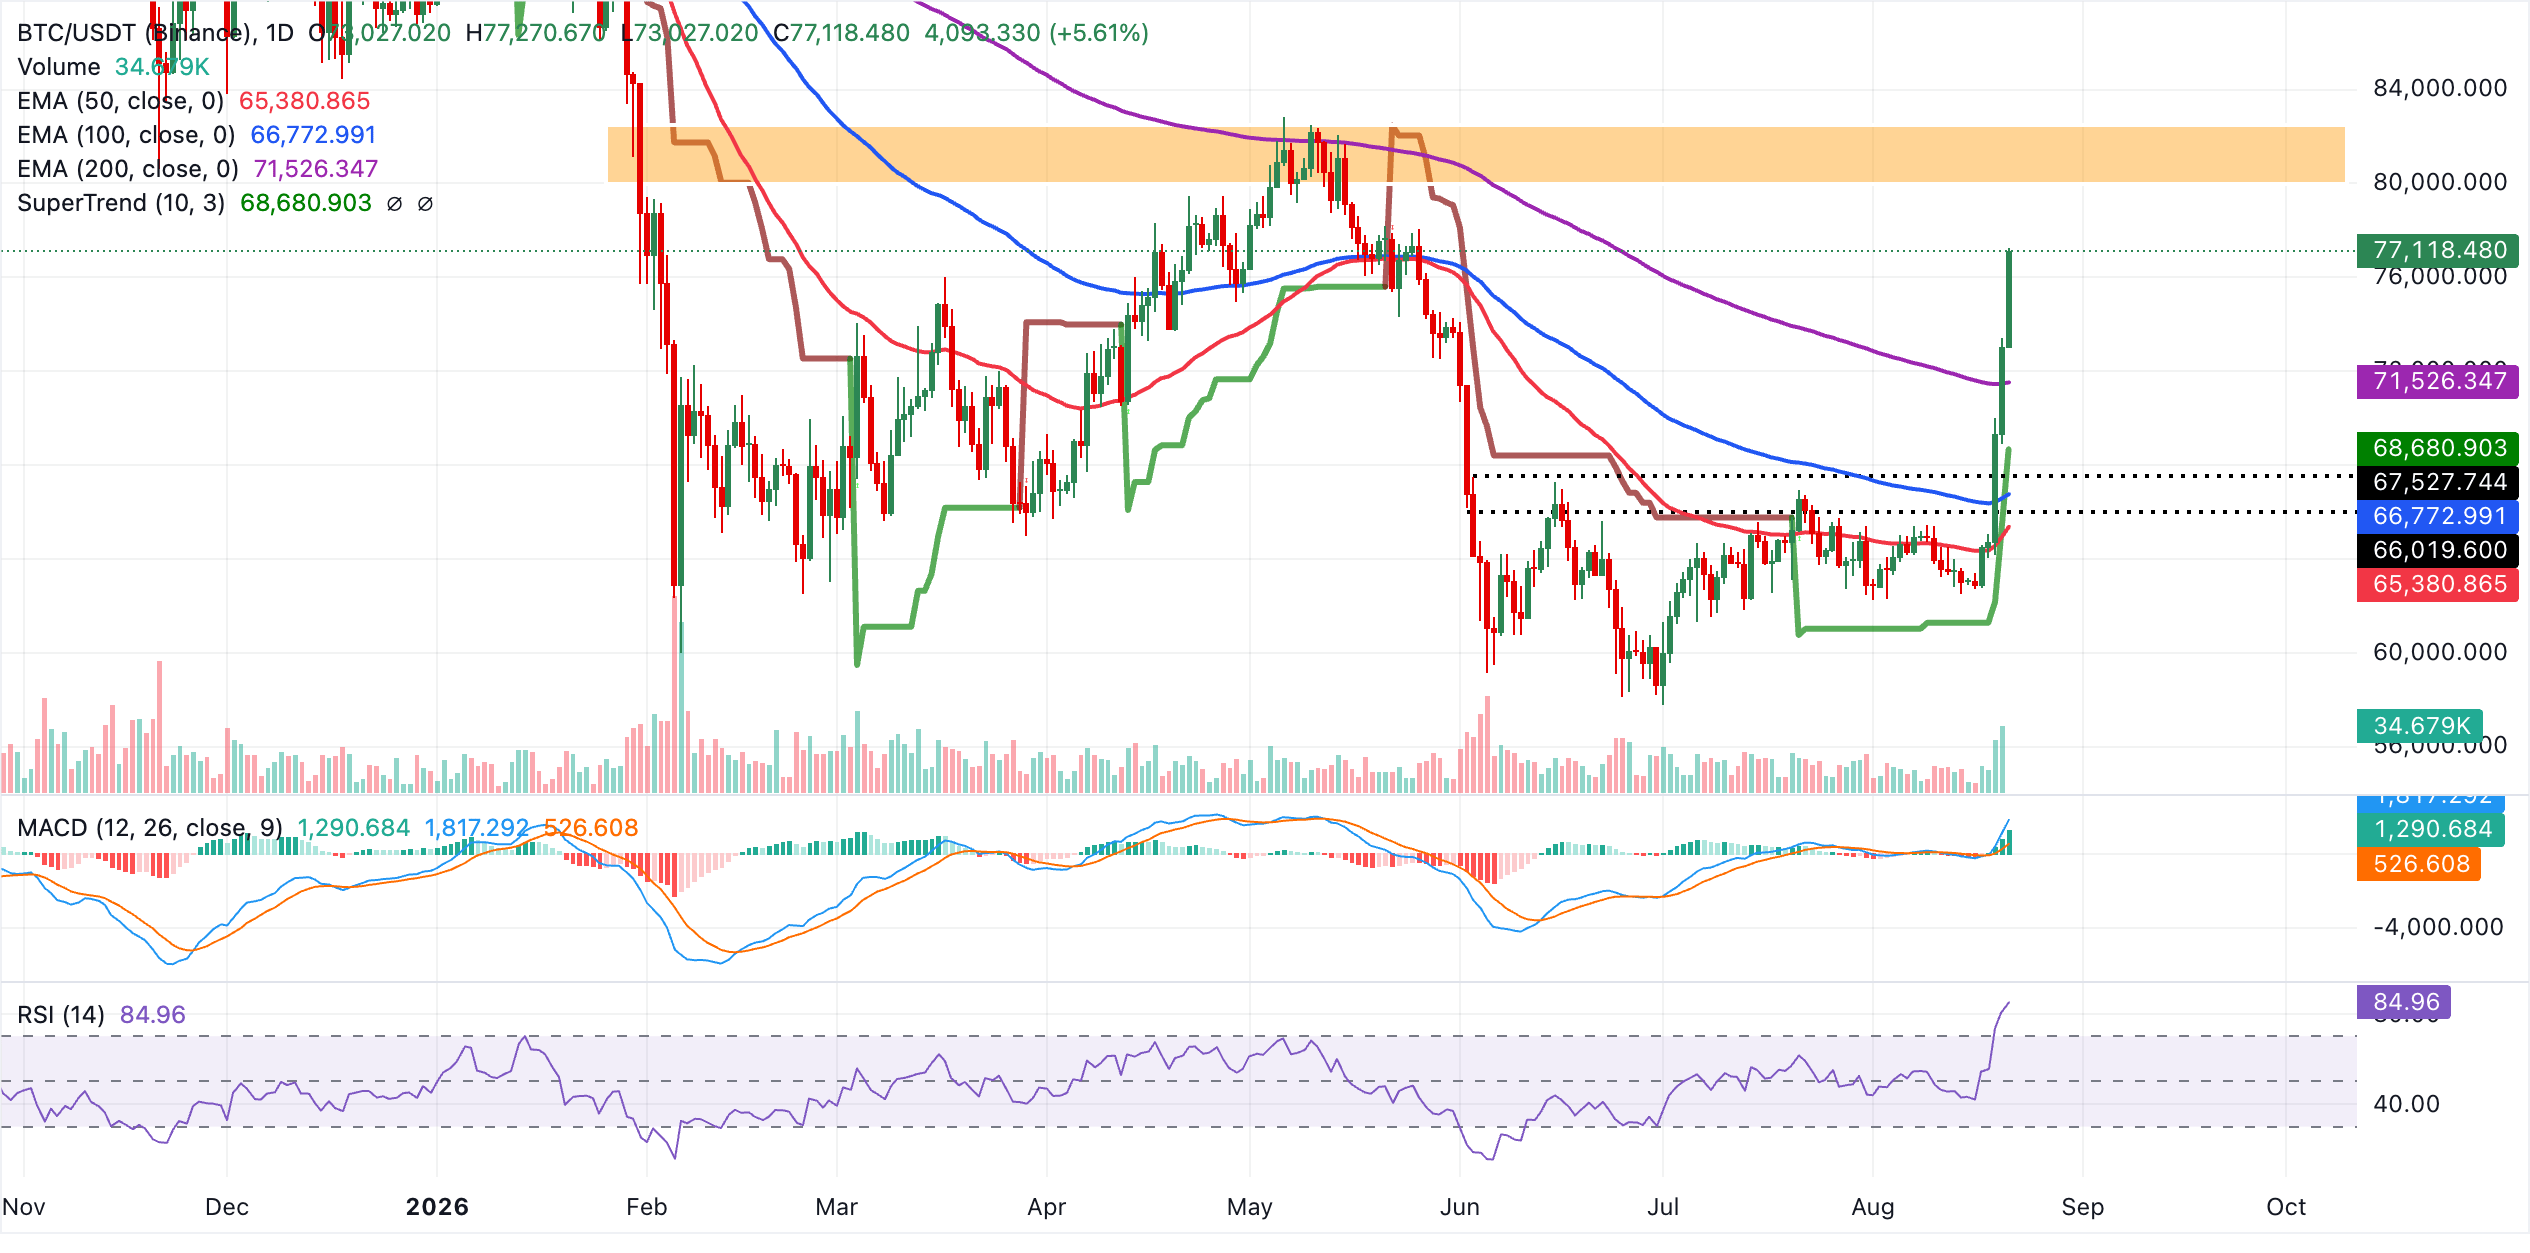
Initial support lies at the 200-day EMA around $71,526, with additional backing from the SuperTrend band near $68,681 and the 100-day EMA close to $66,773. A deeper pullback could test the 50-day EMA around $65,380. With no clear overhead technical levels from the daily chart, bulls are likely to stay in control while price holds above these supports. However, the overbought RSI warns that any failure to defend the EMA and SuperTrend cluster could trigger a sharper corrective phase.
Altcoins technical outlook: Ethereum and XRP bulls tighten grip
Ethereum trades at $2,388, extending a strong bullish phase after breaking decisively above its key exponential moving averages. Momentum remains very strong, with the MACD firmly positive and the RSI at 86 in overbought territory, hinting that while bulls are in control, the risk of a corrective pullback is rising.
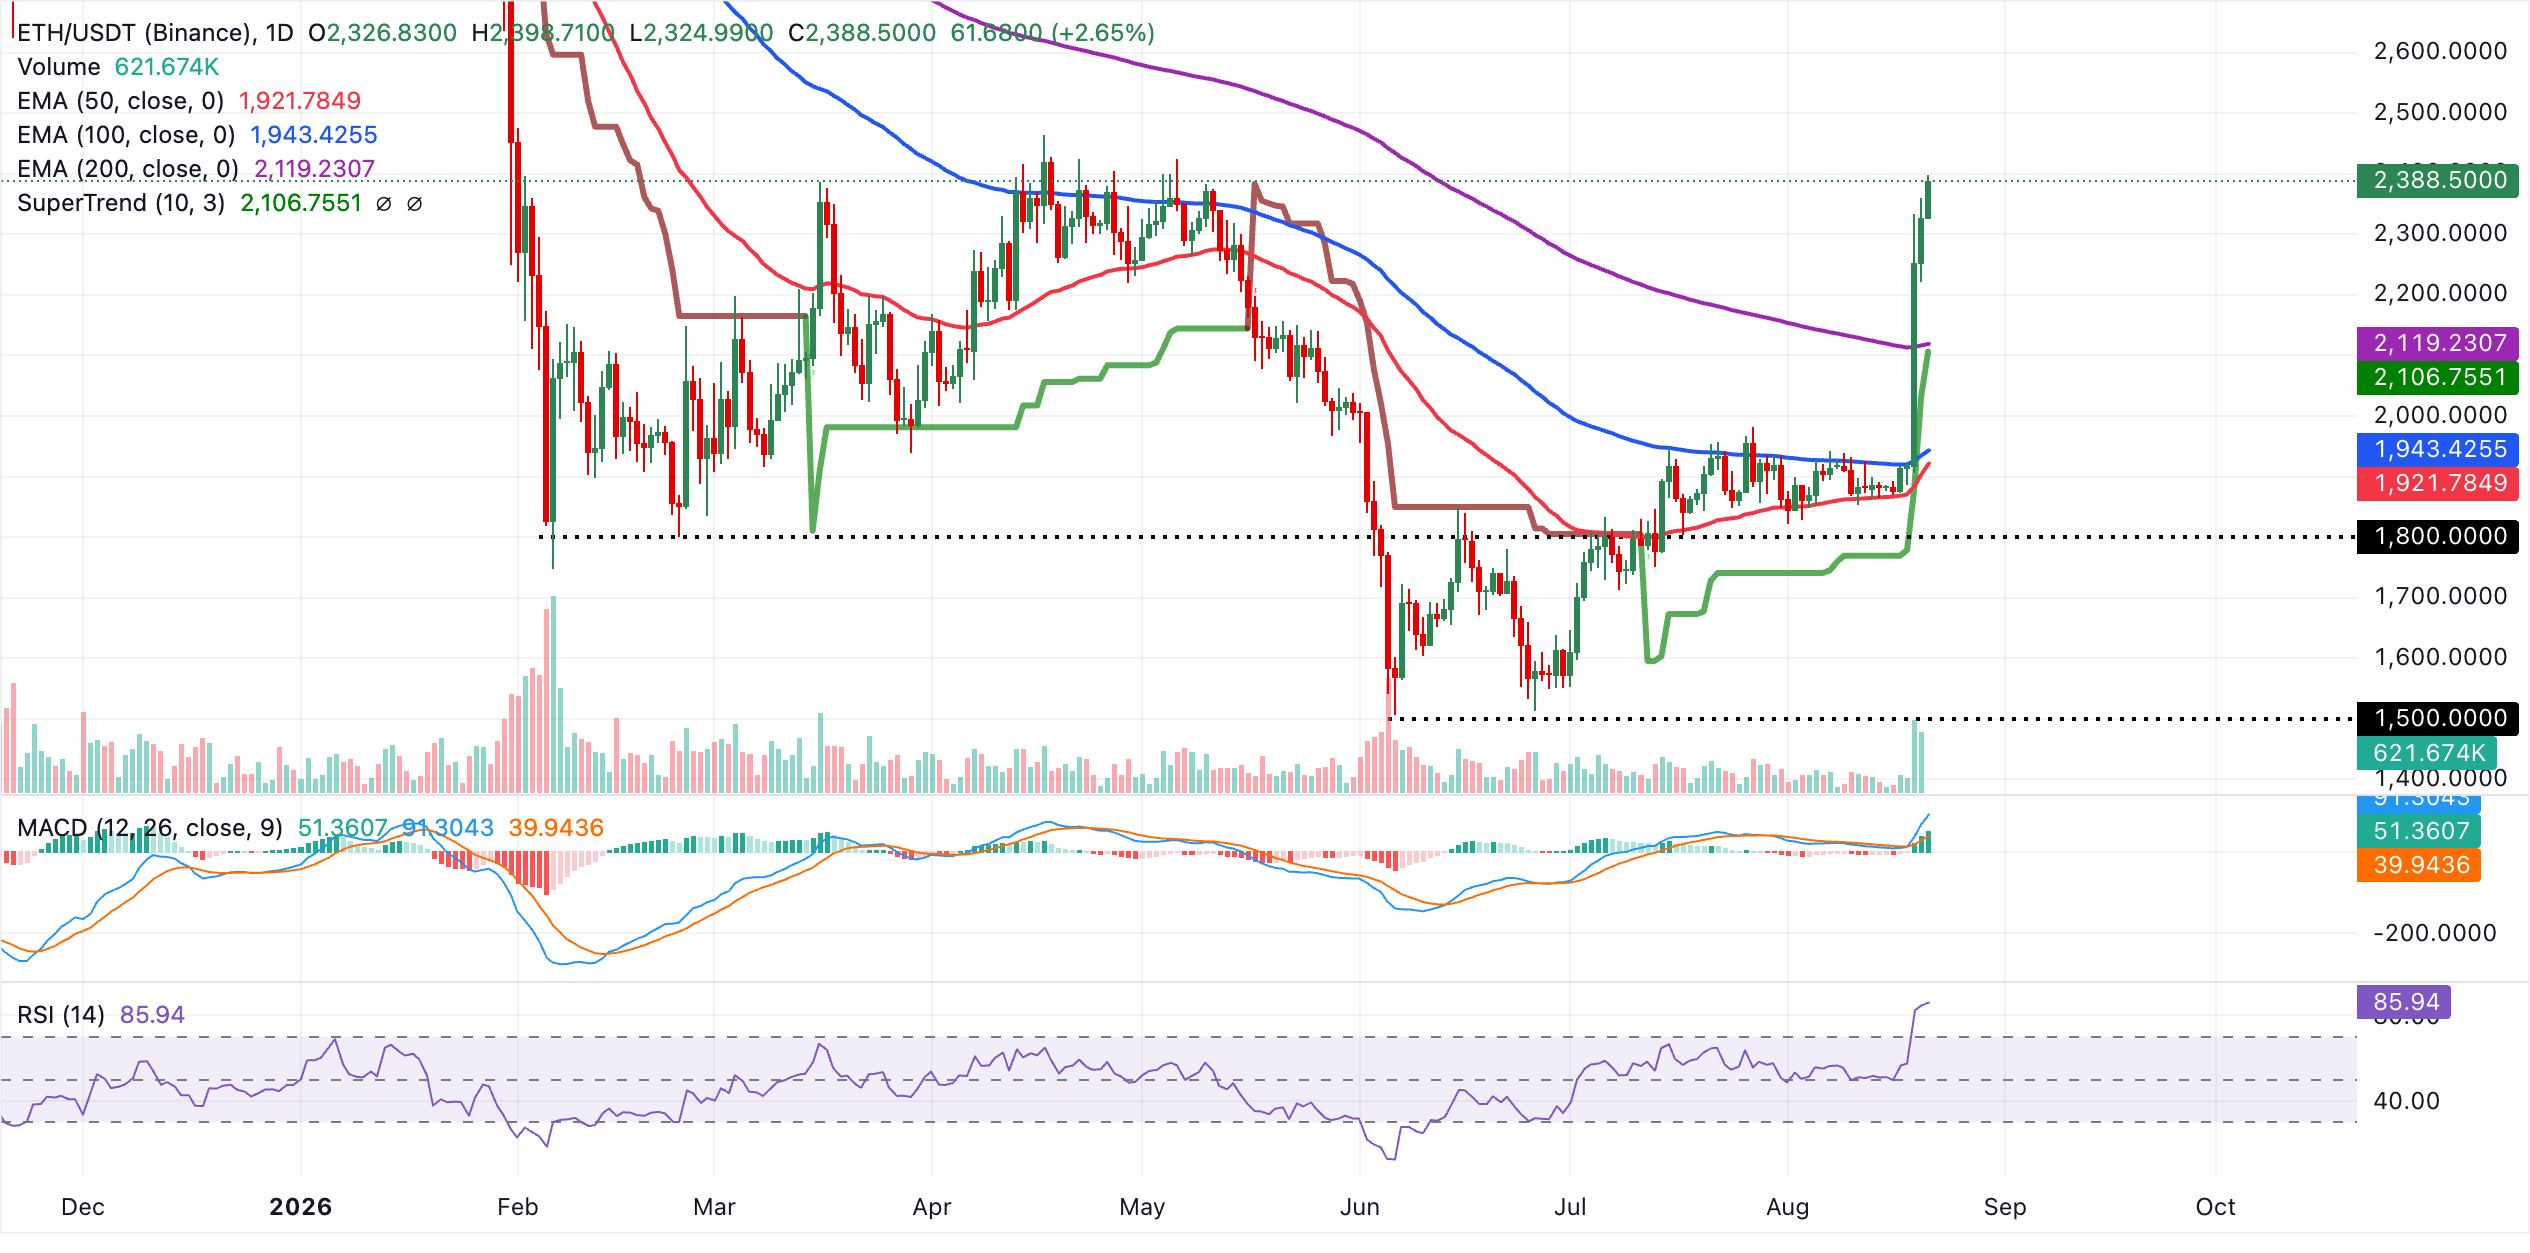
Initial support lies around the 200-day EMA, roughly at $2,119, followed by the SuperTrend zone at $2,107, which together form a key medium-term demand area if profit-taking accelerates. Deeper pullbacks would likely look toward the clustered 50-day and 100-day EMAs at $1,922 and $1,943 as a broader bullish line in the sand. As long as ETH holds above these levels, the technical structure would continue to favor buying dips rather than calling a top.
XRP, on the other hand, holds a bullish near-term bias as price trades above the 50-day, 100-day and SuperTrend supports, while hovering just under the 200-day EMA at $1.34, which acts as immediate resistance.
Meanwhile, momentum remains strong, with the MACD line advancing in positive territory and the RSI deep in overbought territory at 82, hinting that while upside pressure persists, the rally may be stretched in the short term.
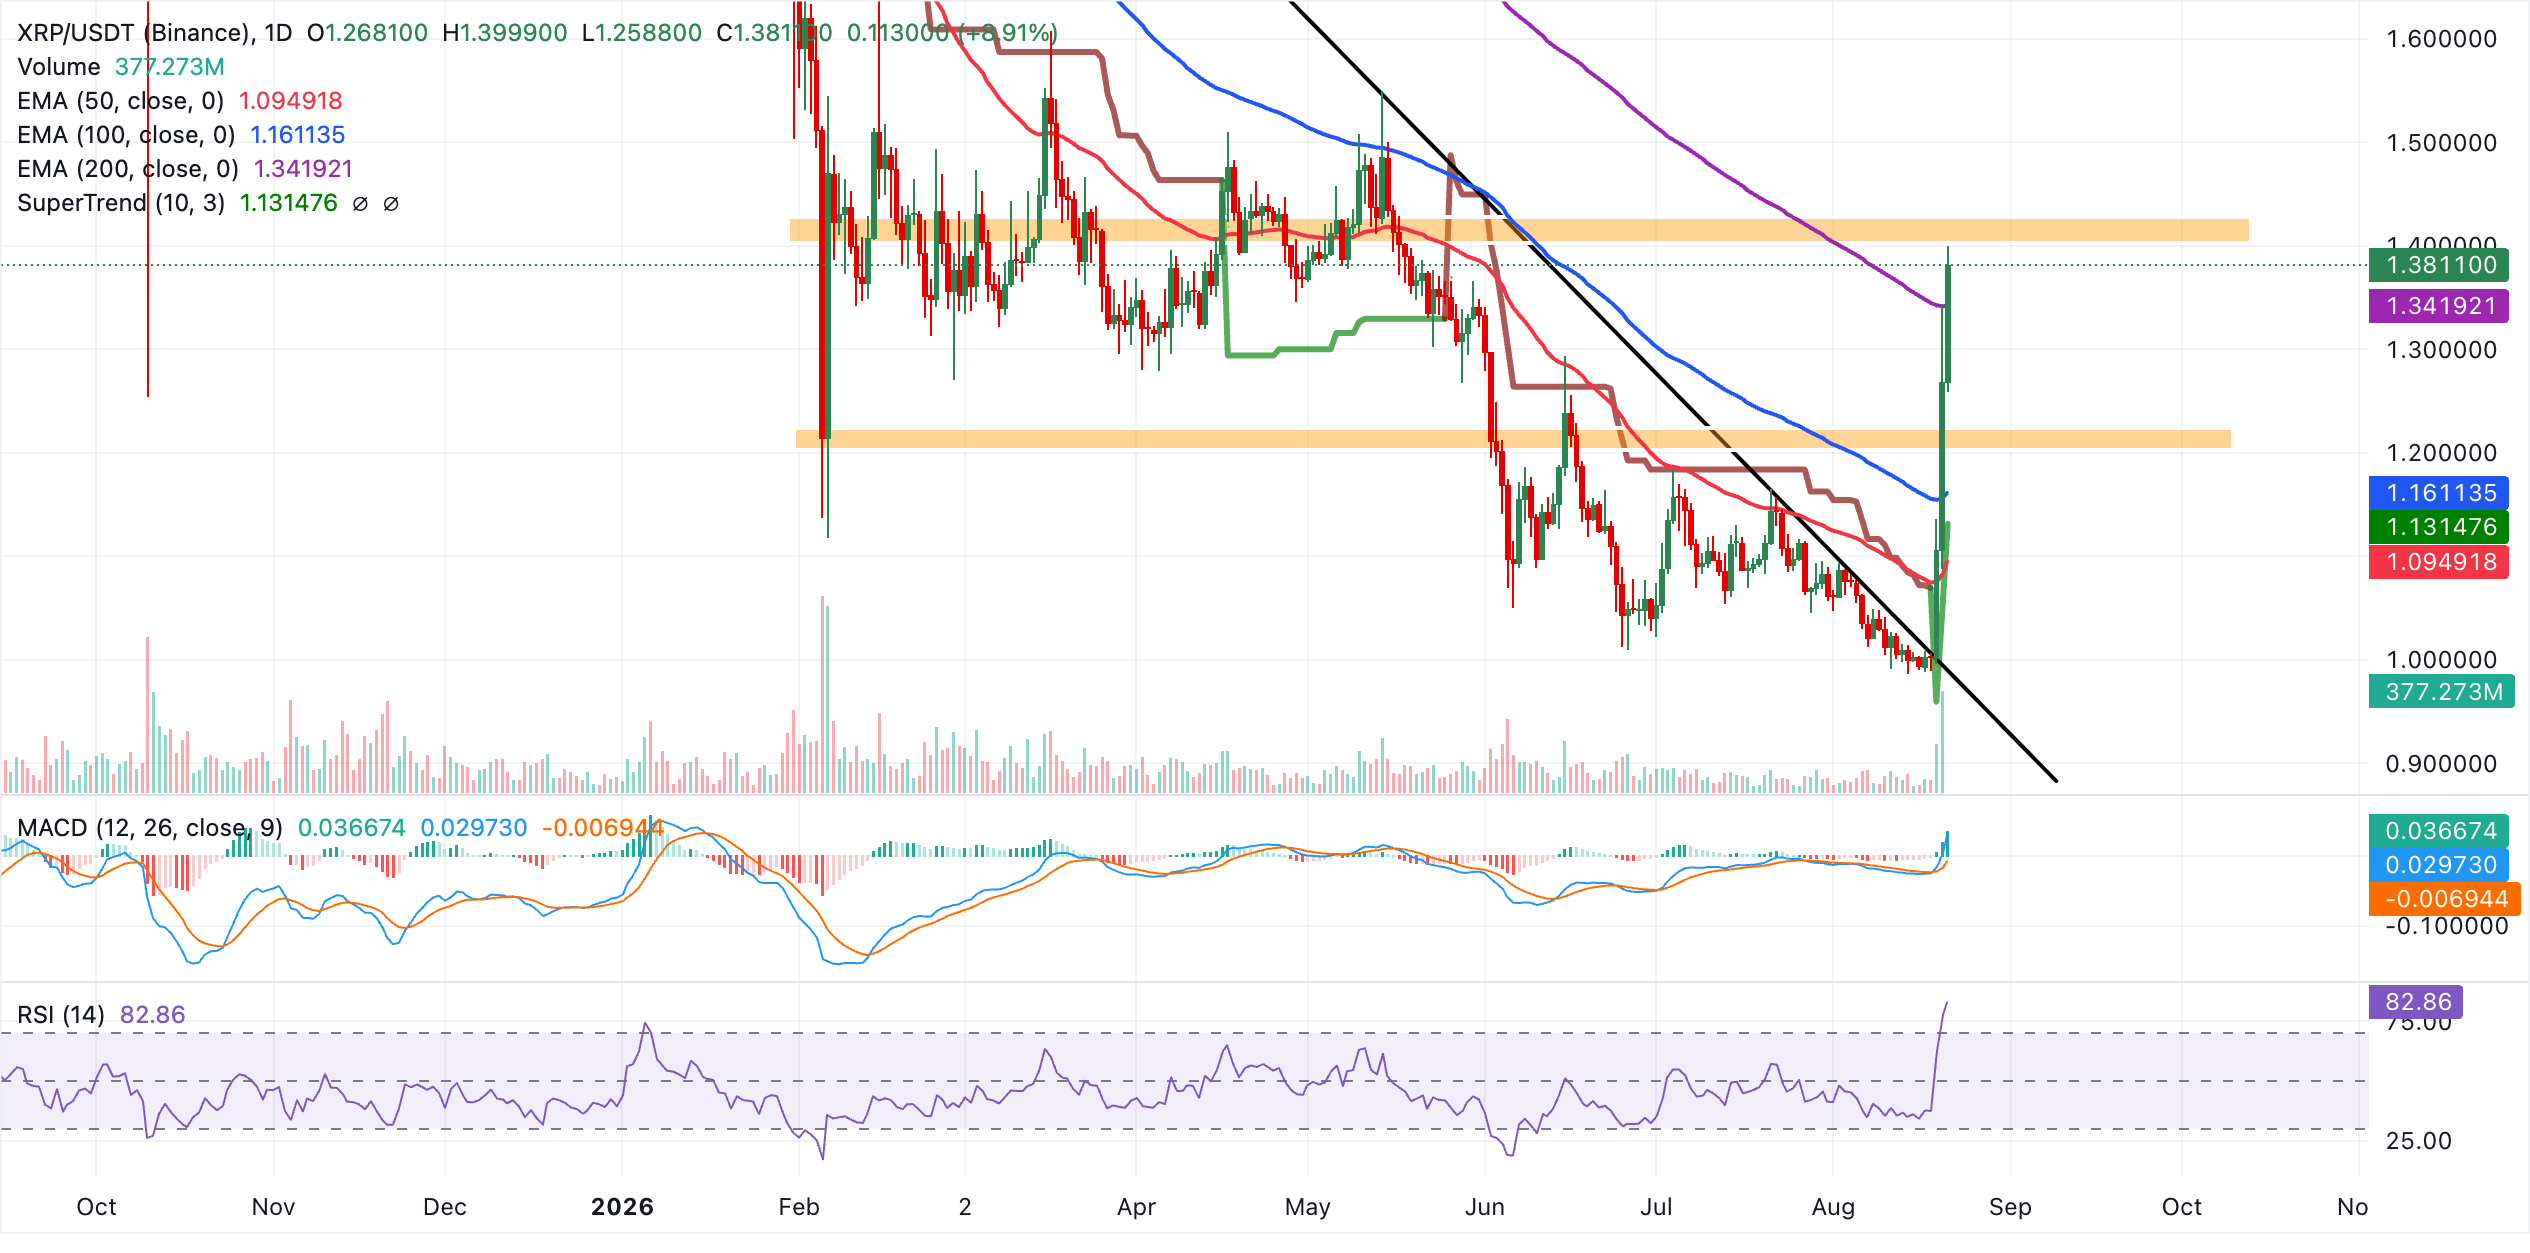
The 200-day EMA at $1.34 is the first barrier. A daily close above this level would reinforce the bullish structure and open the way for further gains. On the downside, initial support is seen at the 100-day EMA at $1.16, followed by the SuperTrend line around $1.12 and the 50-day EMA at $1.09, where dips could attract buyers as long as price holds above this cluster of underlying demand.
Cryptocurrency prices FAQs
Token launches influence demand and adoption among market participants. Listings on crypto exchanges deepen the liquidity for an asset and add new participants to an asset’s network. This is typically bullish for a digital asset.
A hack is an event in which an attacker captures a large volume of the asset from a DeFi bridge or hot wallet of an exchange or any other crypto platform via exploits, bugs or other methods. The exploiter then transfers these tokens out of the exchange platforms to ultimately sell or swap the assets for other cryptocurrencies or stablecoins. Such events often involve an en masse panic triggering a sell-off in the affected assets.
Macroeconomic events like the US Federal Reserve’s decision on interest rates influence crypto assets mainly through the direct impact they have on the US Dollar. An increase in interest rate typically negatively influences Bitcoin and altcoin prices, and vice versa. If the US Dollar index declines, risk assets and associated leverage for trading gets cheaper, in turn driving crypto prices higher.
Halvings are typically considered bullish events as they slash the block reward in half for miners, constricting the supply of the asset. At consistent demand if the supply reduces, the asset’s price climbs.
(The technical analysis of this story was written with the help of an AI tool. Know more.)
Bài viết đề xuất


