


Crypto Today: Bitcoin, Ethereum, XRP stabilize despite weakening institutional, retail demand
- Bitcoin holds below $90,000 on Wednesday, weighed down by weakening institutional and retail demand.
- Ethereum defends $2,900 support amid resumption of spot ETF withdrawals.
- XRP holds above $1.90 as US-listed spot ETFs record the second outflow since launch.
Bitcoin (BTC) is exhibiting stability after six consecutive days of decline, trading above $89,000 at the time of writing on Wednesday. The broader cryptocurrency market is rife with geopolitical tension, as it is sticky with macroeconomic risks and declining institutional and retail interest.
Altcoins, including Ethereum (ETH) and Ripple (XRP), are testing key support levels, underscoring the fragility of the current market structure. Ethereum remains above the $2,900 support but below the pivotal $3,000 level.
Meanwhile, XRP holds above $1.90, signaling short-term stability, as bulls push to reclaim the $2.00 level.
Bitcoin, Ethereum, XRP reverse as ETF outflows persist
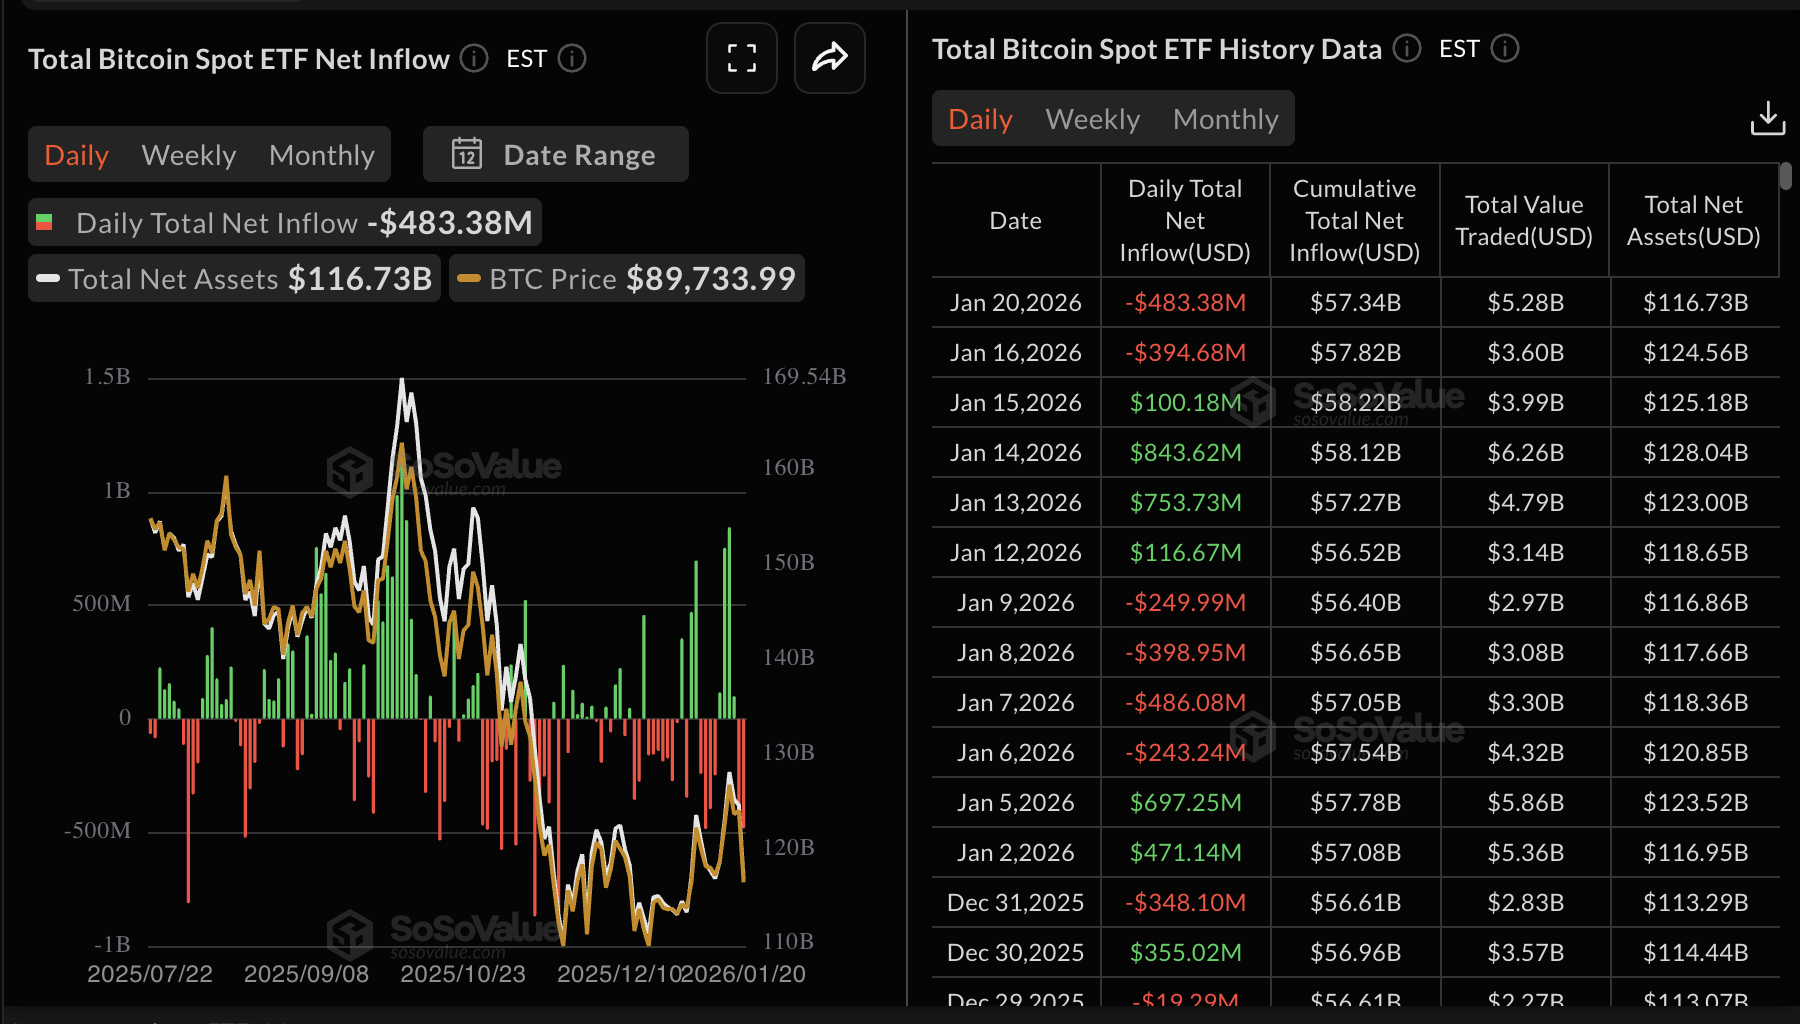
Bitcoin spot Exchange Traded Funds (ETFs) extended outflows for the second day, with $483 million withdrawn on Tuesday. The cumulative total inflow stands at approximately $57.3 billion, and net assets at $116.7 billion.
The resumption of inflows last week boosted the total inflow by $1.42 billion, the highest since October. The tailwind from inflows helped propel Bitcoin near $98,000 on January 14, underscoring the ETFs’ effect on prices.
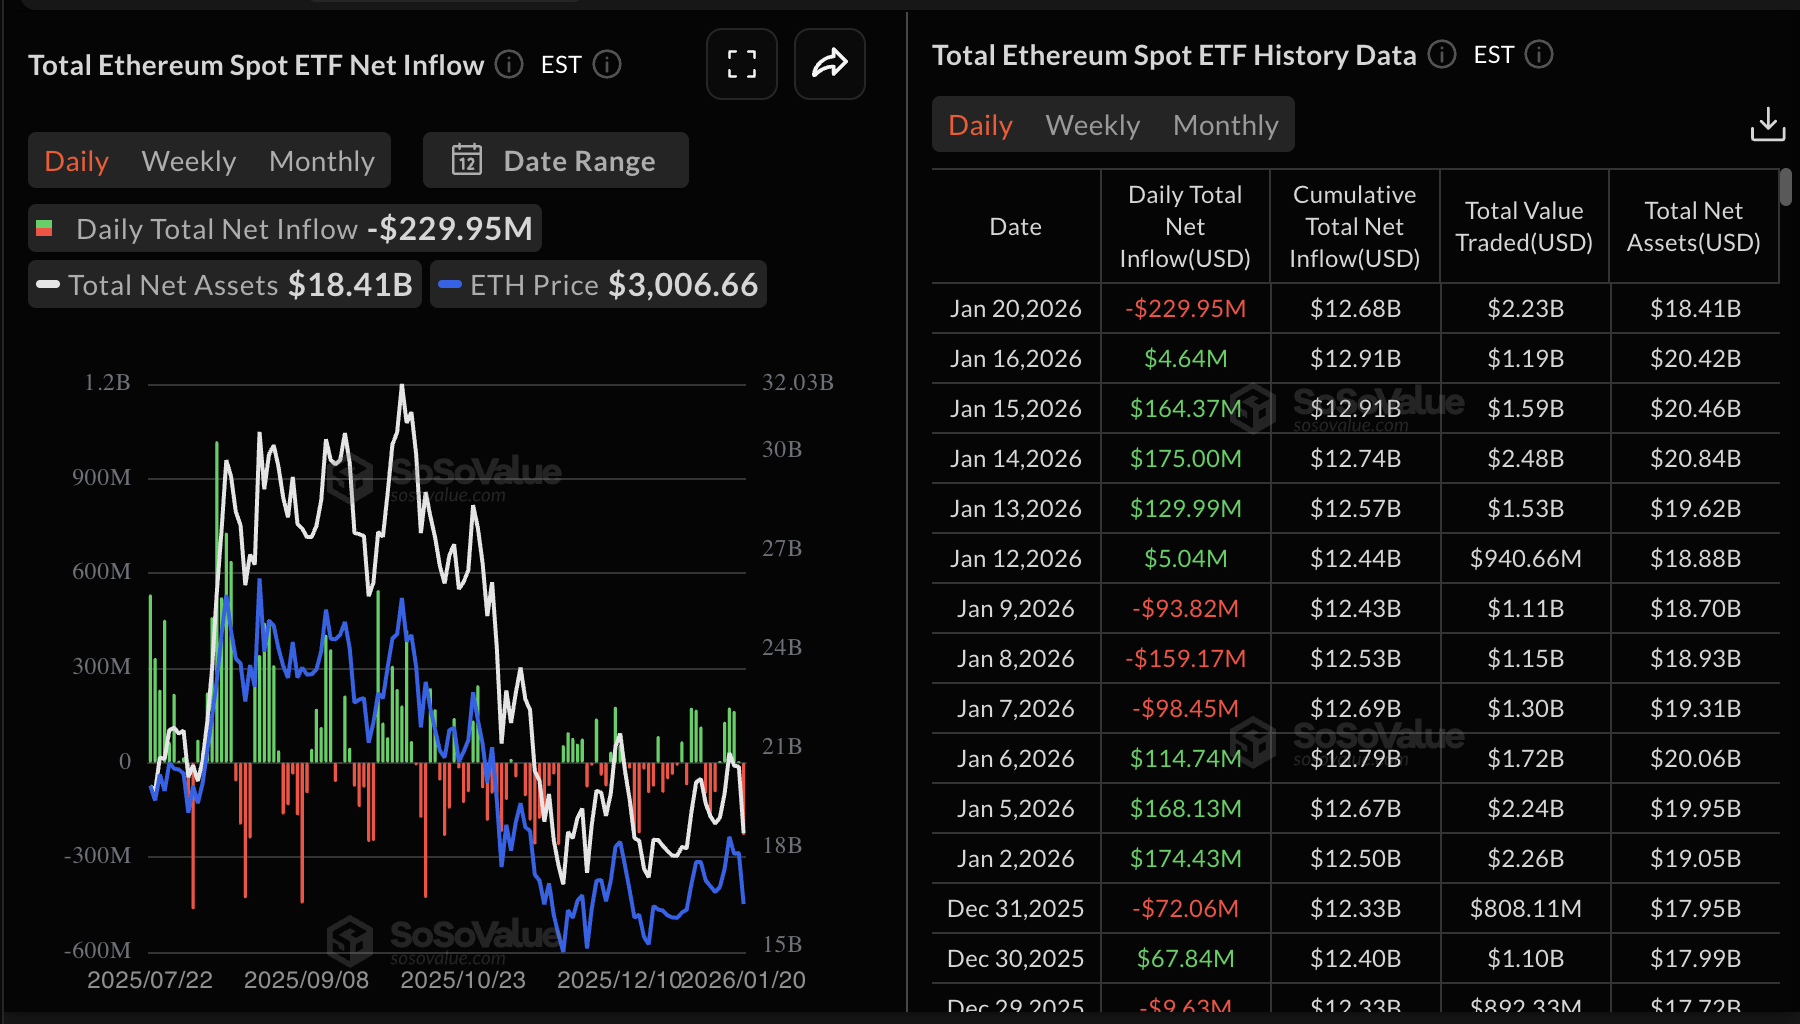
Ethereum spot ETFs also saw outflows on Tuesday, with investors withdrawing almost $230 million. This outflow followed a five-day inflow streak last week.
The cumulative total inflow stands at approximately $12.7 billion with net assets at $18.4 billion, according to SoSoValue data.
Meanwhile, XRP spot ETFs recorded their second outflow since their launch in November. The US-listed ETFs posted approximately $53 million in outflows on Tuesday, bringing the cumulative total inflow to $1.2 billion and net assets to $1.3 billion.
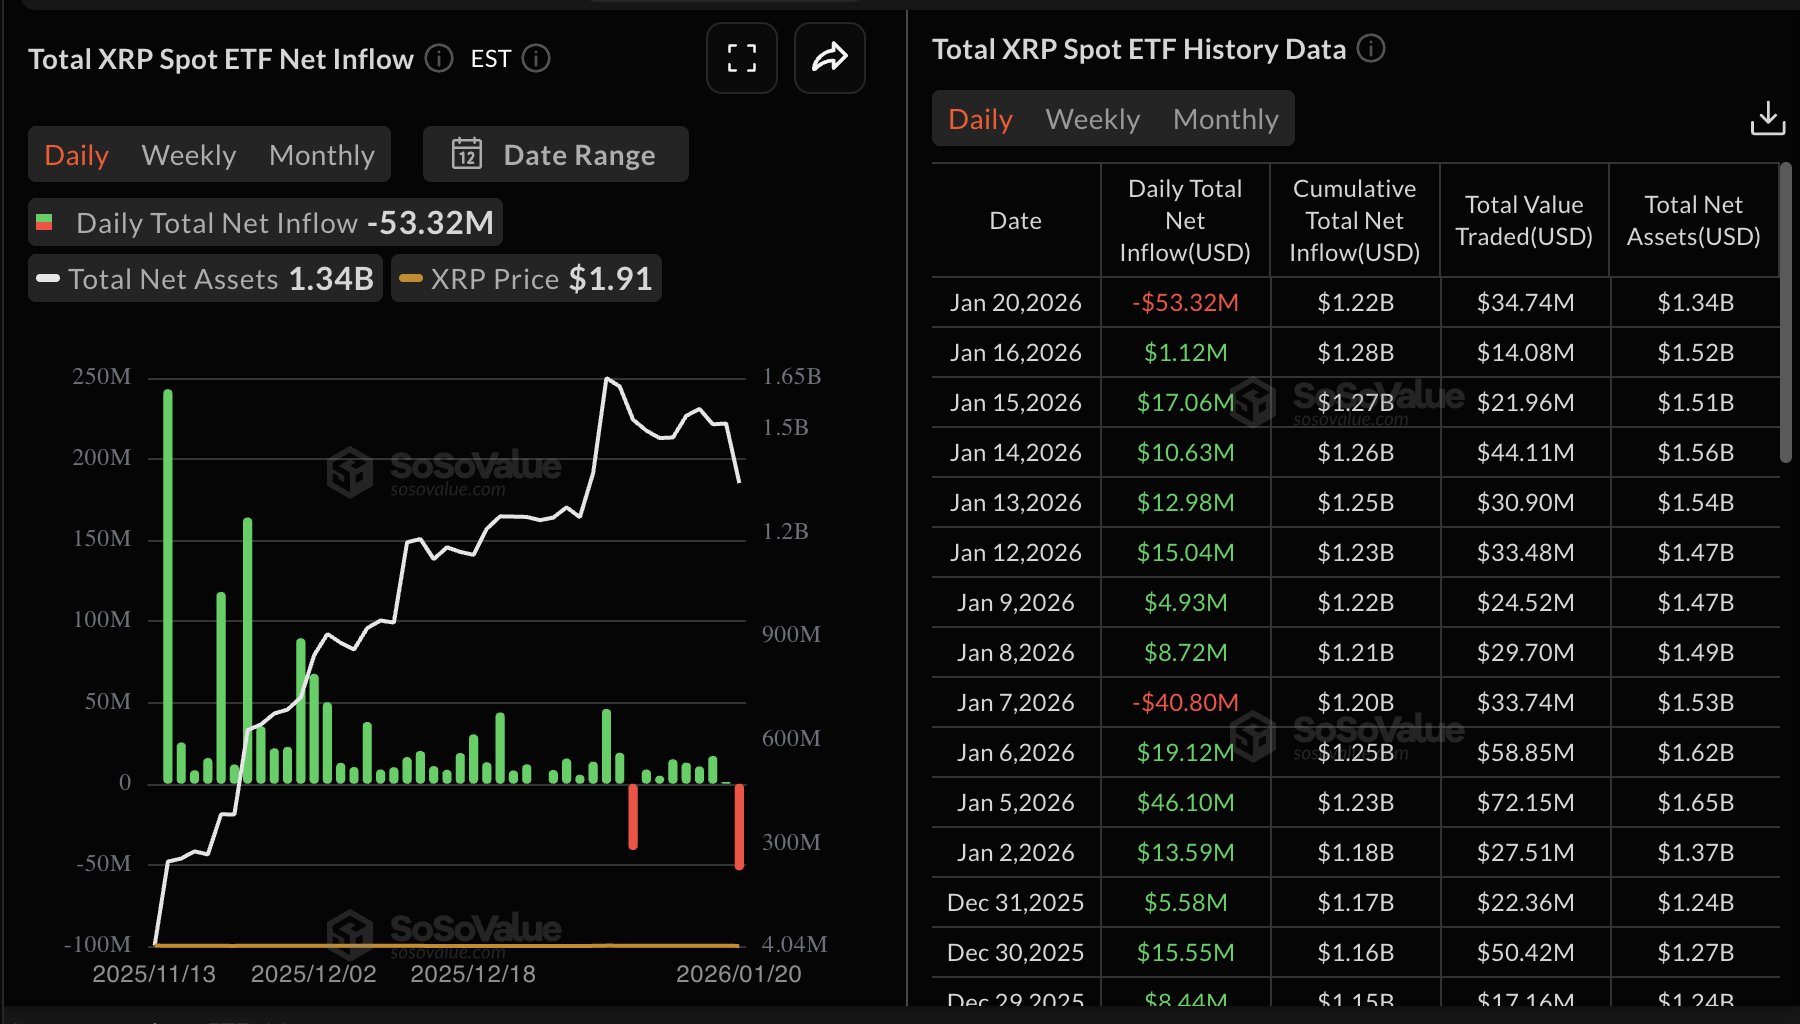
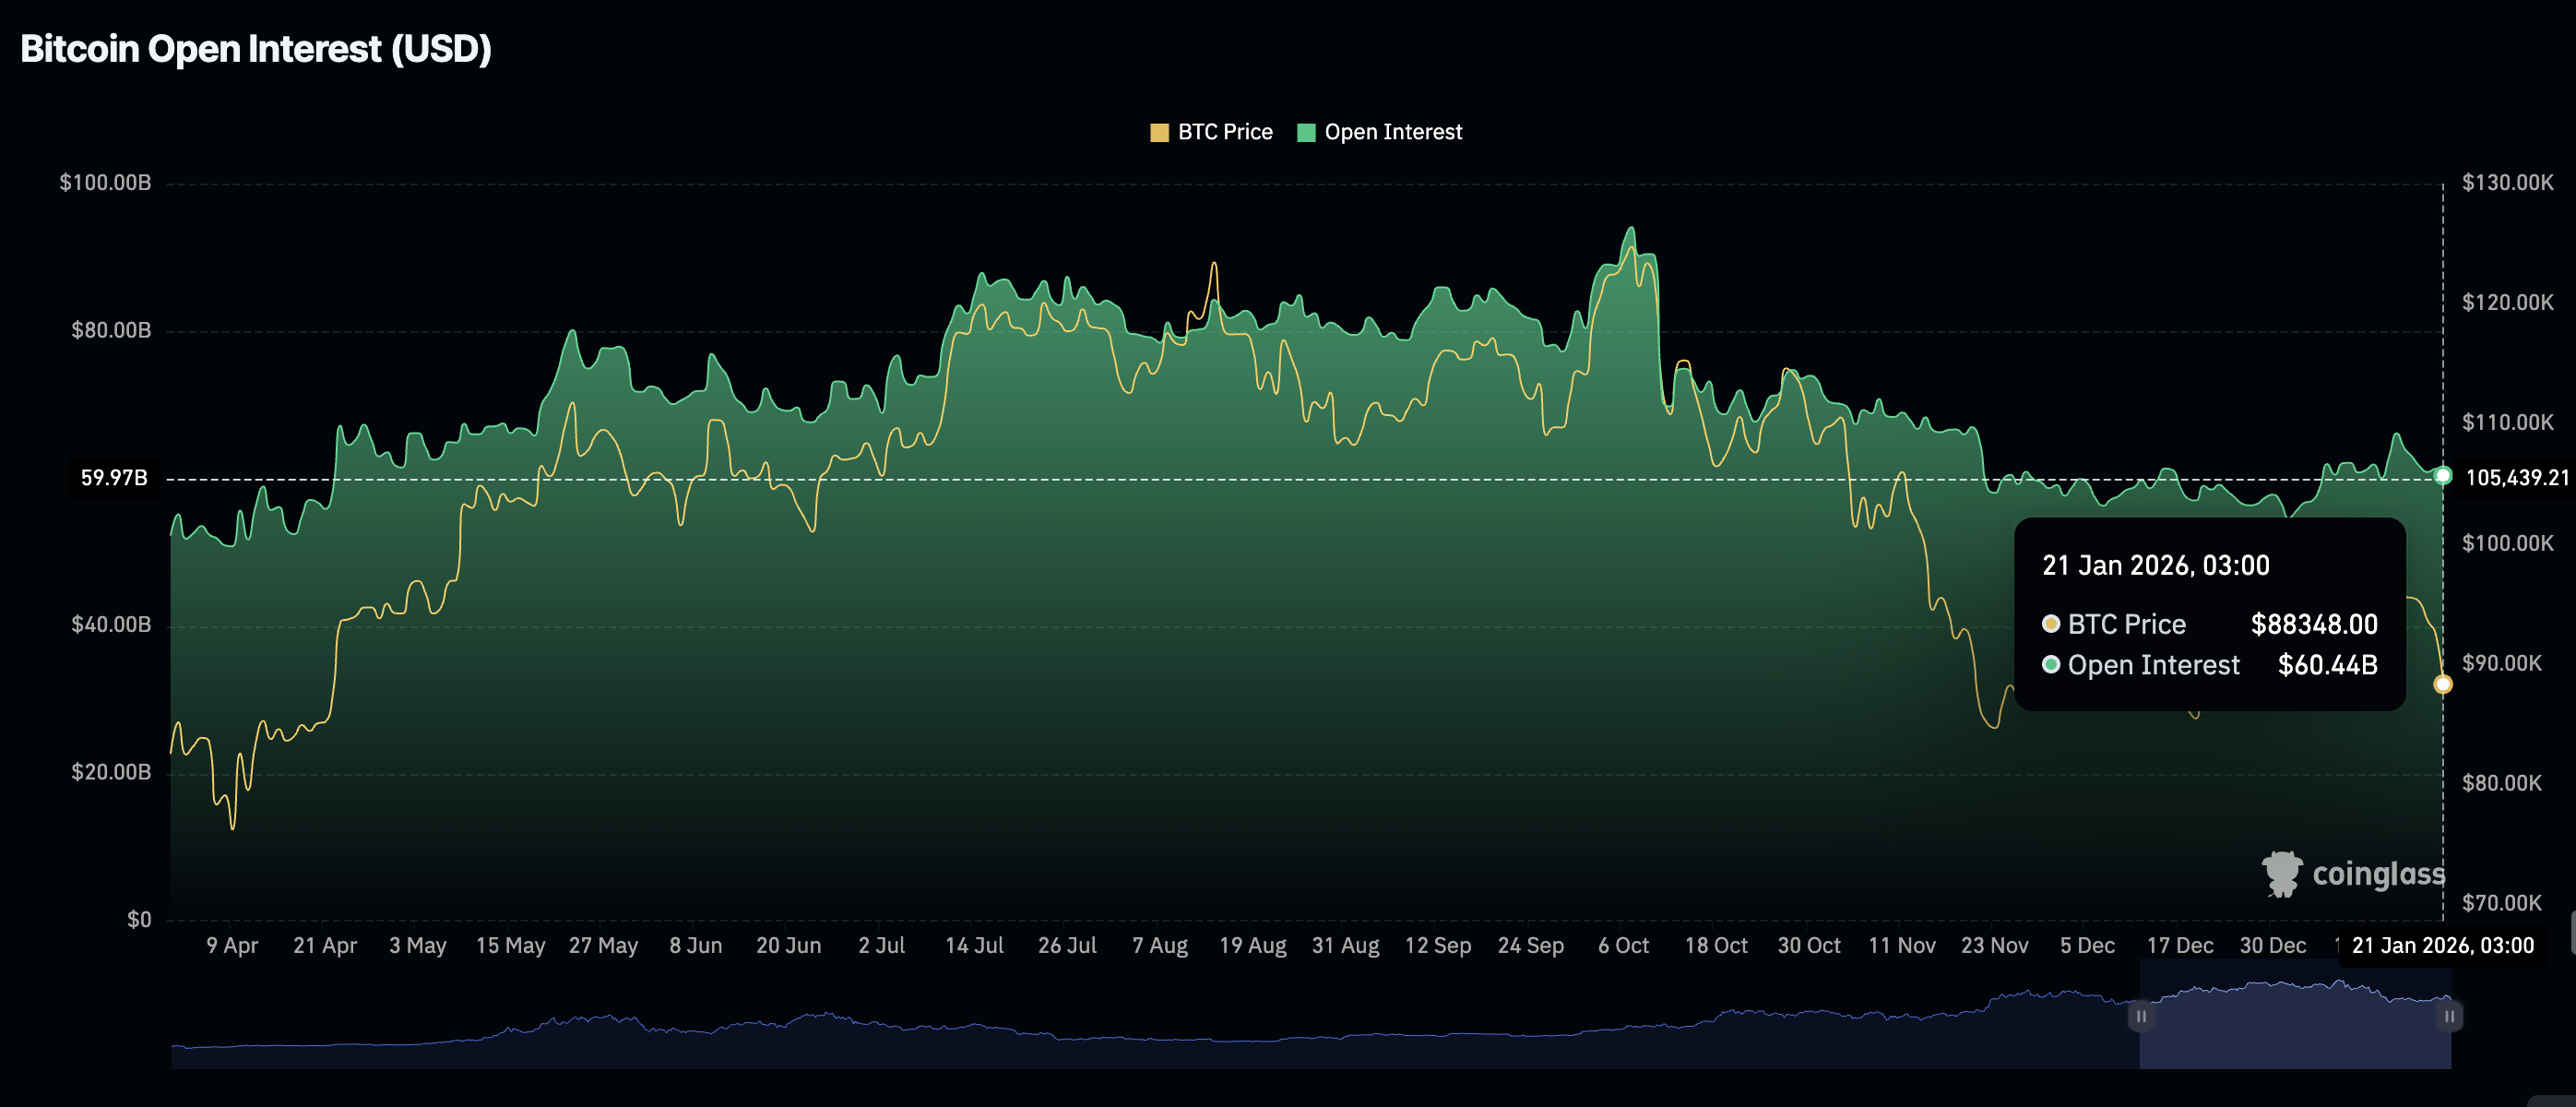
Chart of the day: Bitcoin steadies as weak derivatives create headwinds
Despite spot ETFs experiencing outflows, Bitcoin is stable above support at $89,000. The Relative Strength Index (RSI) has risen to 43 on the daily chart, indicating fading bearish momentum.
A close above the immediate descending trendline resistance, as observed on the same chart, could extend BTC’s recovery above $90,000.
However, traders should temper their expectations given that the Moving Average Convergence Divergence (MACD) indicator shows a bearish crossover, with the MACD line below the signal line, suggesting that the overall path of least resistance would be downward.
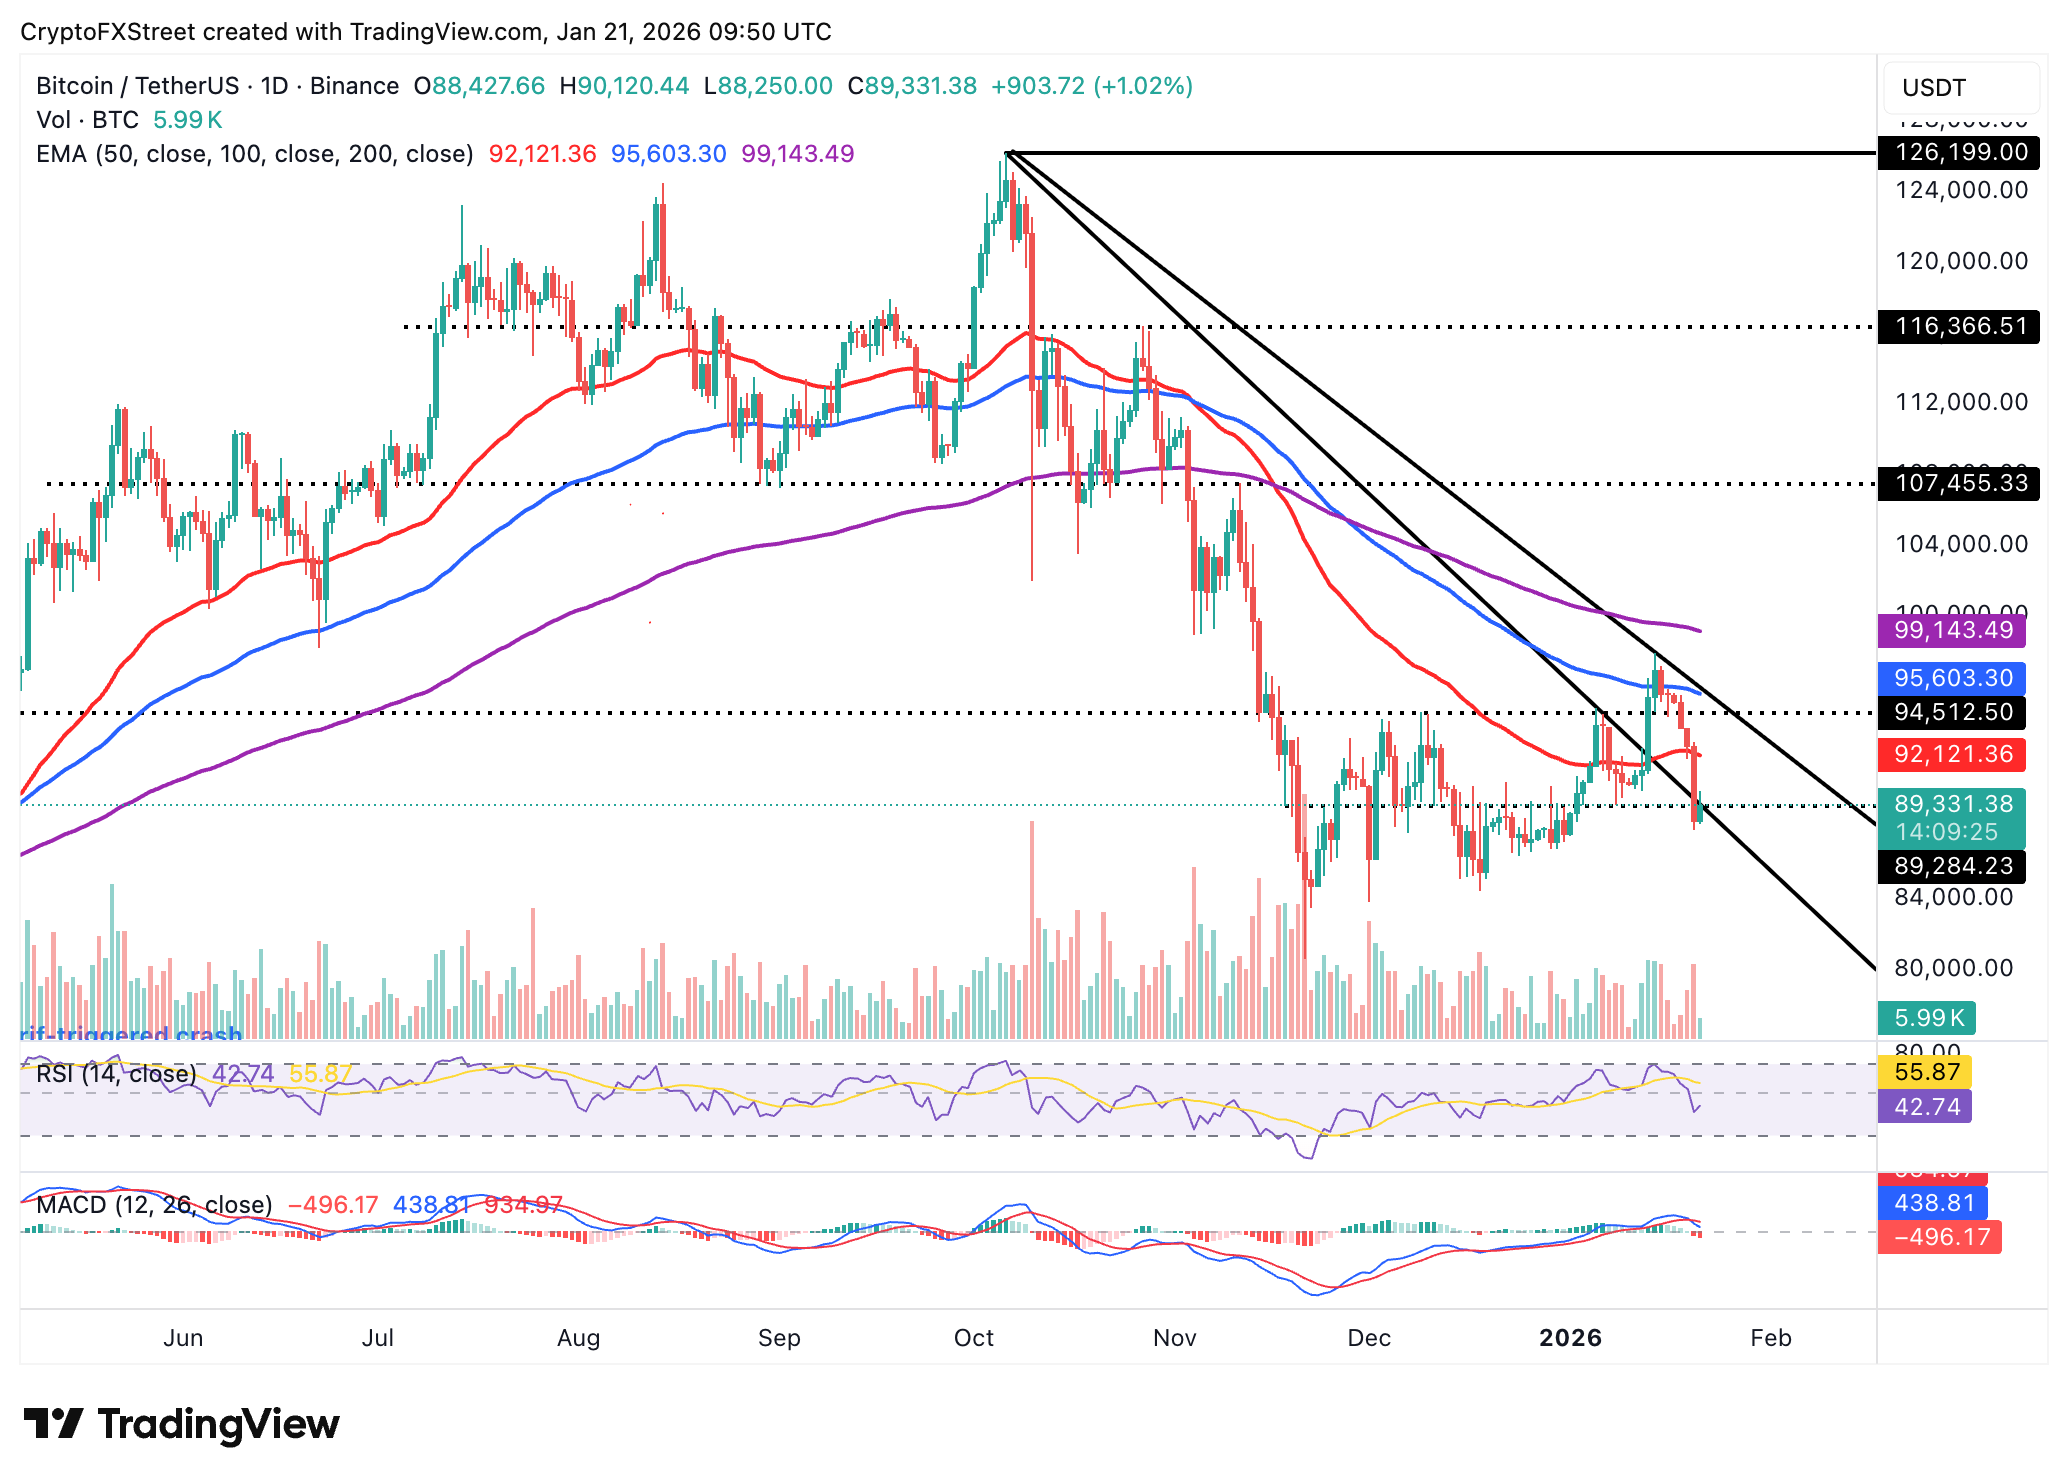
The derivatives market is another factor that continues to weigh on Bitcoin, as futures Open Interest (OI) falls to approximately $60 billion on Wednesday, from $61 billion on Monday and, by extension, $66 billion on January 15. Further weakening would imply a lack of interest and confidence in Bitcoin, especially among retail traders, leaving prices vulnerable to headwinds.
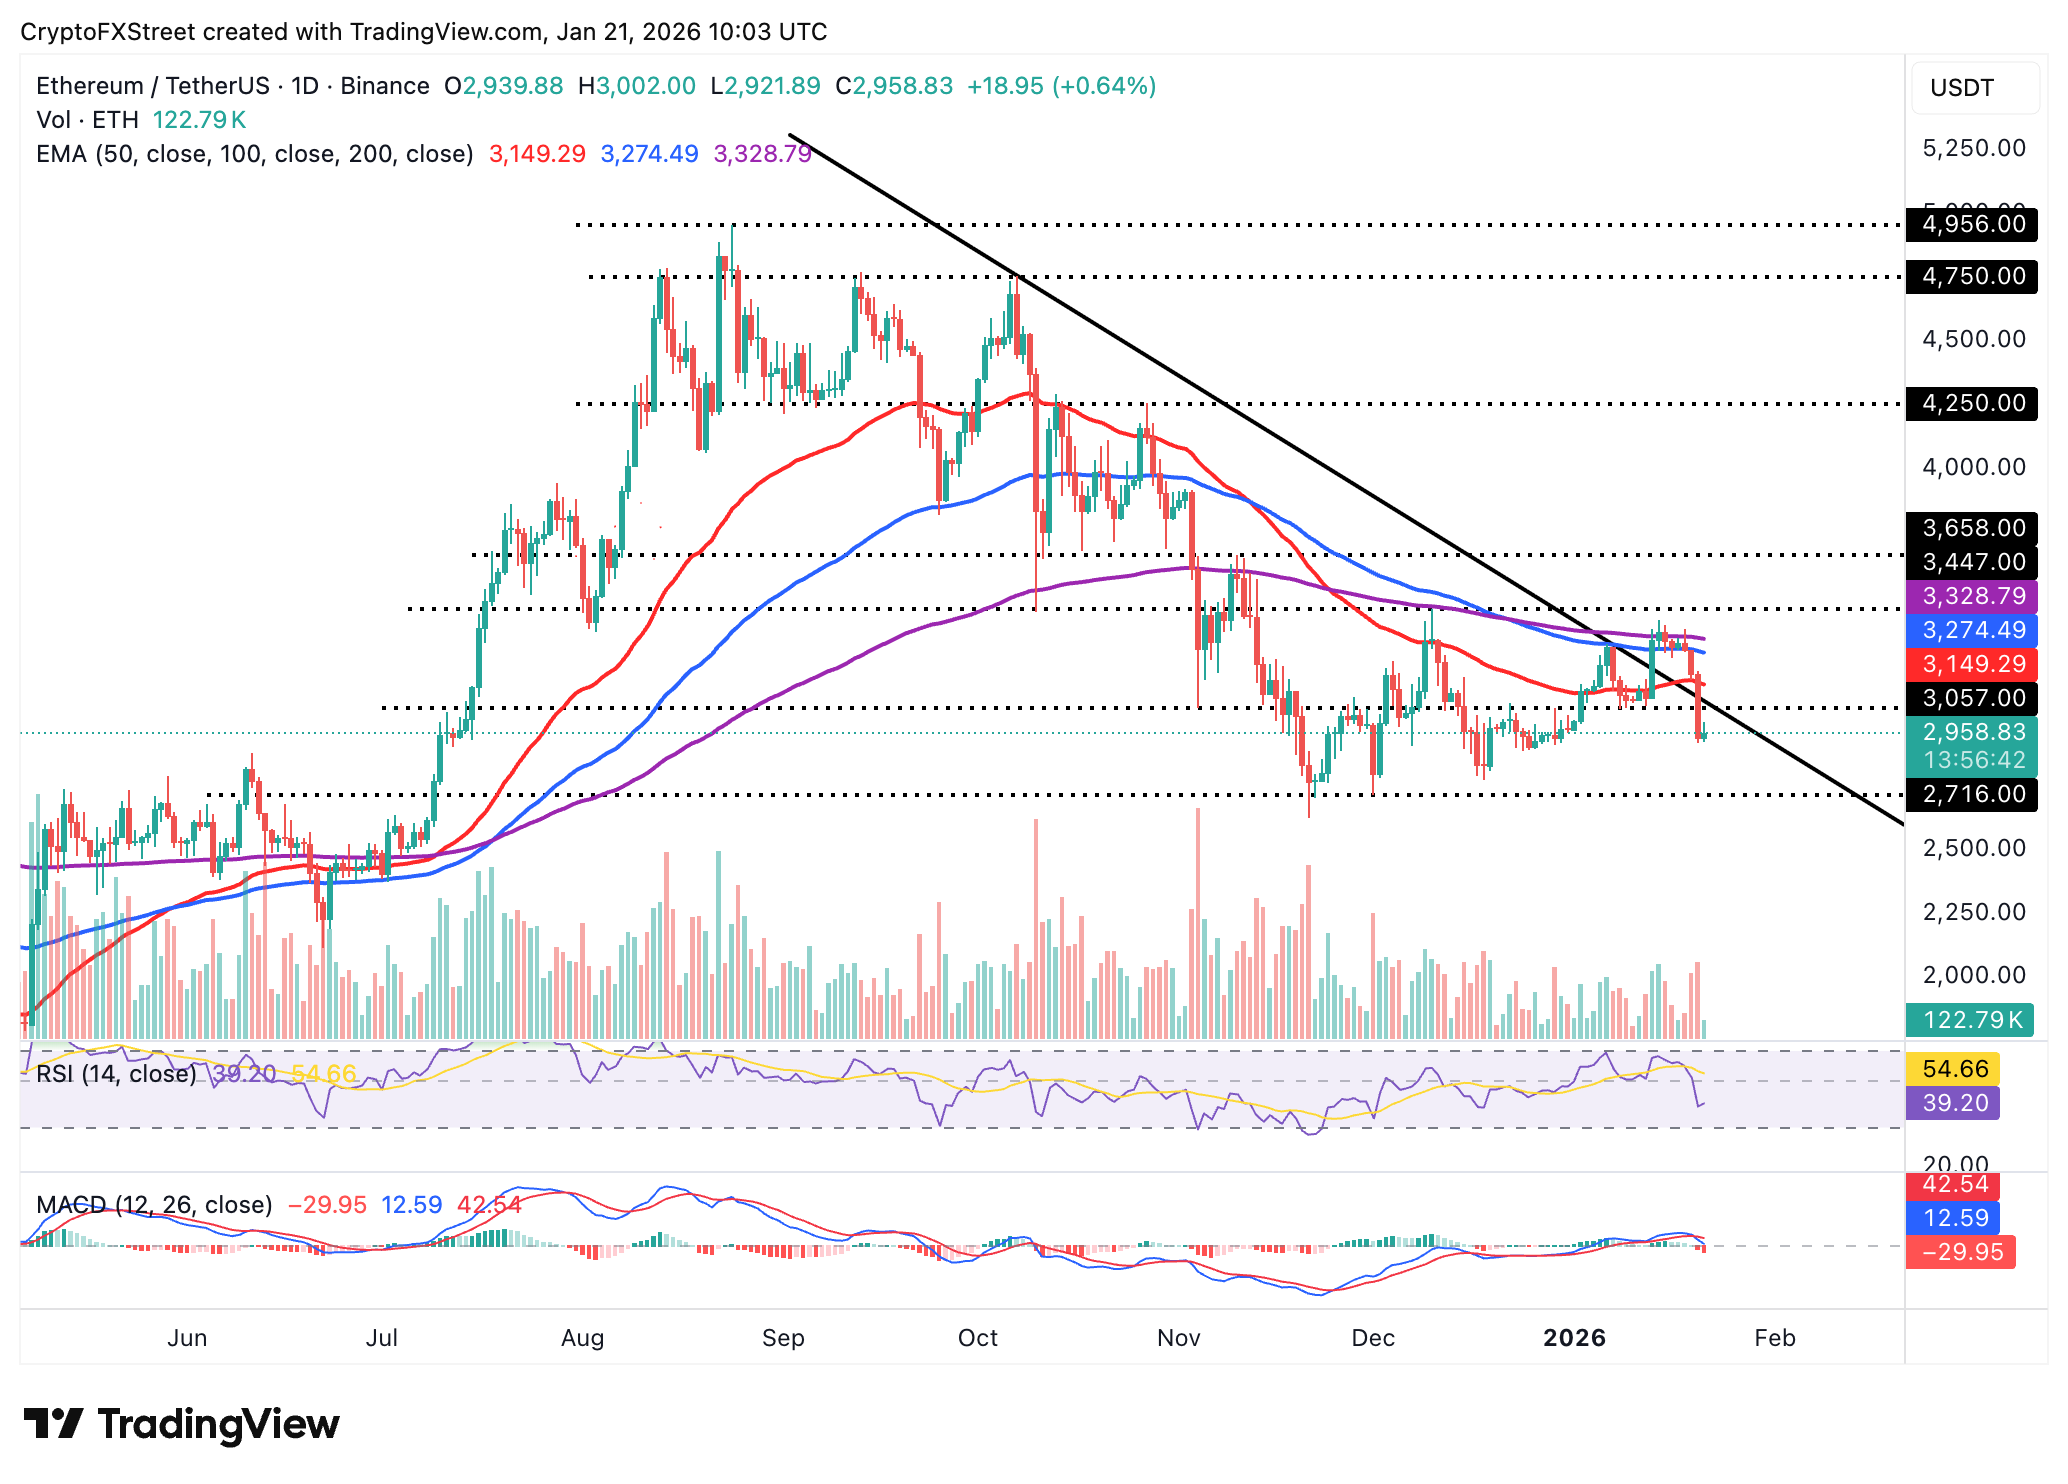
Altcoins technical outlook: Ethereum, XRP eye short-term rebound
Ethereum is holding in a range between $2,900 and $3,000 despite the overall trend being largely bearish. The RSI at 39 on the daily chart is dragging its recovery, suggesting that bears reains in control of the trend. Further movement toward the midline would signal a potential transition from bearish to bullish momentum.
The MACD indicator on the same daily chart remains below the signal line, which could prompt investors to reduce exposure and protect capital. The red histogram bars are expanding below the zero line, underpinning Ethereum’s short-term bearish outlook.
Looking forward, a break above $3,000 may accelerate the uptrend toward the 50-day Exponential Moving Average (EMA) at $3,149, the 100-day EMA at $3,274, and the 200-day EMA at $3,329. Still, Ethereum might extend its downtrend if the price closes below $2,900 and drops to test the December low at $2,716.
As for XRP, the price holds above the $1.90 support but remains below downward-trending moving averages, reinforcing a bearish bias. The 50-day EMA caps the upside at $2.06, the 100-day EMA at $2.18 and the 200-day EMA at $2.31.
The MACD indicator confirms the overall bearish outlook, as it remains below the signal line. Its red histogram bars are continuing to expand under the zero line, accentuating XRP’s downward potential. Extending the downtrend below $1.90 may trigger a sell-off to April’s low of $1.61.
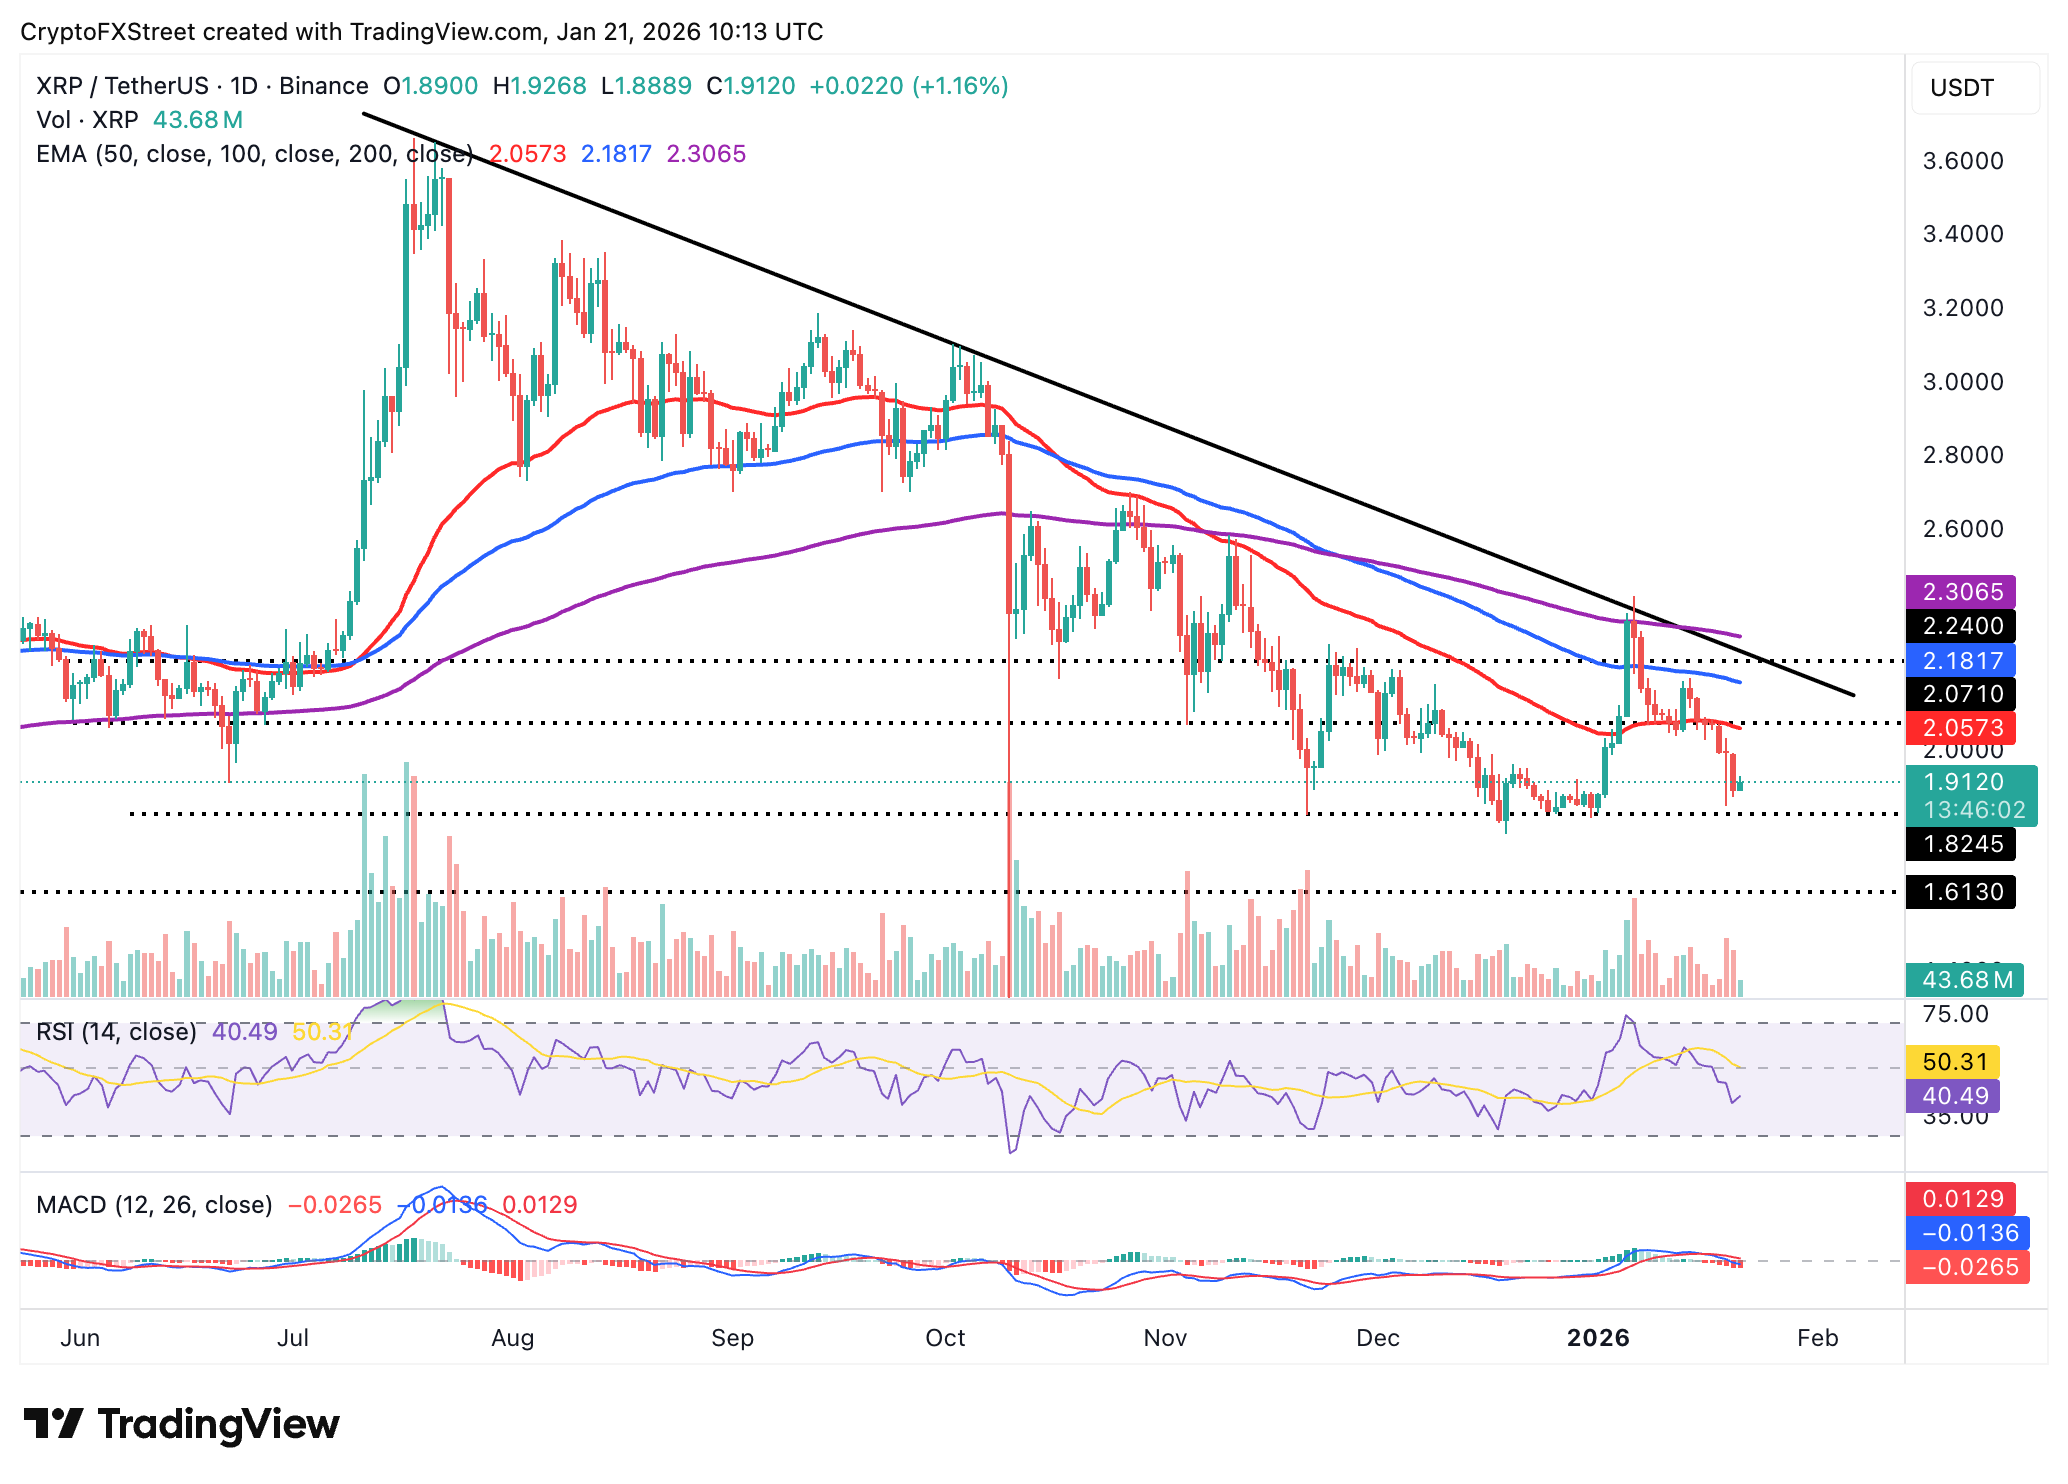
The RSI should extend recovery above the midline to influence the next bullish phase. Traders will watch for a close above the $2.00 hurdle before activating risk-on mode.
Crypto ETF FAQs
An Exchange-Traded Fund (ETF) is an investment vehicle or an index that tracks the price of an underlying asset. ETFs can not only track a single asset, but a group of assets and sectors. For example, a Bitcoin ETF tracks Bitcoin’s price. ETF is a tool used by investors to gain exposure to a certain asset.
Yes. The first Bitcoin futures ETF in the US was approved by the US Securities & Exchange Commission in October 2021. A total of seven Bitcoin futures ETFs have been approved, with more than 20 still waiting for the regulator’s permission. The SEC says that the cryptocurrency industry is new and subject to manipulation, which is why it has been delaying crypto-related futures ETFs for the last few years.
Yes. The SEC approved in January 2024 the listing and trading of several Bitcoin spot Exchange-Traded Funds, opening the door to institutional capital and mainstream investors to trade the main crypto currency. The decision was hailed by the industry as a game changer.
The main advantage of crypto ETFs is the possibility of gaining exposure to a cryptocurrency without ownership, reducing the risk and cost of holding the asset. Other pros are a lower learning curve and higher security for investors since ETFs take charge of securing the underlying asset holdings. As for the main drawbacks, the main one is that as an investor you can’t have direct ownership of the asset, or, as they say in crypto, “not your keys, not your coins.” Other disadvantages are higher costs associated with holding crypto since ETFs charge fees for active management. Finally, even though investing in ETFs reduces the risk of holding an asset, price swings in the underlying cryptocurrency are likely to be reflected in the investment vehicle too.
Bài viết đề xuất


