


Dogecoin Price Forecast: Bullish divergence, whale accumulation support recovery hopes
- Dogecoin trades at $0.070 on Tuesday with bullish momentum divergence, suggesting bearish momentum may be losing strength.
- Santiment data shows signs of accumulation among certain whale wallets, suggesting a bullish outlook.
- Derivatives metrics support a bullish bias with rising long bets and positive funding rates.
Dogecoin (DOGE) shows early signs of a potential recovery, trading near $0.070 at the time of writing on Tuesday as bullish momentum divergence suggests selling pressure may be fading. In addition, whale accumulation and improving derivatives metrics suggest a bullish outlook, hinting at a potential recovery ahead.
Whale wallets buy DOGE dips
Santiment’s Supply Distribution data shows that large-wallet holders (whales) are steadily buying DOGE, a move that supports the positive outlook for the token.
The metric indicates that 10 million and 100 million DOGE tokens (blue line) have accumulated a total of 180 million DOGE tokens, while 100,000 and 1 million (red line) have sold 10 million tokens since Saturday. This buy-the-dip scenario signals continued long-term interest among large-wallet holders and supports a potential recovery ahead.
 [09-1786423237168.09.26, 11 Aug, 2026].png)
Derivatives metrics show a bullish outlook
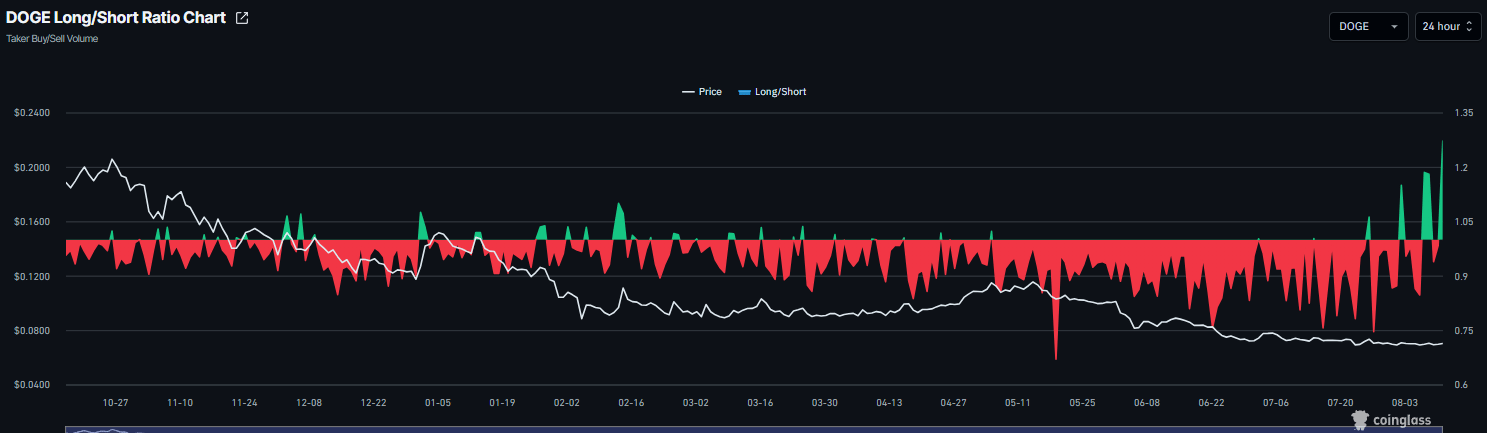
Derivatives data also shows bullish sentiment among Dogecoin traders. CoinGlass’ long-to-short ratio for memecoin reads 1.27 on Tuesday, the highest level over a month. A ratio above one indicates bullish sentiment, as traders are betting the asset price will rise.
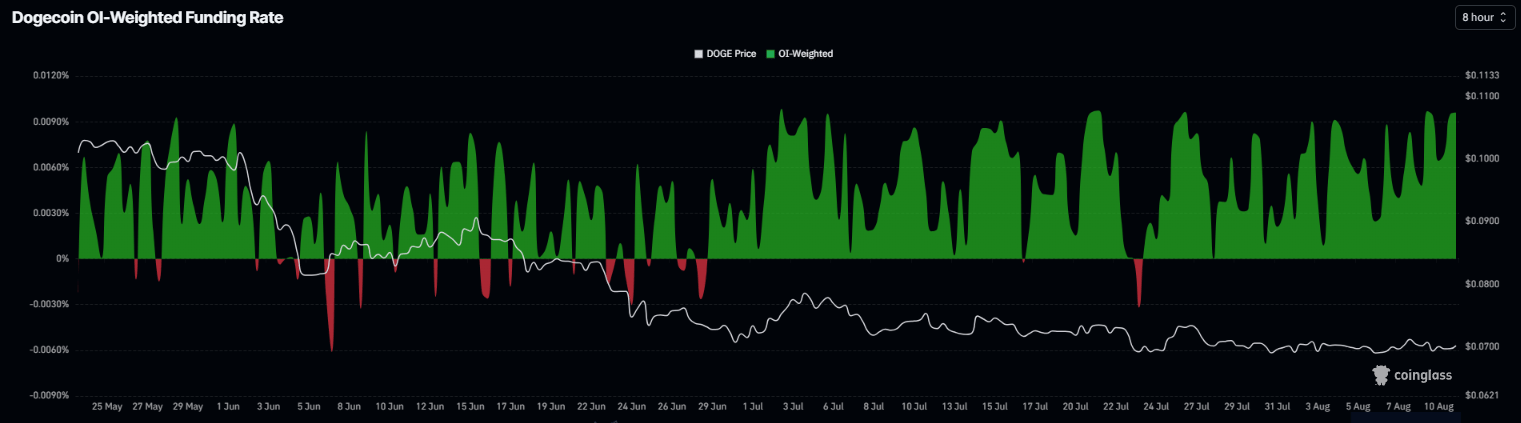
In addition, CoinGlass’ funding rates metric for Dogecoin flipped positive on July 24, steadily rising to 0.0096% on Tuesday. These positive rates indicate that long traders are paying shorts and reflect a bullish bias for the dog-themed meme coin.
Dogecoin technical outlook: Bullish divergence in play
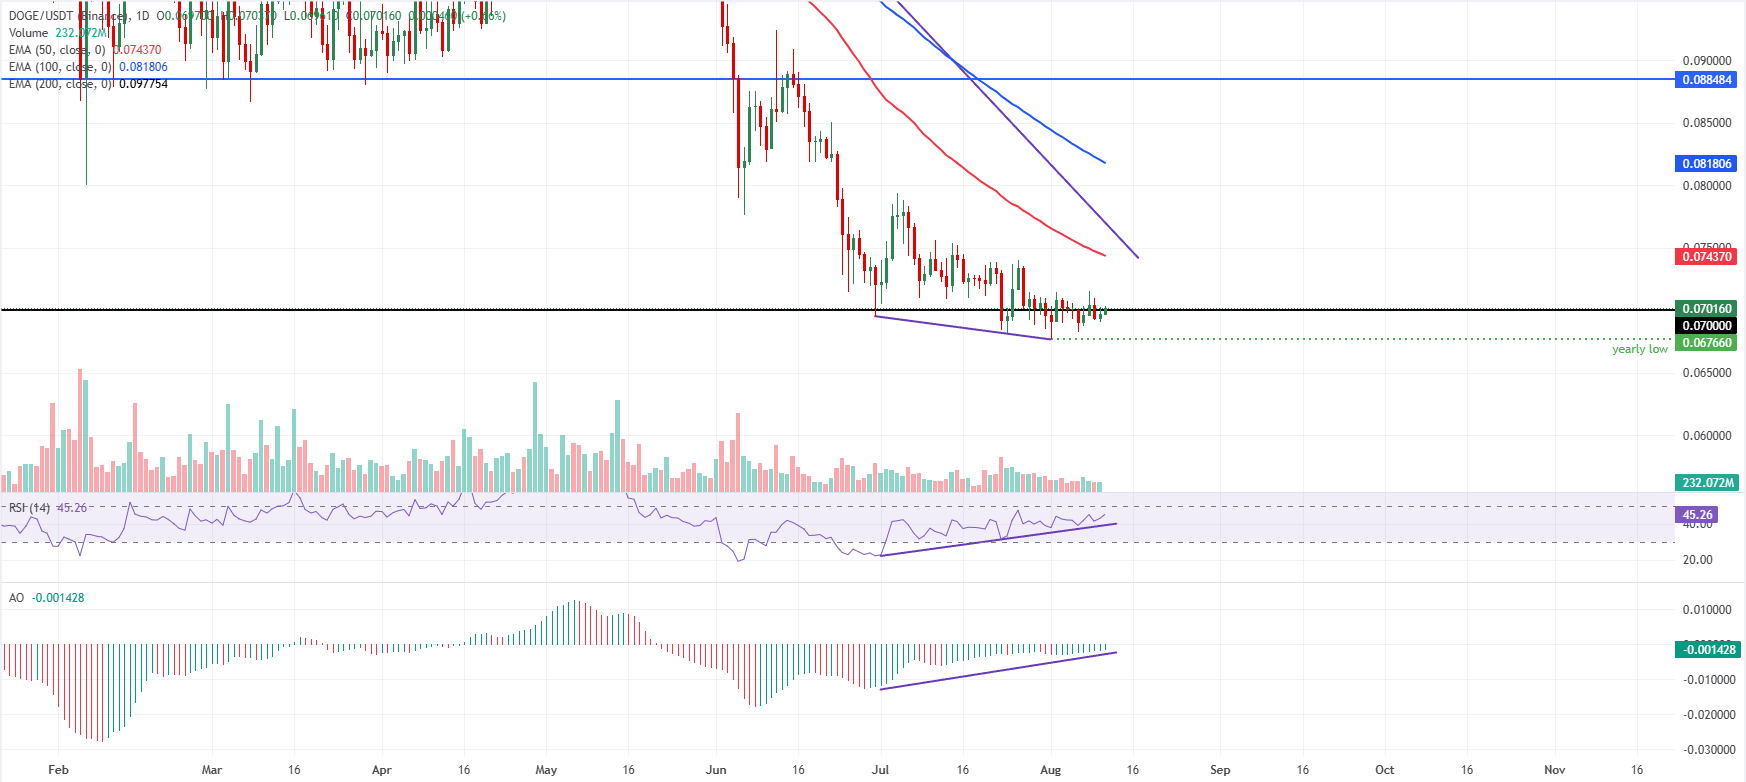
Dogecoin trades at $0.070 on Tuesday, extending its consolidation just above the psychological $0.0700 floor but well beneath all key Exponential Moving Averages (EMAs), keeping the near-term tone bearish. DOGE remains capped by the 50-day EMA at $0.074 and the 100-day EMA at $0.081, reinforcing a broader downside bias.
Momentum indicators show a bullish divergence in the Relative Strength Index (RSI) on the daily chart, as DOGE price formed a lower low on August 1 while the RSI registered a higher low, suggesting that bearish momentum is weakening. The Awesome Oscillator (AO) supports this divergence as its recent lows are rising while price remains near its lows, indicating that downside momentum is fading.
On the topside, initial resistance emerges at the 50-day EMA around $0.074, followed by the downward trendline break level near $0.076, where any recovery would likely face renewed supply. Above that, the 100-day EMA at $0.081 and horizontal barrier at $0.088 form a wider cap that DOGE must clear to signal a more durable bullish reversal.
On the downside, immediate support is seen at the horizontal line around $0.070, with next support at the yearly low at $0.067; a close below it suggests deeper losses toward the key psychological level of $0.065.
(The technical analysis of this story was written with the help of an AI tool. Know more.)
Bài viết đề xuất


