

Solana Price Forecast: Warning signs emerge as SOL's long-term trendline comes under pressure

Nguồn Fxstreet
  • Solana trades below $90 on Friday, testing a long-term support trendline after over 6% losses the previous day.
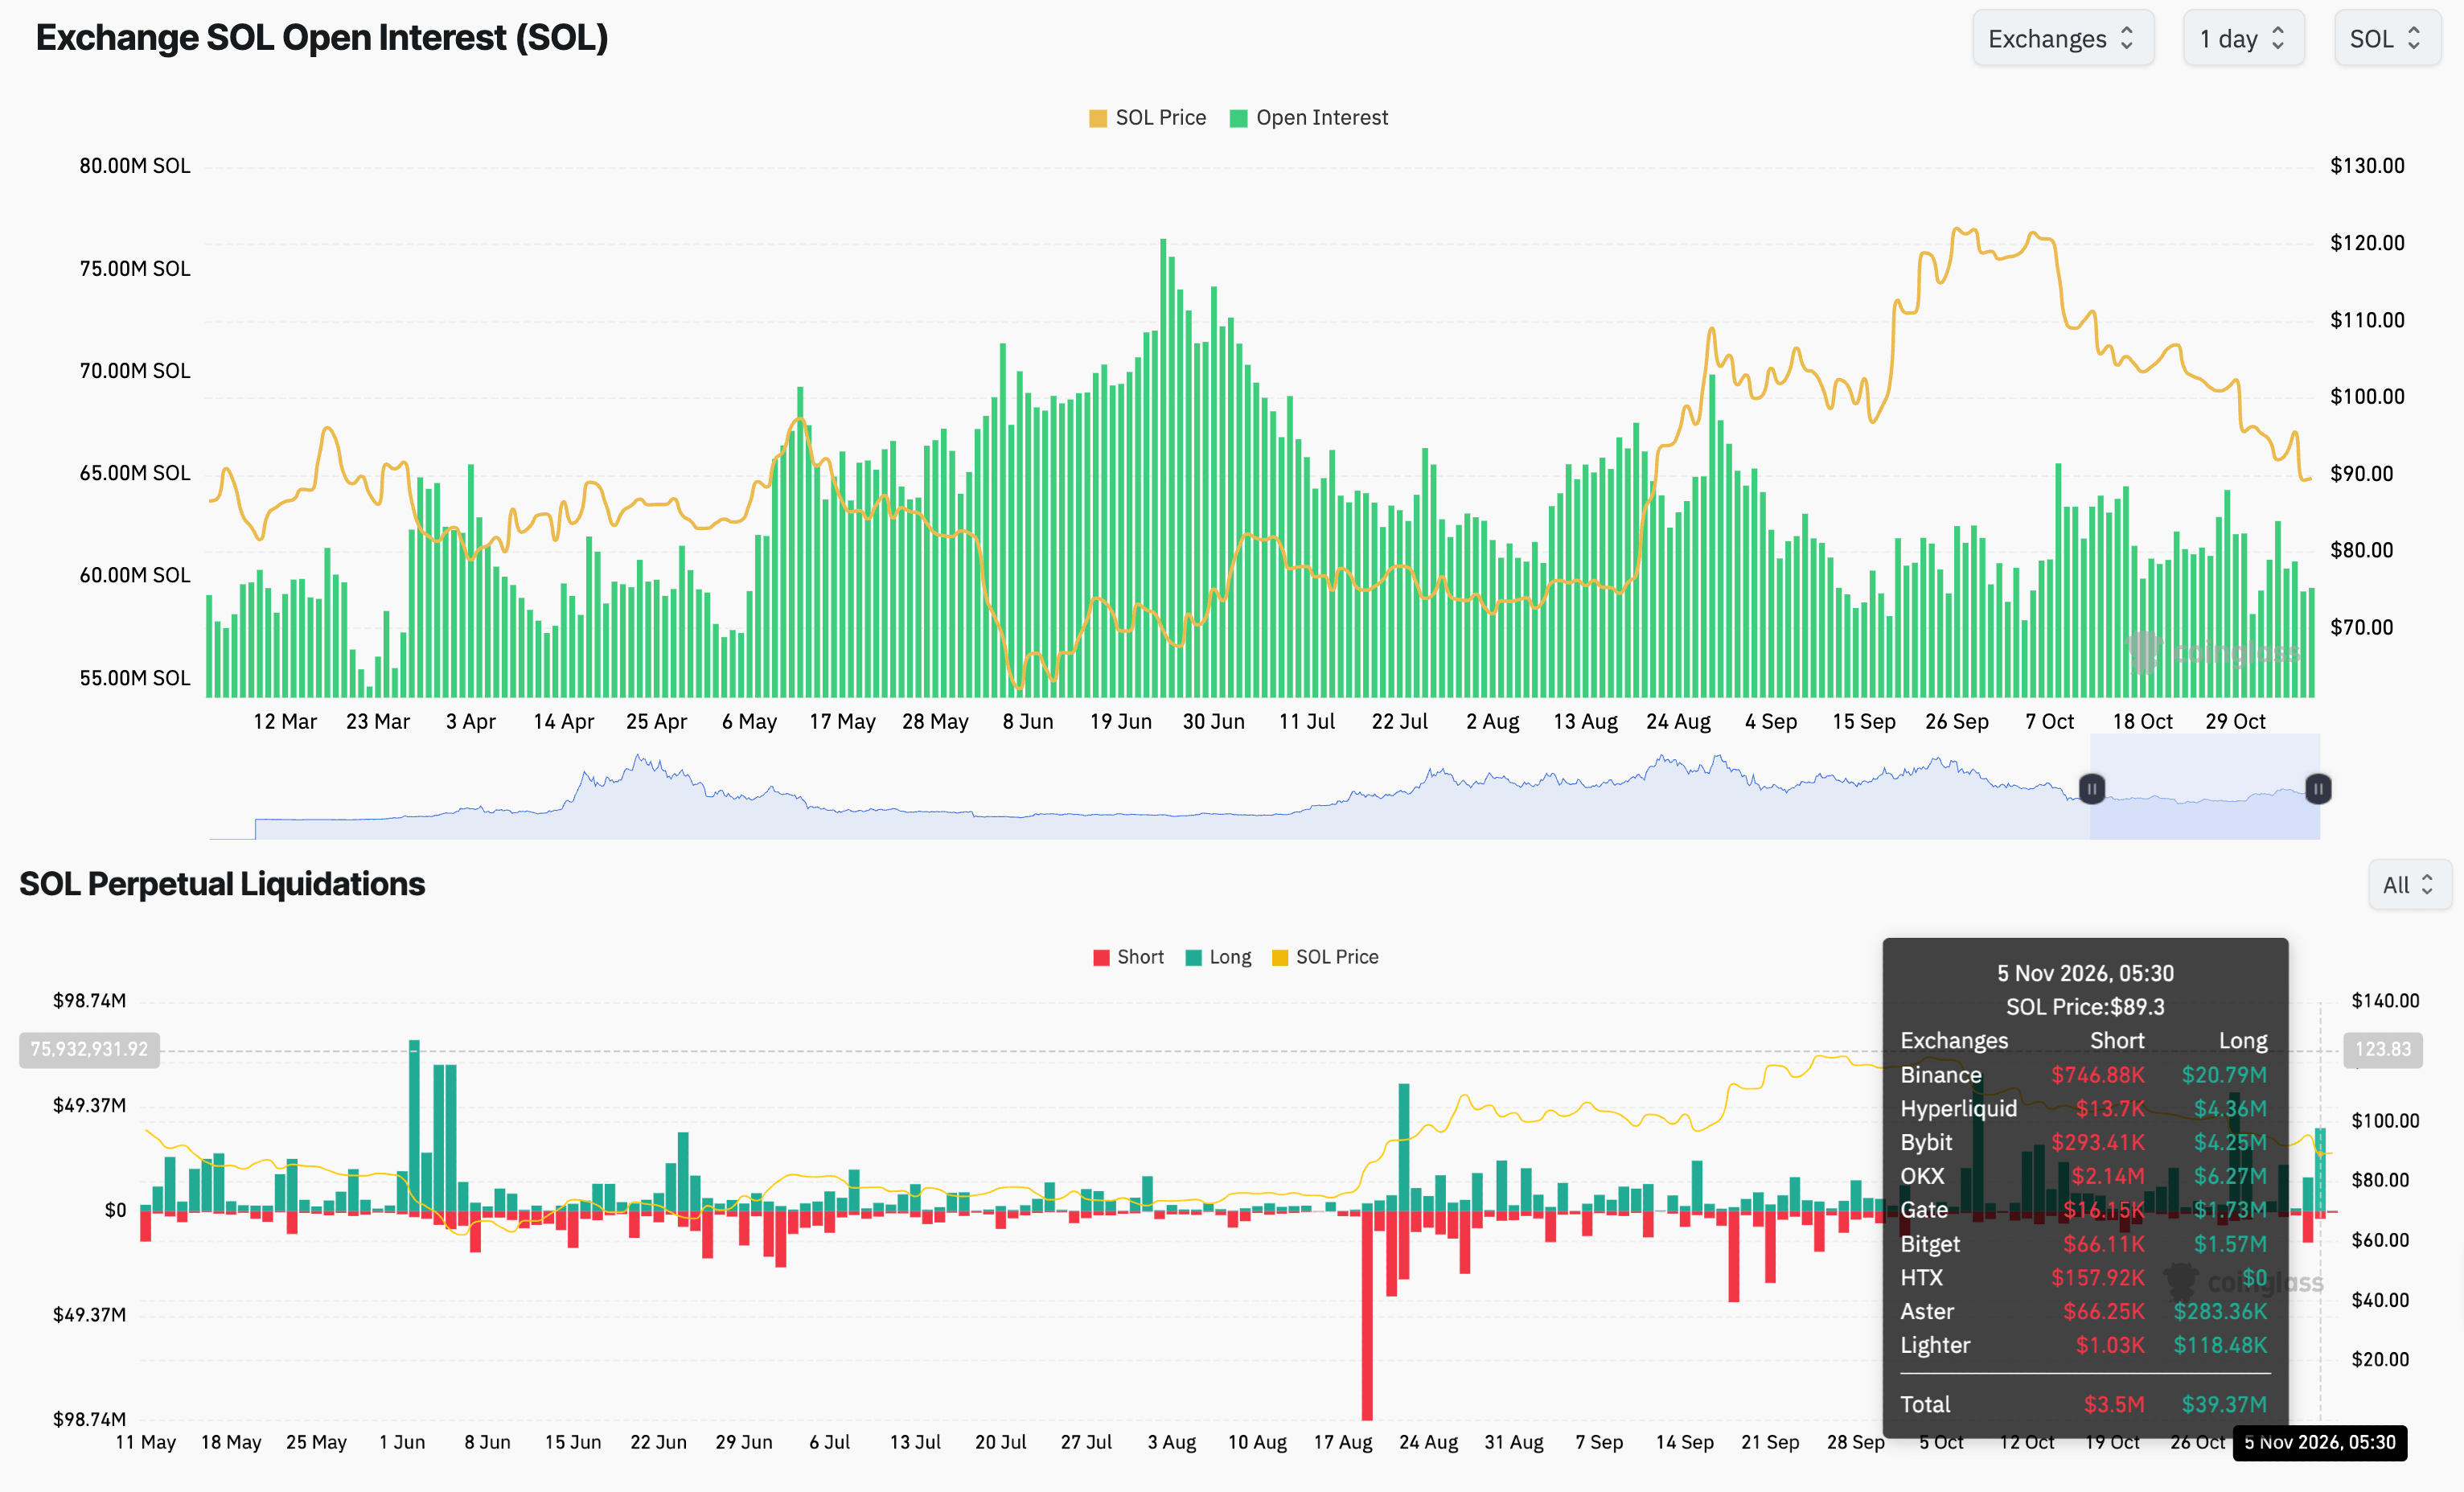
  • Declining SOL futures Open Interest amid roughly $40 million liquidation on Thursday suggests a sell-side dominance.
  • SOL ETFs face persistent selling pressure, with $1.18 million in withdrawals on Thursday, after last week’s largest weekly outflow of $71.47 million.

Solana (SOL) trades at a two-month low below $90.00 on Friday, following over 6% losses the previous day as the broader cryptocurrency market hit over $1 billion in liquidations. Derivatives data show declining appeal for Solana among traders as Open Interest sinks while institutional investors withdrew $1.18 million from SOL-focused Exchange Traded Funds (ETFs), extending last week’s largest outflow of $71.47 million. 

Technically, Solana could extend its decline toward the $70.00 round figure if the price slips below the $87.21 horizontal support.

Solana loses retail and institutional appeal

Institutional and retail investors’ risk appetite for Solana takes a hit as the broader cryptocurrency market sentiment declines amid macroeconomic uncertainty. Democrats sweeping the US midterms amid the ongoing AI debt crises fuels risk-off sentiment. 

SOL-focused ETFs recorded $1.18 million in outflows on Thursday after three consecutive days of silence, suggesting that the institutional investors took a breather after last week’s $71.47 million withdrawals, marking the largest and fourth straight week of outflows.

On the retail side, CoinGlass data shows that SOL futures Open Interest (OI) is at 59.45 million SOL, down from 62.71 million on Monday, indicating an unwinding of positions so far this week. Total liquidation of $42.87 million on Thursday, led by $39.37 million in long liquidation, indicates that the buy-side positions were the majority as sellers regained dominance.

Solana’s fading appeal, with ETF outflows and declining OI, could further deepen the downside risk.
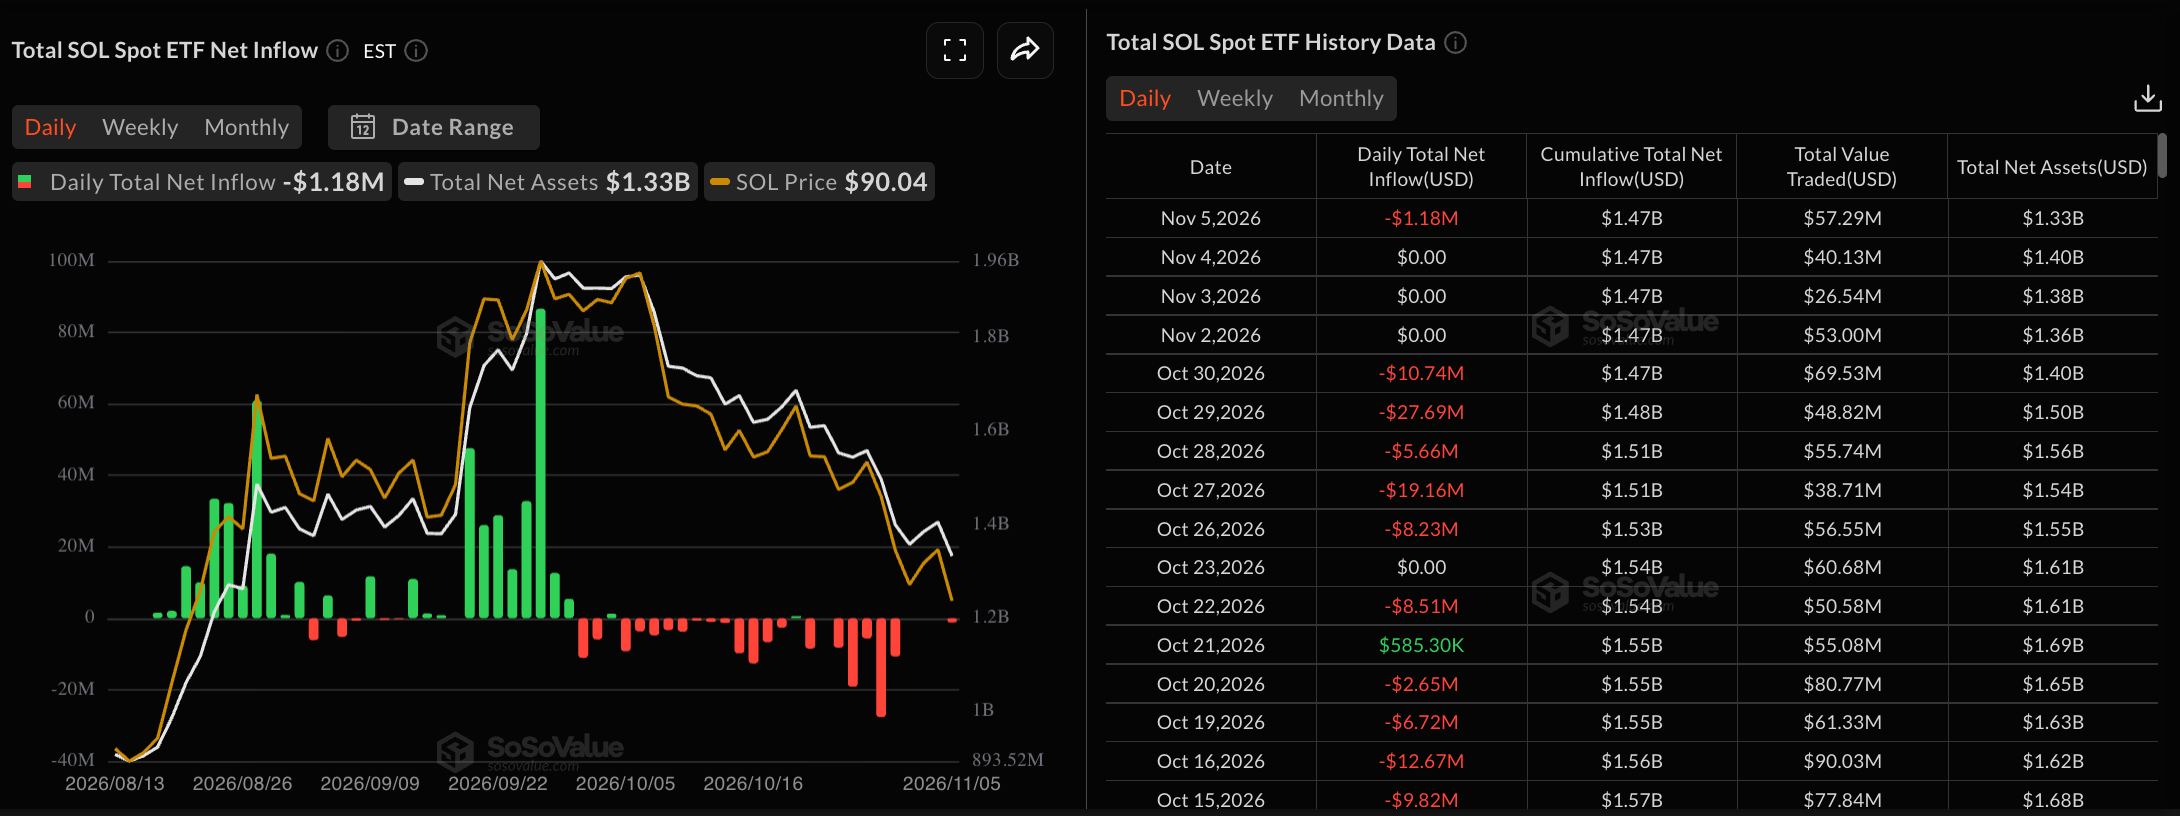
SOL ETFs data. Source: Sosovalue
Solana derivatives data. Source: CoinGlass

Technical outlook: Will Solana drop to $70?

Solana trades at $89.65 at press time on Friday, extending its sixth consecutive week of decline. SOL maintains a bearish near-term bias below the 200-day Exponential Moving Average (EMA) at $99.62, while the declining 50-day EMA at $101.92 risks crossing below the 200-day EMA, potentially signaling a Death Cross.

From a technical perspective, SOL tests a long-term rising support trendline, connecting the lows of June 6 and 25, around $89.83. A confirmed breakout below this support could threaten the $87.21 horizontal support, leading to a steeper correction toward the $70.58 floor, last tested on August 1.

Momentum on the daily charts shows a bearish bias, with the Relative Strength Index (RSI) at 29, hovering near oversold territory, and the declining Moving Average Convergence Divergence (MACD) below its signal line in negative territory.

Chart Analysis SOL/USDT (Binance)
SOL/USDT daily price chart.

On the topside, a potential rebound from the support trendline could test the 200-day EMA at $99.62, followed by the 50-day EMA at $101.92.

(The technical analysis of this story was written with the help of an AI tool. Know more.)

Tuyên bố miễn trừ trách nhiệm: Chỉ dành cho mục đích thông tin. Hiệu suất trong quá khứ không đảm bảo cho kết quả trong tương lai.
placeholder
Nhìn lại lịch sử giá vàng trong 50 năm qua. Liệu vàng còn tiếp tục thời kỳ hoàng kim thêm 50 năm nữa? Trong 50 năm qua, vàng vẫn luôn giữ được vị thế là tài sản được ưa chuộng và phổ biến nhất thế giới. Giao dịch vàng luôn được các nhà đầu tư quan tâm do mức độ thanh khoản cao và tầm ảnh hưởng lớn đến toàn bộ thị trường tài chính. Vậy, lịch sử giá vàng như thế nào và cách đầu tư vàng ra sao? Chúng ta sẽ cùng tìm hiểu qua bài viết dưới đây.
Tác giả  Nhóm Traderins
ngày11 tháng 12 năm 2023
Trong 50 năm qua, vàng vẫn luôn giữ được vị thế là tài sản được ưa chuộng và phổ biến nhất thế giới. Giao dịch vàng luôn được các nhà đầu tư quan tâm do mức độ thanh khoản cao và tầm ảnh hưởng lớn đến toàn bộ thị trường tài chính. Vậy, lịch sử giá vàng như thế nào và cách đầu tư vàng ra sao? Chúng ta sẽ cùng tìm hiểu qua bài viết dưới đây.
placeholder
WTI đạt mức tăng khiêm tốn trên mức 88,50$ nhờ mức giảm bất ngờ của EIA, xung đột ở Trung Đông được chú ýWest Texas Intermediate (WTI), chuẩn dầu thô của Mỹ, đang giao dịch quanh mức 88,55$ trong đầu phiên giao dịch châu Á vào thứ Năm. WTI ghi nhận mức tăng khiêm tốn khi tồn kho dầu thô Mỹ bất ngờ giảm vào tuần trước
Tác giả  FXStreet
10 tháng 08 ngày Thứ Năm
West Texas Intermediate (WTI), chuẩn dầu thô của Mỹ, đang giao dịch quanh mức 88,55$ trong đầu phiên giao dịch châu Á vào thứ Năm. WTI ghi nhận mức tăng khiêm tốn khi tồn kho dầu thô Mỹ bất ngờ giảm vào tuần trước
placeholder
Vàng tăng lên gần 3.950$ khi các nhà giao dịch chuẩn bị cho cuộc bầu cử giữa nhiệm kỳ của MỹGiá vàng (XAU/USD) tăng lên quanh mức 3.950$ trong phiên giao dịch đầu ngày thứ Ba ở châu Á. Kim loại quý này phục hồi khi giá dầu giảm đã làm dịu bớt lo ngại về lạm phát. Các nhà giao dịch sẽ theo dõi chặt chẽ cuộc bầu cử giữa kỳ của Mỹ vào cuối tuần này.
Tác giả  FXStreet
11 tháng 03 ngày Thứ Ba
Giá vàng (XAU/USD) tăng lên quanh mức 3.950$ trong phiên giao dịch đầu ngày thứ Ba ở châu Á. Kim loại quý này phục hồi khi giá dầu giảm đã làm dịu bớt lo ngại về lạm phát. Các nhà giao dịch sẽ theo dõi chặt chẽ cuộc bầu cử giữa kỳ của Mỹ vào cuối tuần này.
placeholder
Tin nóng: Đồng đô la Mỹ giảm xuống dưới 101,50 khi kết quả bầu cử giữa kỳ ban đầu cho thấy đảng Dân chủ giành thêm ghếChỉ số đô la Mỹ (DXY) đối mặt với một số áp lực bán gần 101,25 trong phiên châu Á đầu ngày thứ Tư. Các nhà giao dịch sẽ theo dõi chặt chẽ kết quả bầu cử giữa kỳ của Mỹ vào cuối ngày để tìm động lực mới.
Tác giả  FXStreet
11 tháng 04 ngày Thứ Tư
Chỉ số đô la Mỹ (DXY) đối mặt với một số áp lực bán gần 101,25 trong phiên châu Á đầu ngày thứ Tư. Các nhà giao dịch sẽ theo dõi chặt chẽ kết quả bầu cử giữa kỳ của Mỹ vào cuối ngày để tìm động lực mới.
placeholder
Bản tin thị trường hàng ngày TradingKey: Nasdaq giảm hơn 5%, cổ phiếu AI lao dốc khi Nvidia giảm hơn 9%, Micron giảm hơn 17%, SanDisk giảm hơn 22%Trong phiên giao dịch châu Á ngày 6/11, cả ba chỉ số chứng khoán chính của Mỹ đồng loạt lao dốc trong đêm qua khi làn sóng bán tháo trên chuỗi cung ứng trung t
Tác giả  TradingKey
4 giờ trước
Trong phiên giao dịch châu Á ngày 6/11, cả ba chỉ số chứng khoán chính của Mỹ đồng loạt lao dốc trong đêm qua khi làn sóng bán tháo trên chuỗi cung ứng trung t
sản phẩm liên quan
goTop
quote