

Dogecoin Price Forecast: Rebound gains traction as bulls target key resistance trendline

Nguồn Fxstreet
  • Dogecoin holds steady above $0.0770 on Thursday, after a rebound of over 2% the previous day.
  • Declining DOGE Open Interest suggests reduced leveraged activity while institutional investors go silent for the third week.
  • The technical outlook for DOGE suggests a potential bullish breakout of a key resistance trendline on the four-hour chart.

Dogecoin (DOGE) shows signs of recovery, hovering above $0.0770 on Thursday after two consecutive days of gains. The meme coin gains traction despite muted appeal from institutional investors and declining Open Interest. The technical outlook for DOGE suggests an upside bias as the recovery gains traction, hinting at a potential bullish breakout of a key resistance trendline on the four-hour chart.

The appeal for DOGE is fading

Meme coins often lose their appeal among investors at the slightest hint of headwinds. Dogecoin, the original meme coin, faces similar challenges, with institutional and leverage-taking investors waiting on the sidelines. 

CoinGlass data shows that DOGE futures Open Interest (OI) is down to 13.62 billion DOGE from 14.52 billion on Monday, despite the rising spot price. This suggests positional unwinding as the traders are unwilling to take risks in DOGE. 
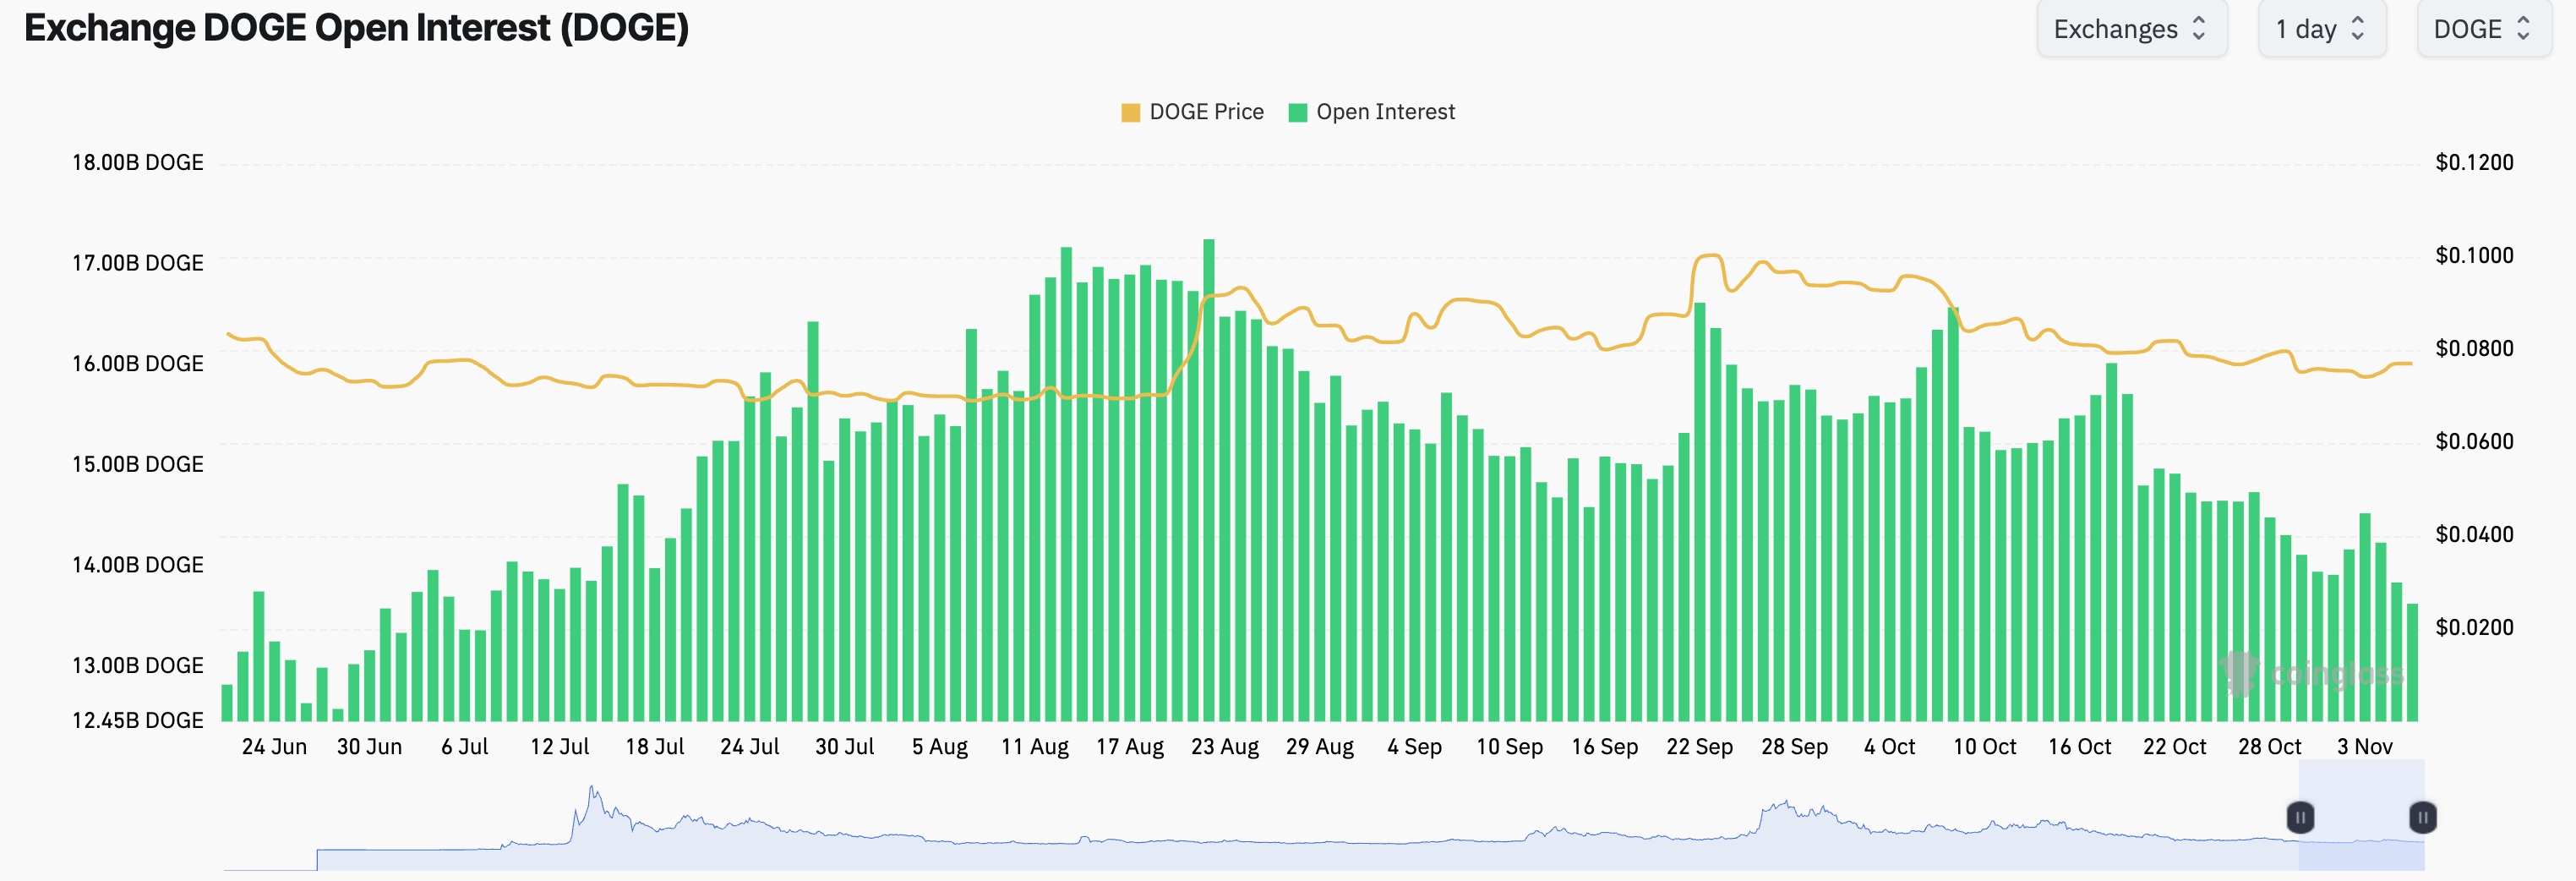
DOGE Open Interest chart. Source: CoinGlass

On the other hand, Dogecoin Exchange-Traded Funds (ETFs) have recorded zero inflows since October 14, stepping into their third muted week. This silence mirrors the similar subdued risk appetite from the derivatives market, despite the near-term recovery.
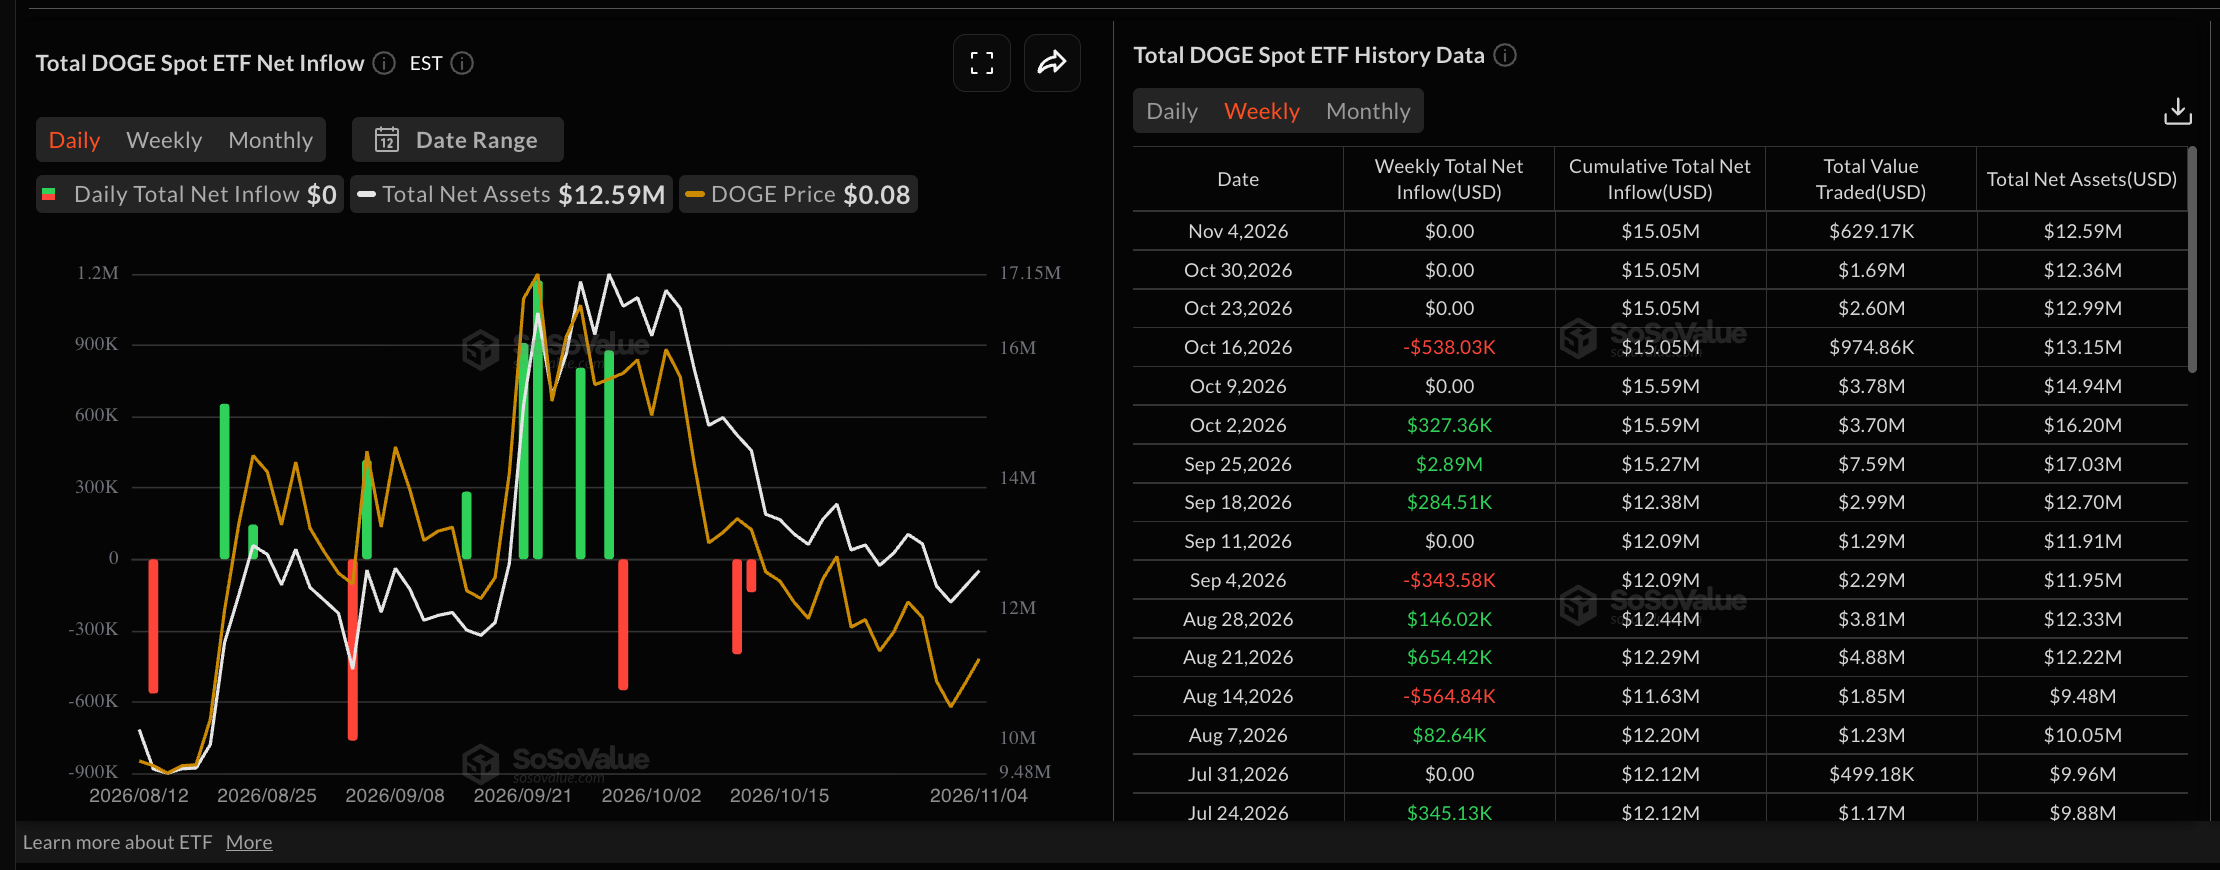
DOGE ETF data. Source: Sosovalue

However, if the ongoing recovery in DOGE holds steady, it could attract derivatives traders, followed by institutional investors as the broader crypto market sentiment recovers after Democrats swept the US midterm elections.

Technical outlook: Bullish rebound in DOGE flags breakout chances

Dogecoin trades near $0.0772 at press time on Thursday, sustaining its over 2% rebound from the previous day.

DOGE reclaims the 50-period Exponential Moving Average (EMA) at $0.0762 on the four-hour chart but remains capped below a long-term resistance trendline connecting the October 8 and 29 highs, near $0.0786. A confirmed breakout above $0.0786 could target the 200-period EMA, clustered with horizontal resistance, at $0.0806.

Momentum on the four-hour chart remains constructive, as the Relative Strength Index (RSI) hovers near 58 while the Moving Average Convergence Divergence (MACD) line remains marginally positive.

Chart Analysis DOGE/USDT (Binance)
DOGE/USDT four-hour price chart.

On the downside, initial support is provided by the 50-period EMA at $0.0762. A sustained break below this floor would expose the horizontal base at $0.0723, with a deeper bearish extension potentially targeting the lower support zone near $0.0677.

(The technical analysis of this story was written with the help of an AI tool. Know more.)

Tuyên bố miễn trừ trách nhiệm: Chỉ dành cho mục đích thông tin. Hiệu suất trong quá khứ không đảm bảo cho kết quả trong tương lai.
placeholder
WTI đạt mức tăng khiêm tốn trên mức 88,50$ nhờ mức giảm bất ngờ của EIA, xung đột ở Trung Đông được chú ýWest Texas Intermediate (WTI), chuẩn dầu thô của Mỹ, đang giao dịch quanh mức 88,55$ trong đầu phiên giao dịch châu Á vào thứ Năm. WTI ghi nhận mức tăng khiêm tốn khi tồn kho dầu thô Mỹ bất ngờ giảm vào tuần trước
Tác giả  FXStreet
10 tháng 08 ngày Thứ Năm
West Texas Intermediate (WTI), chuẩn dầu thô của Mỹ, đang giao dịch quanh mức 88,55$ trong đầu phiên giao dịch châu Á vào thứ Năm. WTI ghi nhận mức tăng khiêm tốn khi tồn kho dầu thô Mỹ bất ngờ giảm vào tuần trước
placeholder
Yên Nhật tăng lên mức cao nhất trong một tuần khi lợi suất trái phiếu Mỹ giảm gây áp lực lên USDCặp USD/JPY kéo dài đà giảm do bị từ chối của ngày hôm trước từ khu vực 159,00, hay đỉnh ba tuần, thu hút một số lực bán tiếp diễn trong phiên giao dịch châu Á vào thứ Năm.
Tác giả  FXStreet
10 tháng 15 ngày Thứ Năm
Cặp USD/JPY kéo dài đà giảm do bị từ chối của ngày hôm trước từ khu vực 159,00, hay đỉnh ba tuần, thu hút một số lực bán tiếp diễn trong phiên giao dịch châu Á vào thứ Năm.
placeholder
Strategy tạm dừng mua thêm, chấm dứt chuỗi 5 tuần mua liên tiếp; Bitcoin giảm xuống dưới 80.000 USD khi thị trường chờ đợi quyết định của Fed Tính đến phiên giao dịch châu Âu ngày 27 tháng 10, Bitcoin (BTC) đã giảm xuống dưới mốc 80.000 USD, với giá giao dịch mới nhất quanh mức 79.900 USD. Trong khi đó, công ty nắm giữ Bitcoin
Tác giả  TradingKey
10 tháng 27 ngày Thứ Ba
Tính đến phiên giao dịch châu Âu ngày 27 tháng 10, Bitcoin (BTC) đã giảm xuống dưới mốc 80.000 USD, với giá giao dịch mới nhất quanh mức 79.900 USD. Trong khi đó, công ty nắm giữ Bitcoin
placeholder
Đảng Dân chủ thắng bầu cử giữa kỳ, đẩy giá vàng tăng hơn 100 USD trong phiên, vượt trở lại mốc 4.000 USDNgày 4 tháng 11, giá vàng (XAUUSD) đã tăng mạnh trong phiên giao dịch châu Á. Do Đảng Dân chủ giành chiến thắng trong cuộc bầu cử giữa kỳ tại Mỹ, Chỉ số USD và lợi suất trái phiếu kho bạc
Tác giả  TradingKey
20 giờ trước
Ngày 4 tháng 11, giá vàng (XAUUSD) đã tăng mạnh trong phiên giao dịch châu Á. Do Đảng Dân chủ giành chiến thắng trong cuộc bầu cử giữa kỳ tại Mỹ, Chỉ số USD và lợi suất trái phiếu kho bạc
placeholder
WTI chật vật dưới mức 87,50$ khi Đảng Dân chủ tìm cách chấm dứt cuộc chiến với Iran sau chiến thắng áp đảo trong cuộc bầu cử giữa nhiệm kỳWest Texas Intermediate (WTI) – giá dầu thô Mỹ chuẩn – vẫn chịu áp lực trong ngày thứ hai liên tiếp vào thứ Năm, giao dịch ngay dưới vùng giữa 87,00$ trong phiên giao dịch châu Á và gần mức thấp nhất trong gần một tháng đã chạm vào ngày hôm trước
Tác giả  FXStreet
2 giờ trước
West Texas Intermediate (WTI) – giá dầu thô Mỹ chuẩn – vẫn chịu áp lực trong ngày thứ hai liên tiếp vào thứ Năm, giao dịch ngay dưới vùng giữa 87,00$ trong phiên giao dịch châu Á và gần mức thấp nhất trong gần một tháng đã chạm vào ngày hôm trước
sản phẩm liên quan
goTop
quote