


Crypto Today: Bitcoin, Ethereum and XRP fall liquidating $550M
- Bitcoin extends its correction for the third consecutive day and trades near $84,000 amid $550 million in broader crypto market liquidations.
- Ethereum faces increasing selling pressure as momentum indicators point to further downside.
- XRP shows signs that the pullback may continue toward the 50-day EMA support.
The cryptocurrency market is experiencing ongoing liquidation, with Bitcoin (BTC) losing ground to trade near $84,000 at the time of writing on Wednesday. The Crypto King’s correction follows a recent rejection due to supply around $87,200.
Altcoins are generally in a correction trend, as Ethereum (ETH) edges lower toward the next key support at $2,600 and Ripple (XRP) extends its down leg near the $1.45 demand area, where buyers will likely consider reengaging.
Crypto liquidations surge
Bitcoin’s sharp sell-off resulted in a $2,000 drop in less than an hour earlier on Friday, triggering $550 million in liquidations across the crypto market. Long position traders lost $480 million, while $69 million in short positions was liquidated, according to CoinGlass.
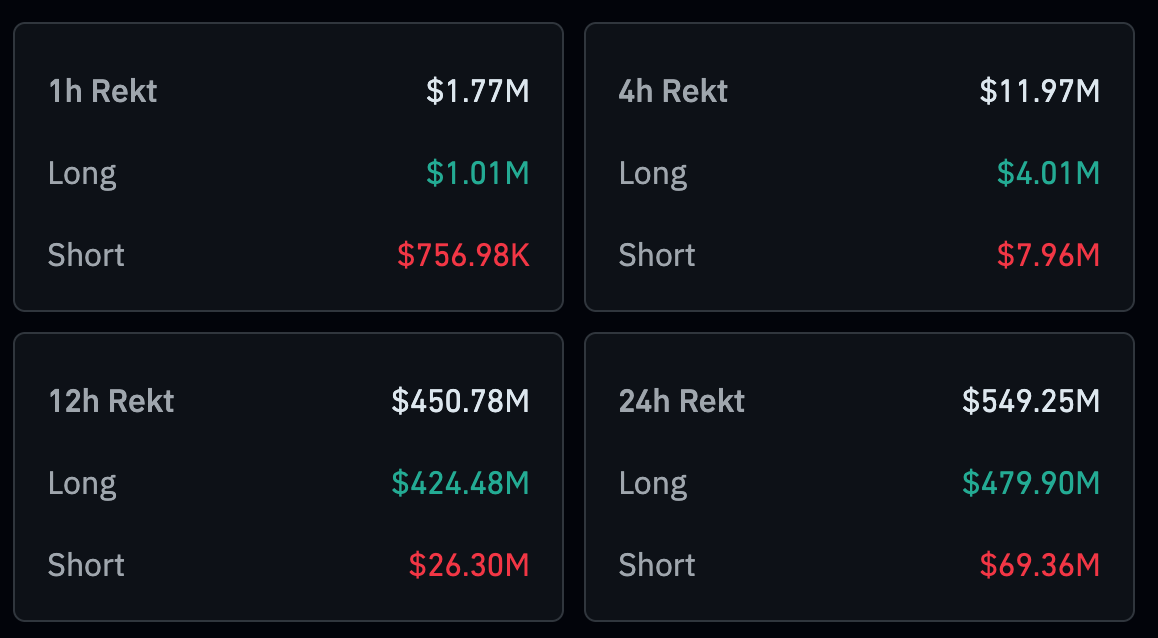
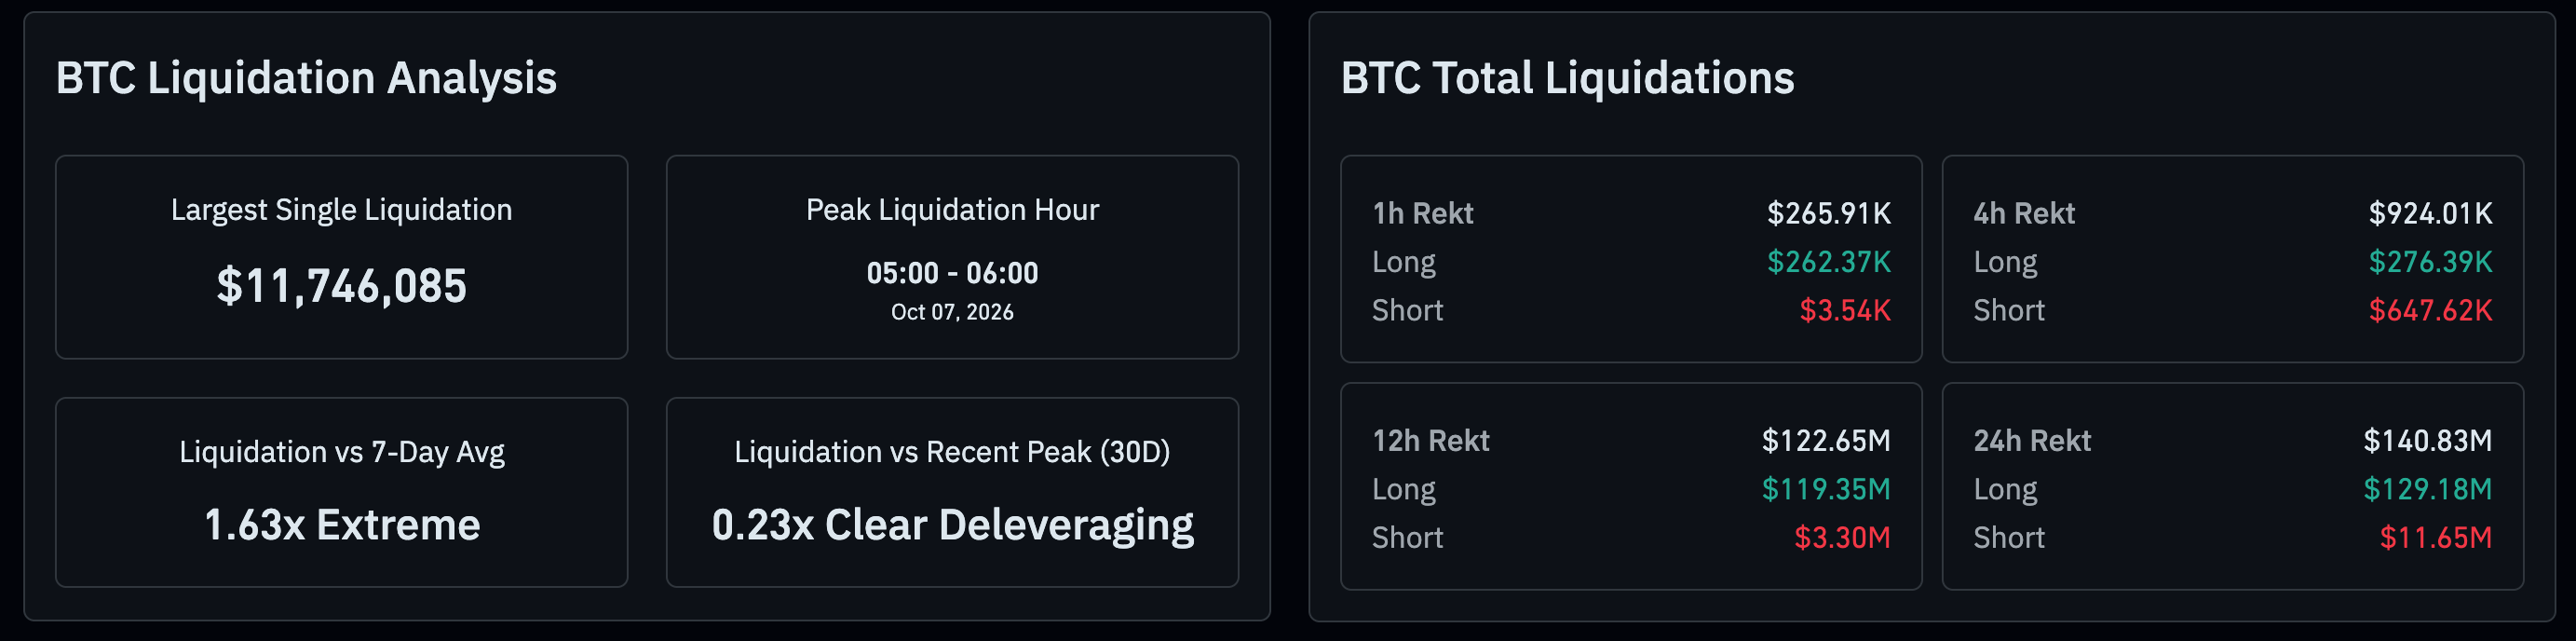
As for Bitcoin, traders cumulatively lost $140 million in 24-hour liquidations split between $129 million in long positions and roughly $12 million in short positions. Despite the liquidation and sharp sell-off to $84,000, K33 Research analysts believe the bullish picture is still intact.
“Bitcoin is still 32% below its all-time high from a year ago, with 5.2 million BTC (a quarter of supply) at a loss,” K33 Research analysts said in the weekly report, adding, “Since August 6, BTC has rallied from $64,000 to $85,000 and supply at a loss has fallen by 3.9 million BTC, the sharpest two-month drop since late 2024. Net realized P/L has turned positive after a year of losses, and that profit-taking has fed the consolidation.”
Technical analysis: Bitcoin corrects as headwinds persist
Bitcoin trades at $84,055 after extending its correction for three straight days against the backdrop of a rejection around $87,200. Still, the Crypto King maintains a bullish near-term bias as price holds well above the 50-day, 100-day and 200-day Moving Average Exponential (EMA) lines clustered between roughly $75,200 and $79,600.
The SuperTrend indicator at $79,664 also sits comfortably below spot, reinforcing an underlying demand zone, while the Relative Strength Index (RSI) at 55 suggests moderate bullish momentum despite the Moving Average Convergence Divergence (MACD) remaining slightly negative, hinting at a slowing but still constructive trend rather than outright exhaustion.
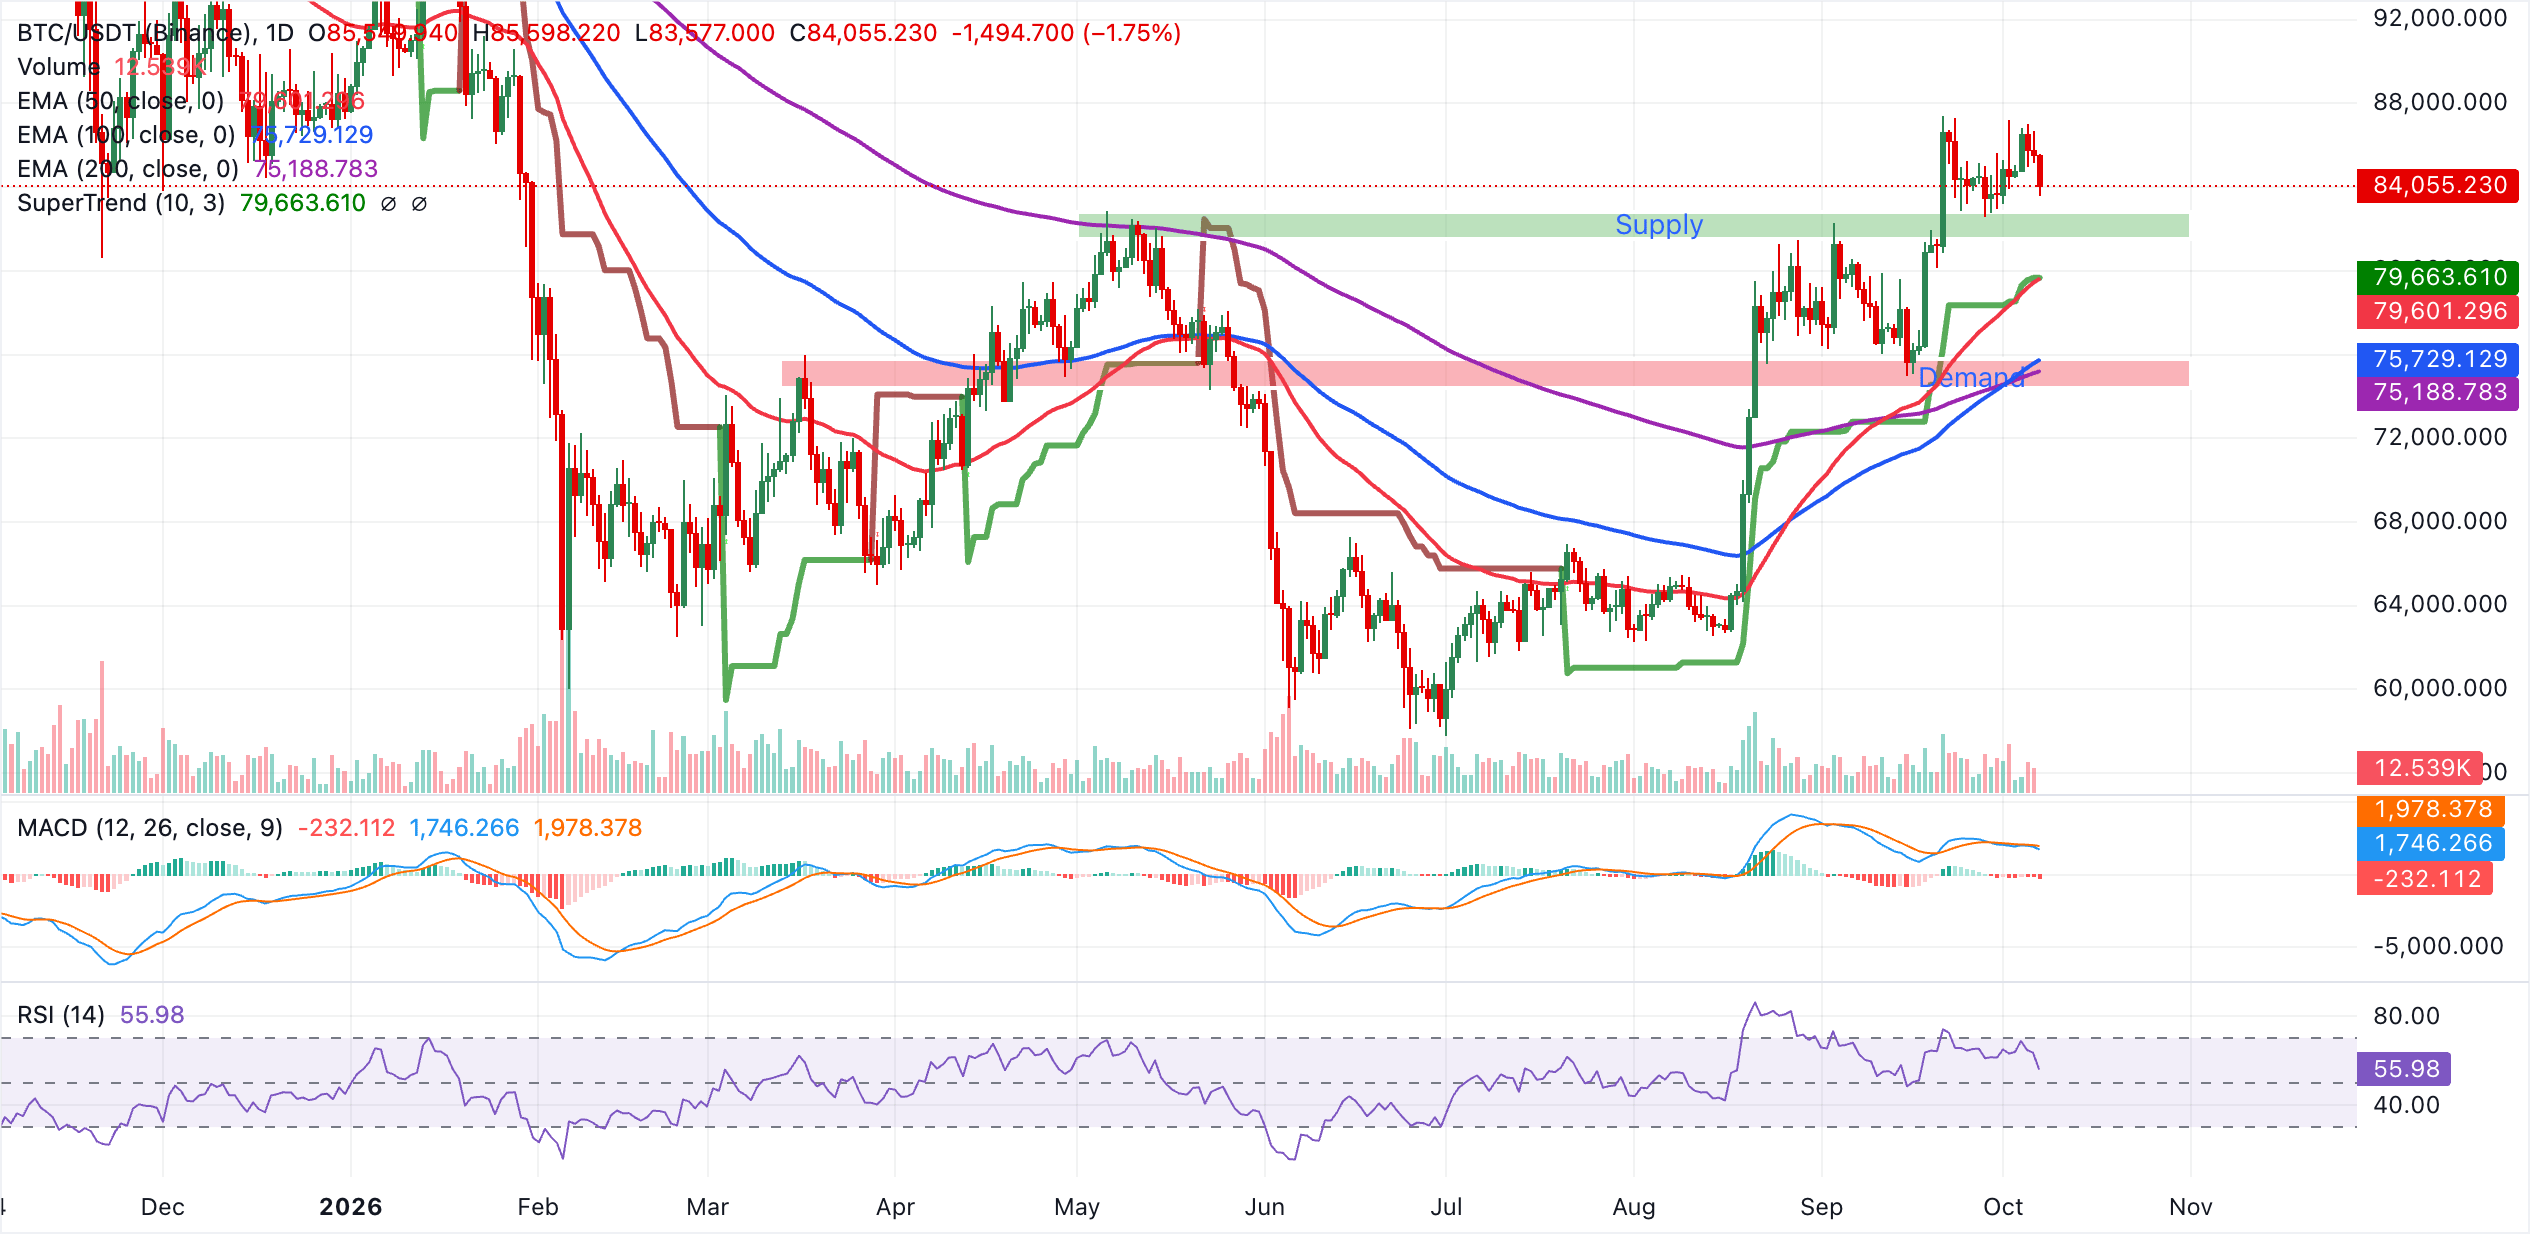
Immediate support sits around $84,000, the psychological area, with a more meaningful demand cluster emerging from the SuperTrend at $79,664 and the 50-day EMA at $79,601. Below this band, the 100-day EMA at $75,729 and the 200-day EMA at $75,189 form a deeper structural floor that would likely attract buyers on a more pronounced pullback, keeping the broader bullish structure intact as long as BTC holds above these medium and long-term averages.
Altcoins technical analysis: Ethereum and XRP wobble as sell-side pressure intensifies
Ethereum trades at $2,616, holding a constructive near-term bias as price remains above the 50-, 100- and 200-day EMAs clustered between roughly $2,505 and $2,289. The SuperTrend line at $2,478 also sits below spot, reinforcing a supportive backdrop despite softening momentum, with the MACD below zero and the RSI easing back toward the midline area.
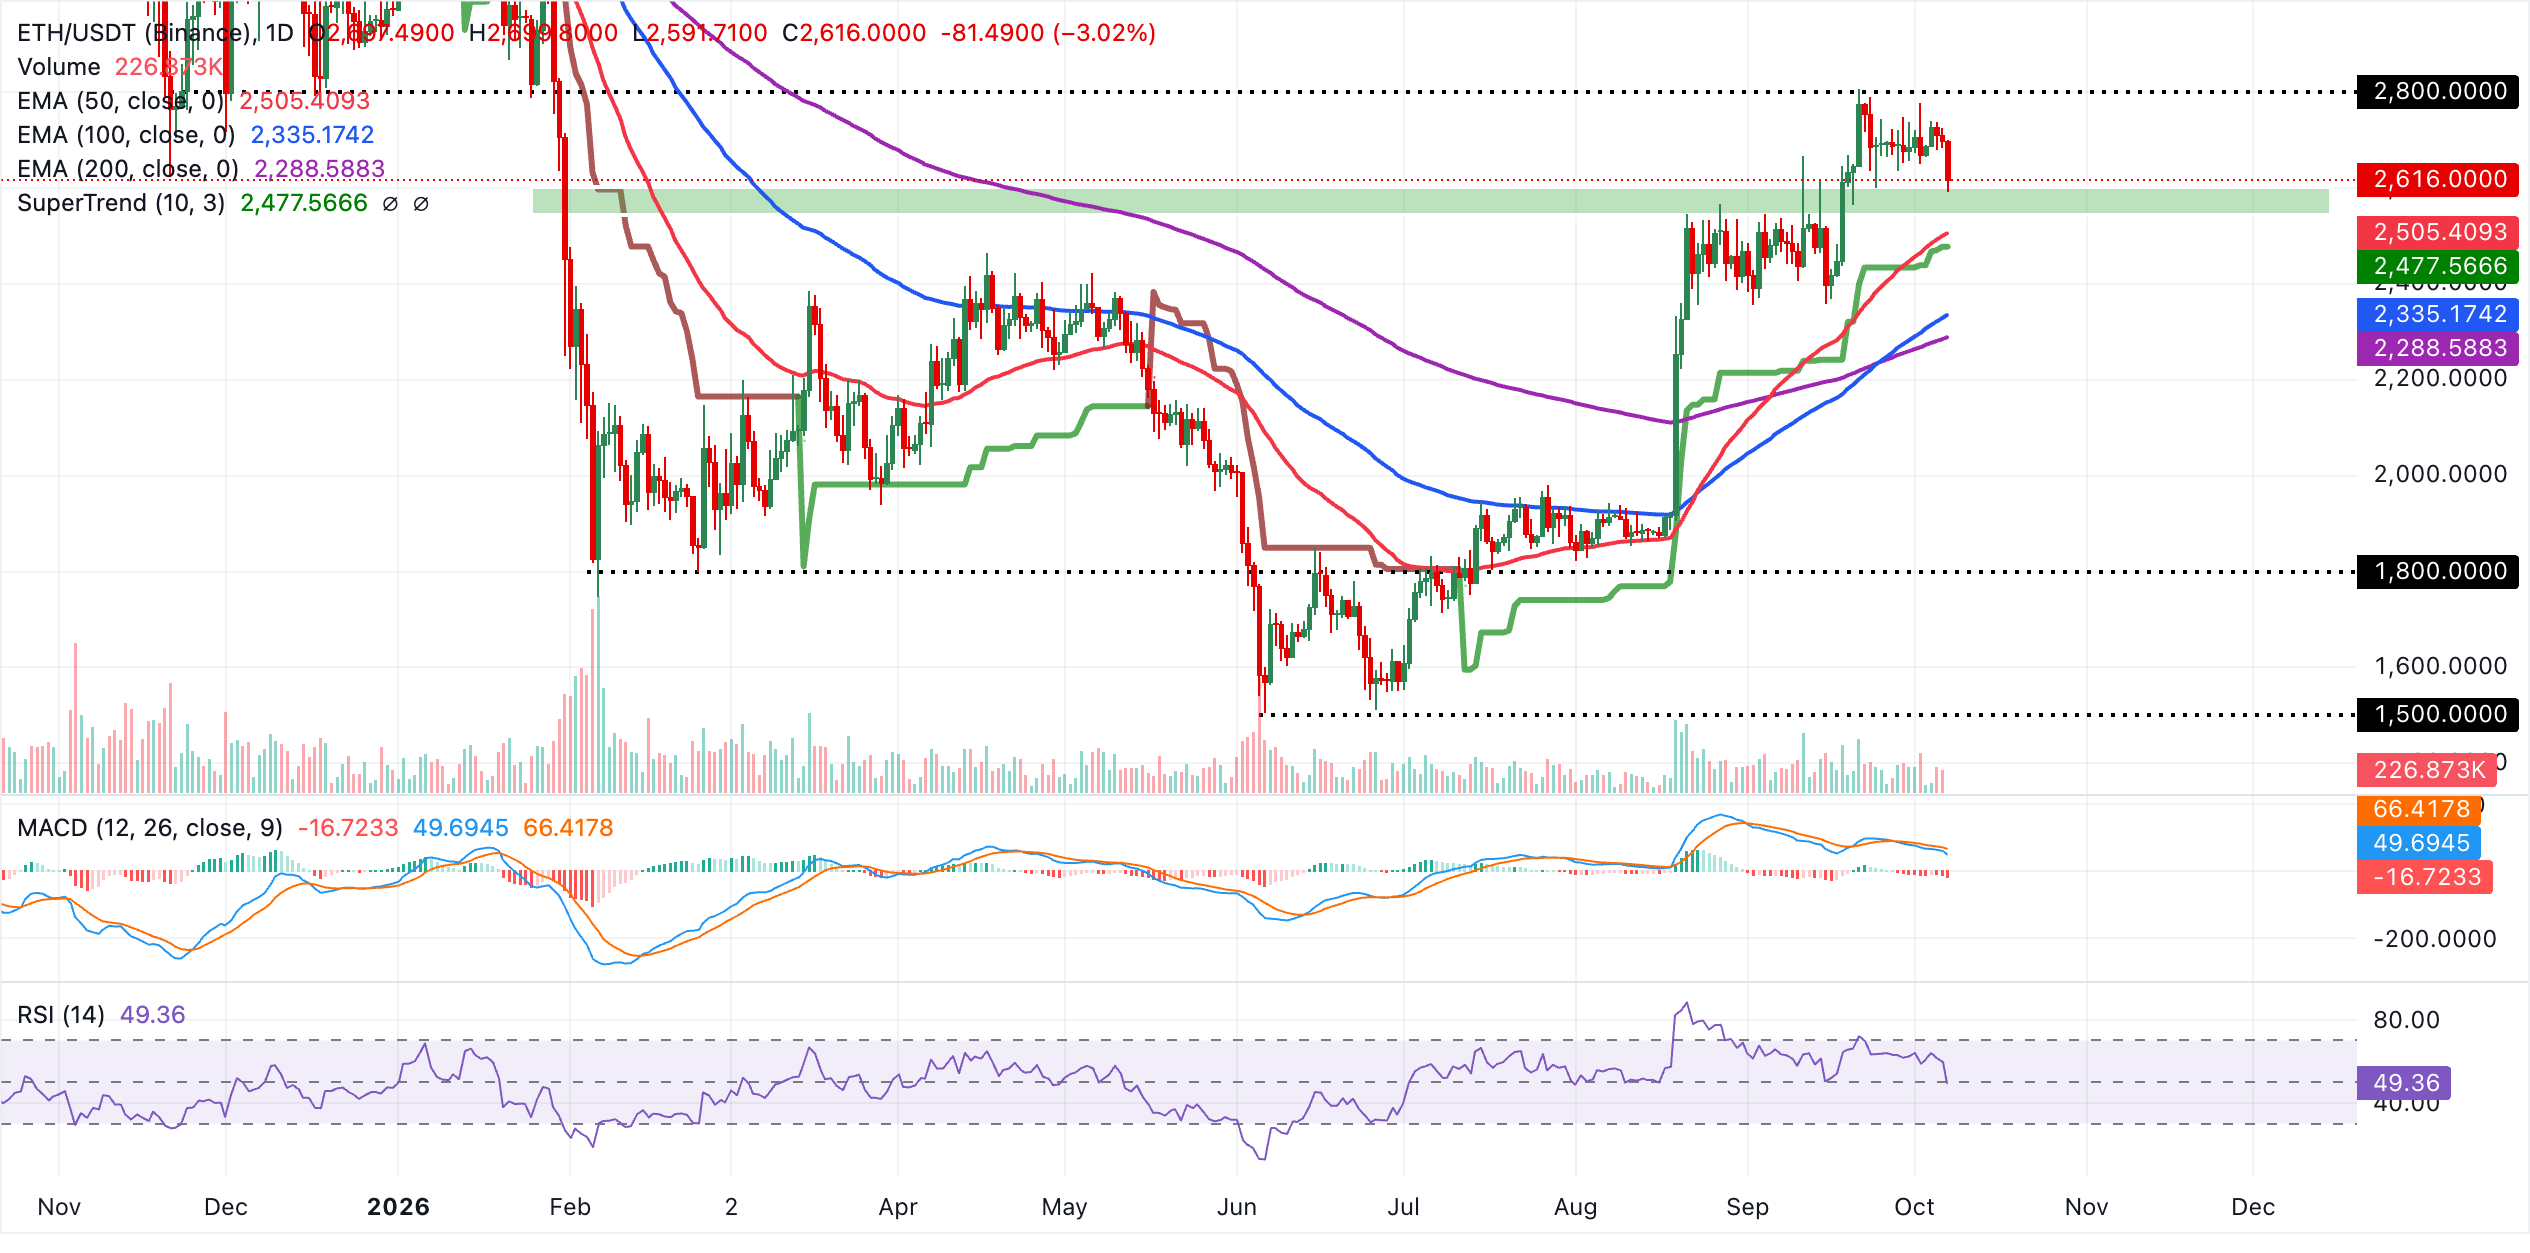
On the downside, initial support lies at the 50-day EMA around $2,505, ahead of the SuperTrend floor at $2,478, while deeper demand aligns with the 100-day EMA near $2,335 and the 200-day EMA at $2,288. With no clear overhead technical barriers on the daily chart, the current structure suggests dips toward this stacked support zone are likely to attract buyers as long as ETH holds above the 50-day EMA on a daily closing basis.
XRP, meanwhile, trades at $1.4676, as bears push to regain control over the trend. Despite the correction, the pair holds a bullish near-term bias as price trades well above the 50-day, 100-day, and 200-day EMAs, clustered between roughly $1.38 and $1.40, which now underpin the uptrend.
The SuperTrend indicator at $1.30 reinforces the broader bullish structure, while the RSI has eased back toward the low-50s, hinting at consolidative rather than overbought conditions. The MACD shows the line slipping further below zero, suggesting waning upside momentum even as the underlying trend supports price.
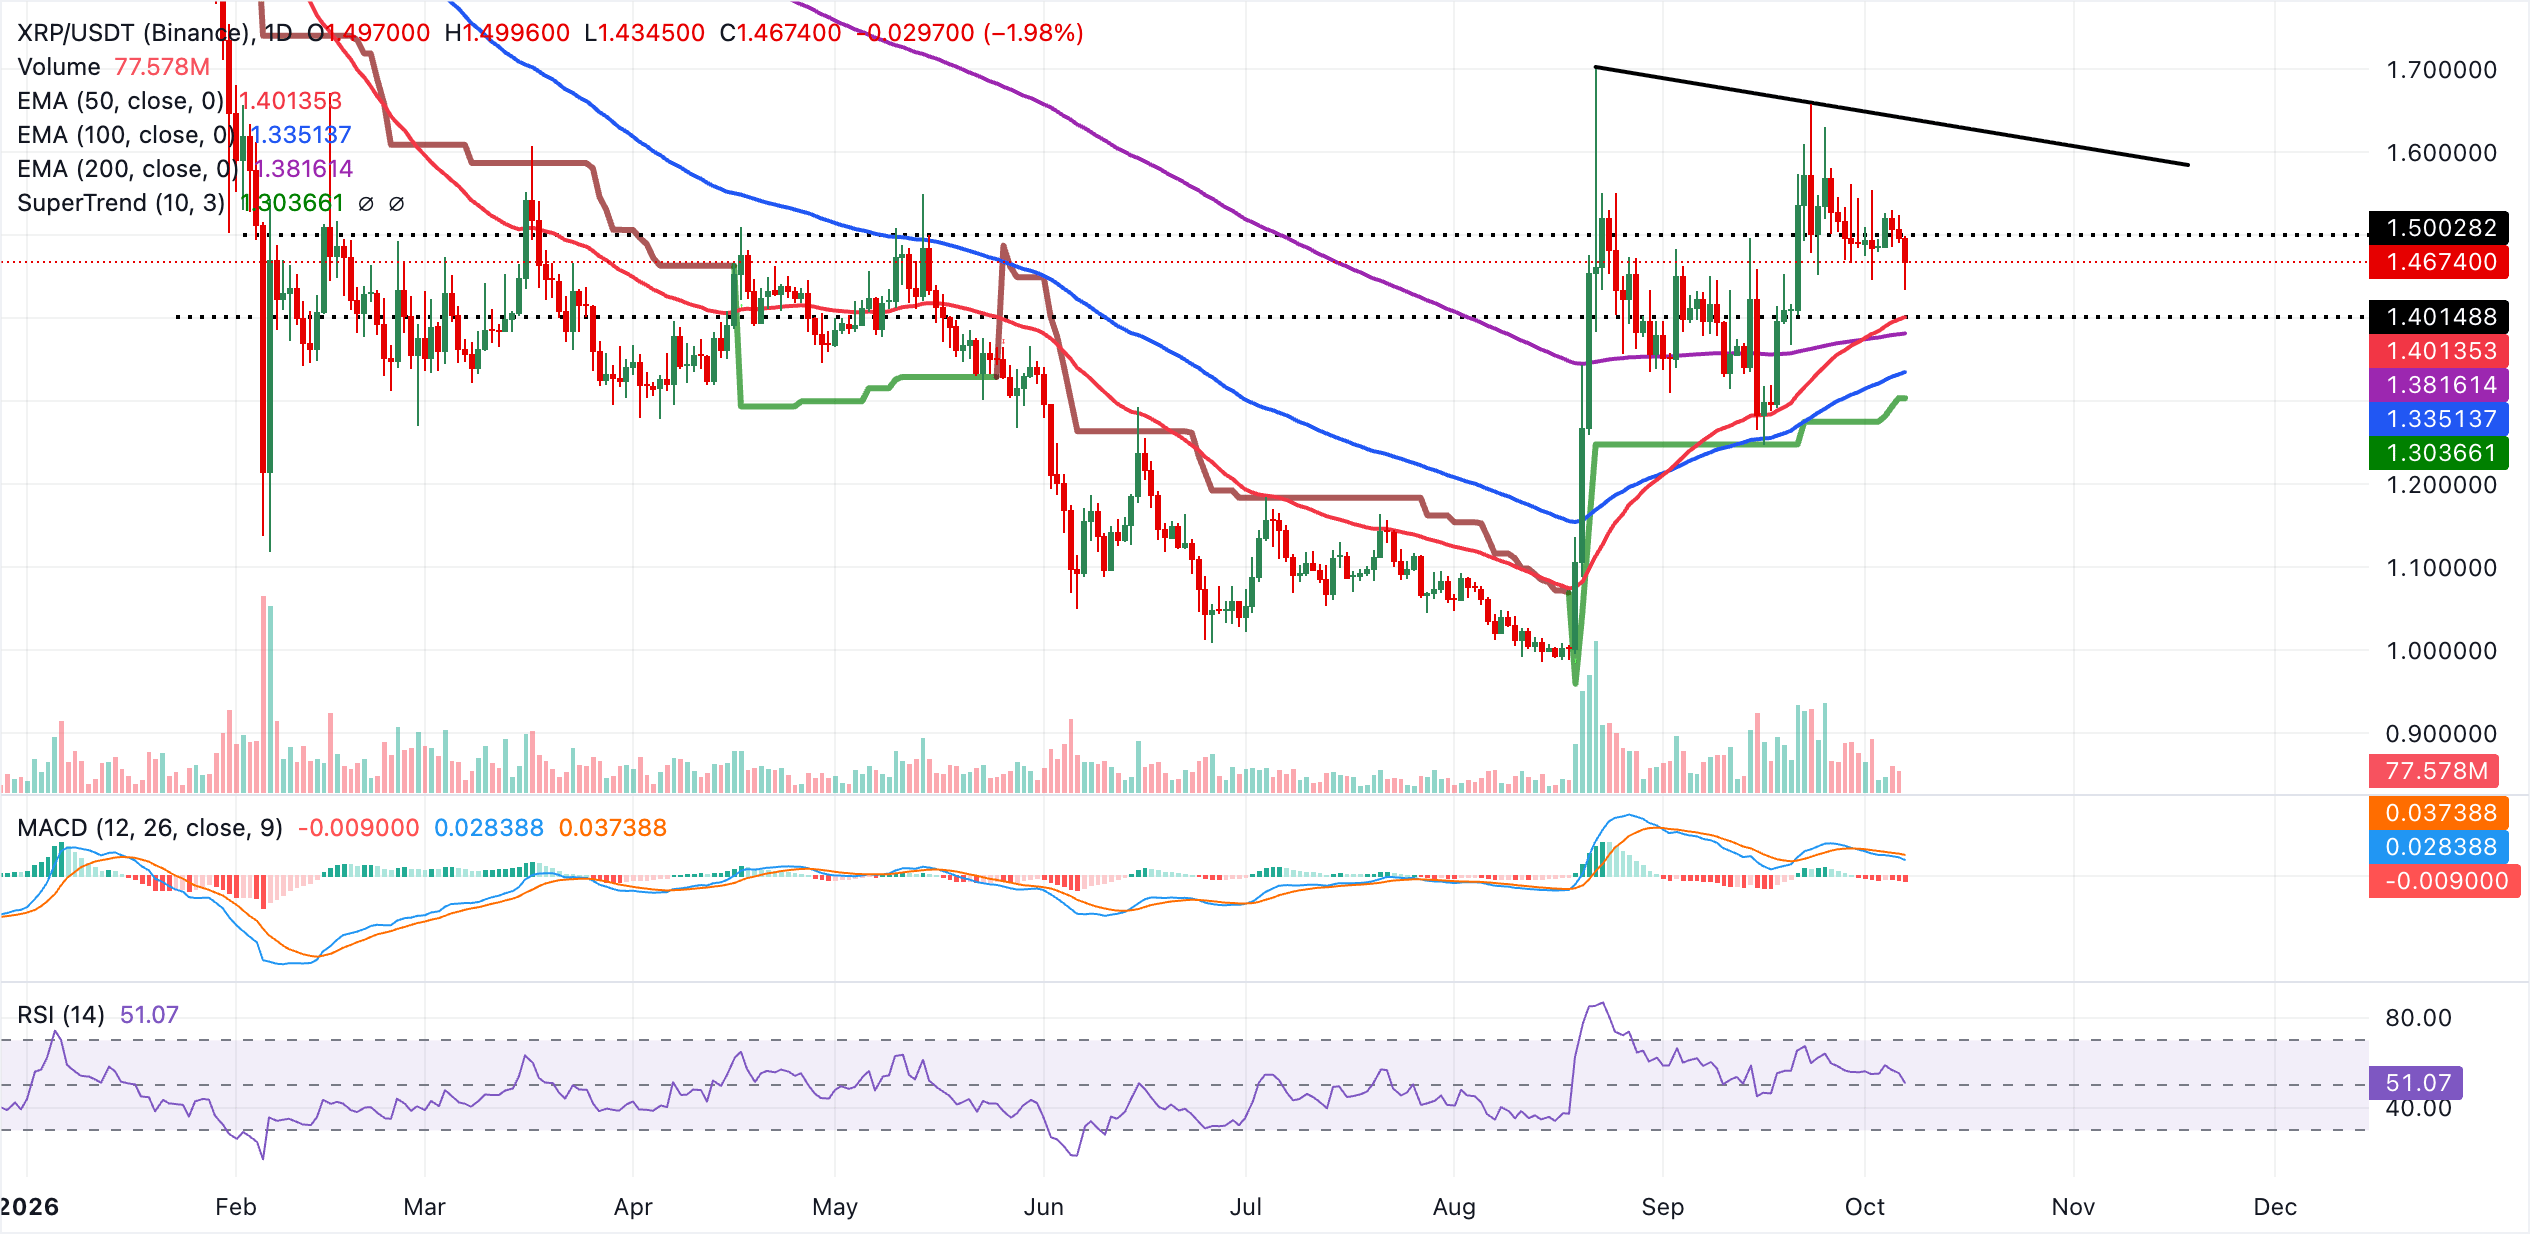
On the downside, immediate support lies at the 50-day EMA at $1.40, followed by the 200-day EMA at $1.38, with deeper demand located around the 100-day EMA at $1.34 and the SuperTrend base near $1.30. On the topside, the next notable resistance aligns with the broken downward trend line around $1.64, where selling pressure could re-emerge if bulls attempt another leg higher.
(The technical analysis of this story was written with the help of an AI tool. Know more.)
Open Interest, funding rate FAQs
Higher Open Interest is associated with higher liquidity and new capital inflow to the market. This is considered the equivalent of increase in efficiency and the ongoing trend continues. When Open Interest decreases, it is considered a sign of liquidation in the market, investors are leaving and the overall demand for an asset is on a decline, fueling a bearish sentiment among investors.
Funding fees bridge the difference between spot prices and prices of futures contracts of an asset by increasing liquidation risks faced by traders. A consistently high and positive funding rate implies there is a bullish sentiment among market participants and there is an expectation of a price hike. A consistently negative funding rate for an asset implies a bearish sentiment, indicating that traders expect the cryptocurrency’s price to fall and a bearish trend reversal is likely to occur.
Bài viết đề xuất


