


Ripple Price Forecast: XRP gathers strength around $1.50 after 43% returns in Q3
- XRP hovers around $1.50 as bulls push against fresh headwinds capping its recovery potential.
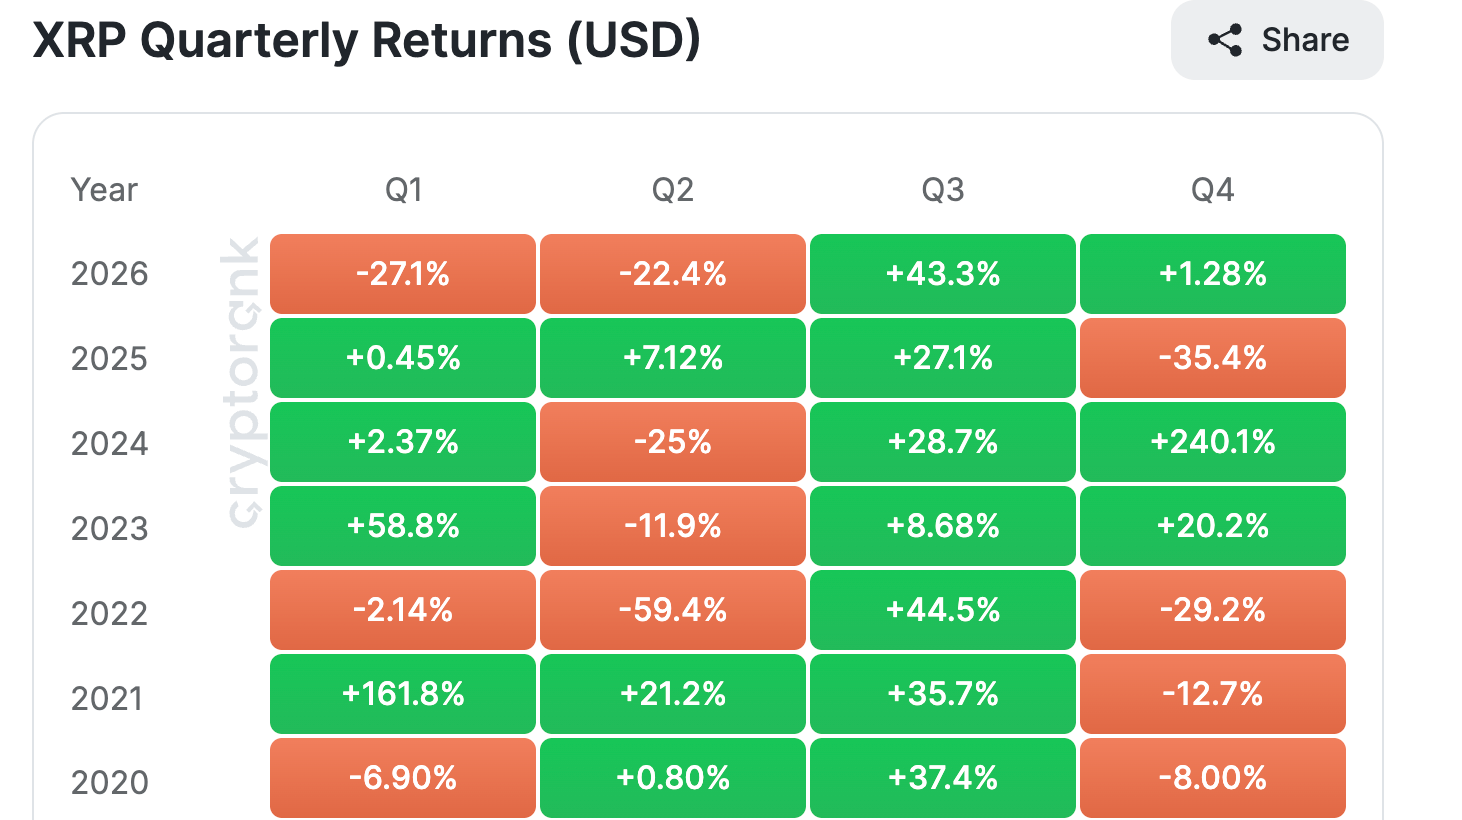
- XRP posts its first positive quarterly return in 2026, up 43% in Q3, signaling a potential turnaround.
- XRP’s long-term technical outlook remains firmly supported by the 200-week EMA and a MACD buy signal.
Ripple (XRP) trades sideways around the pivotal $1.50 level on Tuesday. The remittance token similarly holds in a broader range with support at $1.40 and resistance at $1.60.
A break on either side could set the pace and direction XRP takes in the fourth quarter of 2026. Therefore, traders should temper expectations even as the short-term $1.45 support holds. An extended cap on the upside could leave buyers exhausted, prompting profit-taking and increasing sell-side pressure.
XRP quarterly returns turnaround
XRP has logged three consecutive months of positive returns, starting with approximately 2% in July, 30% in August and 8% in September. Cumulatively, this marked the first bullish quarter of 2026, at 43% in Q3, suggesting a steady turnaround toward the end of the year.
Looking back, the token experienced drawdowns at the beginning of the year, with -27% in Q1 returns and -22% in Q2 returns. If Q3 momentum continues over the next three months, XRP could be on course to log two consecutive quarters of positive returns.
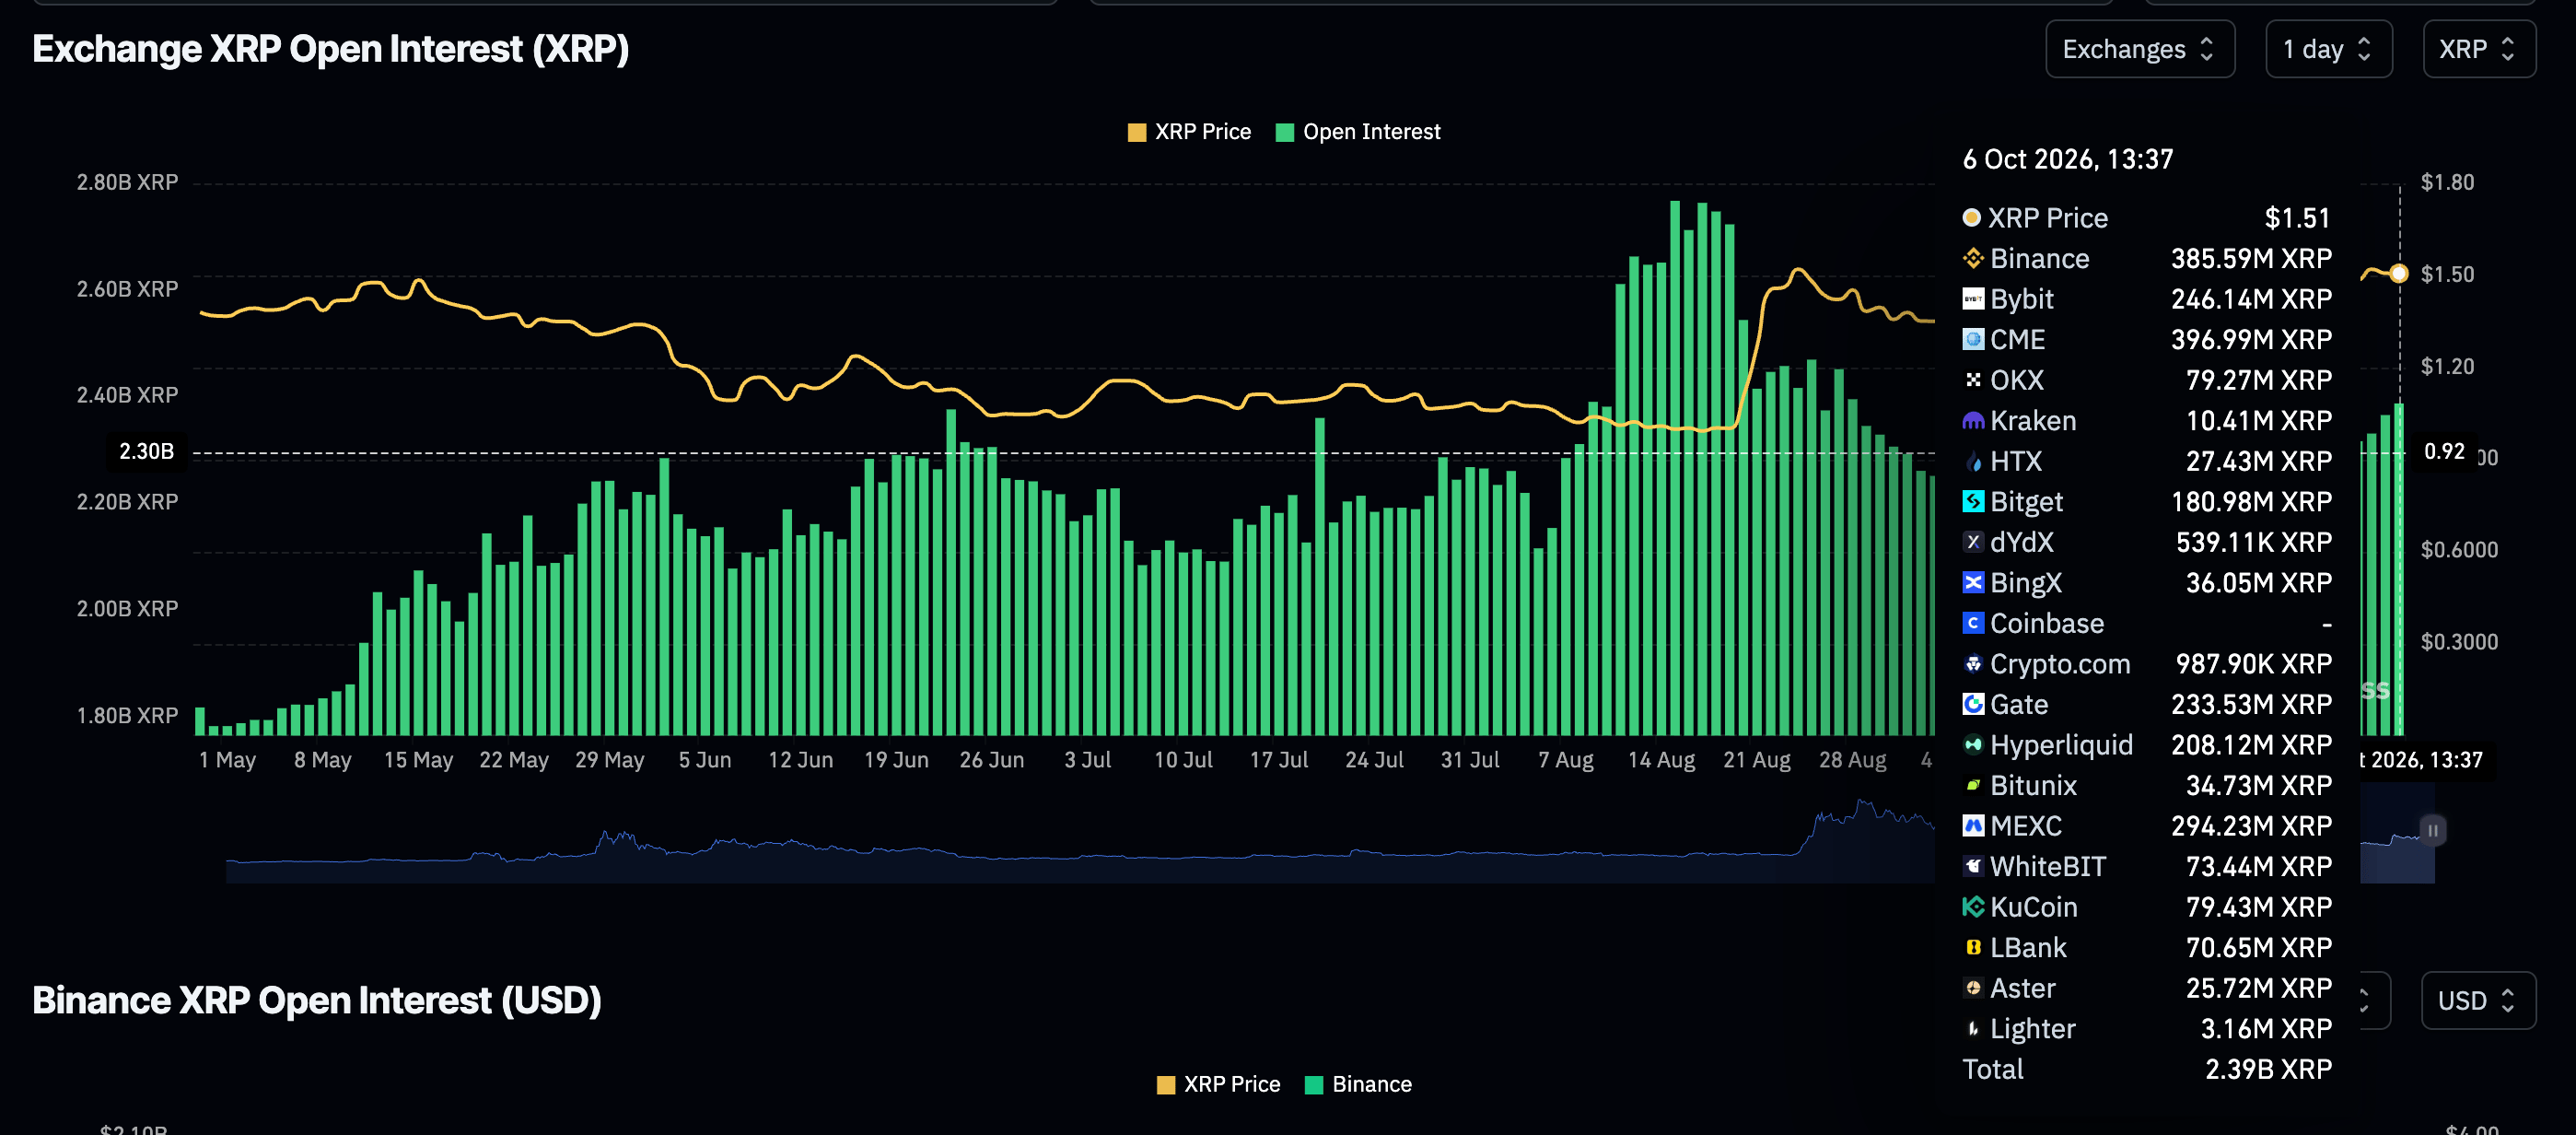
Retail demand in the derivatives market held slightly elevated at 2.39 billion XRP on Tuesday, up from 2.33 billion XRP the day before and 2.08 billion XRP in mid-September. The odds of a steady recovery will likely increase if retailers continue taking on more risk, providing the required tailwind.
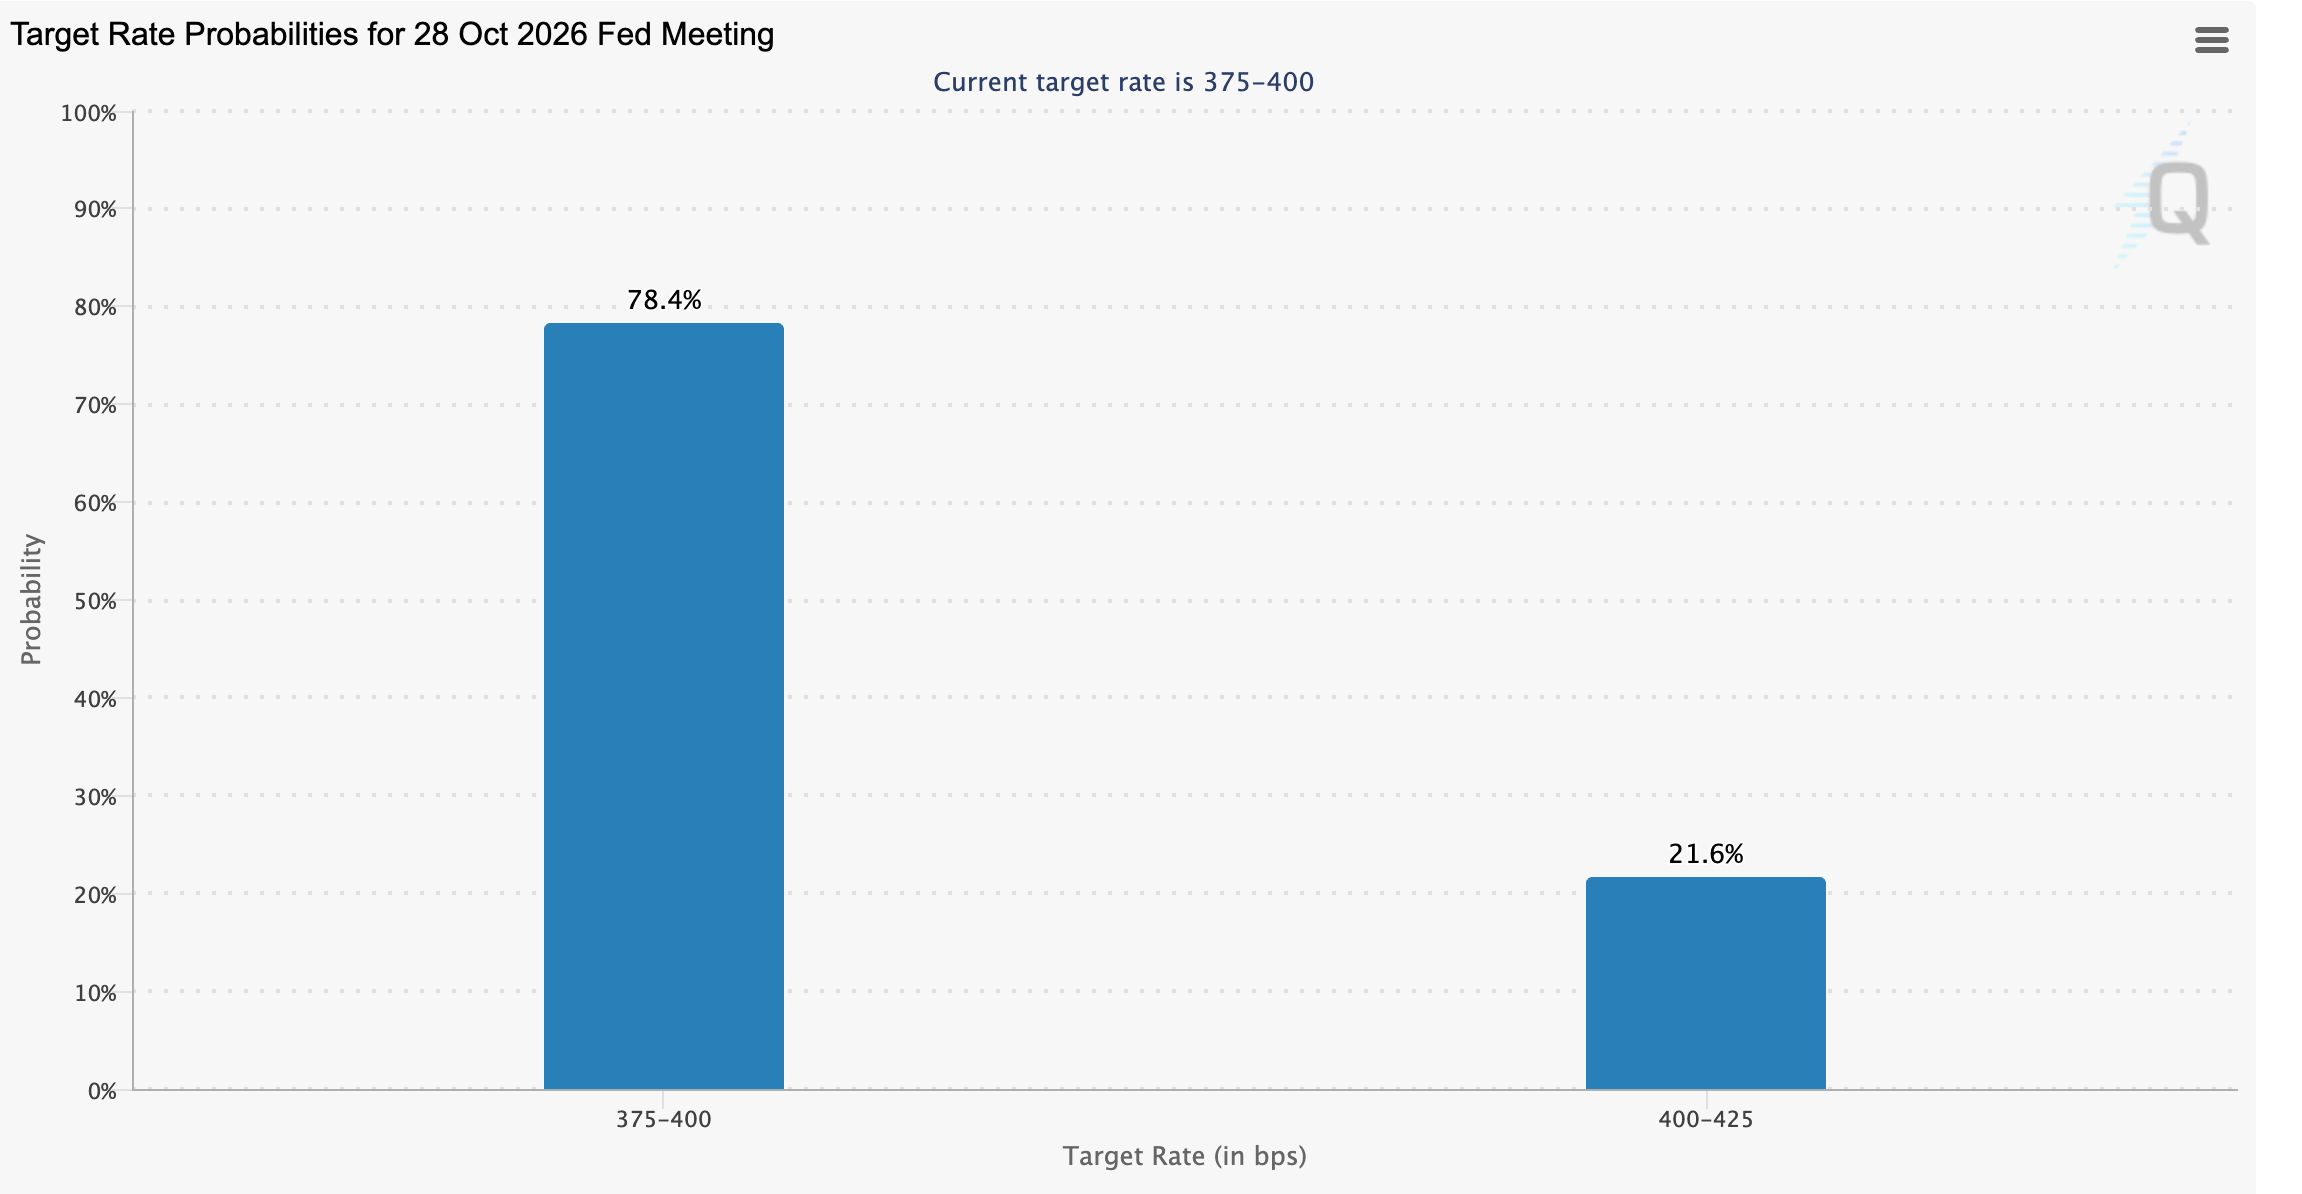
On the macro side, focus remains on rate-hike odds, which have continued to dwindle to an average of 22% on Tuesday, according to the CME Group’s FedWatch tool. This means market participants are now pricing a higher probability that the Federal Reserve (Fed) will leave interest rates unchanged in the 3.75%-4.00 range in October after raising rates by 25 basis points in September.
Next week's Consumer Price Index (CPI) release would provide more insight into the Fed’s monetary policy direction. Inflation in the United States (US) remains above the central bank’s long-term 2% target. Odds of a rate hike in December are still high at 67%.
Crypto Finance said in an emailed analysis report that “Friday's payrolls report set the tone, with markets now assigning a 76% probability to a rate hold at the October meeting, while odds of a hike in December remain elevated at 67%.”
Technical analysis: XRP retains bullish bias despite sideways action
XRP trades above $1.50 and holds comfortably above the 50-day, 100-day, and 200-day EMAs at $1.40, $1.33, and $1.38, respectively, keeping the near-term tone bullish as price extends its advance away from these trend references.
The SuperTrend line, rising from $1.30, further reinforces an underlying supportive structure, while the RSI at 57 stays in constructive territory despite a slightly soft MACD reading, hinting at a moderated but still positive bias.
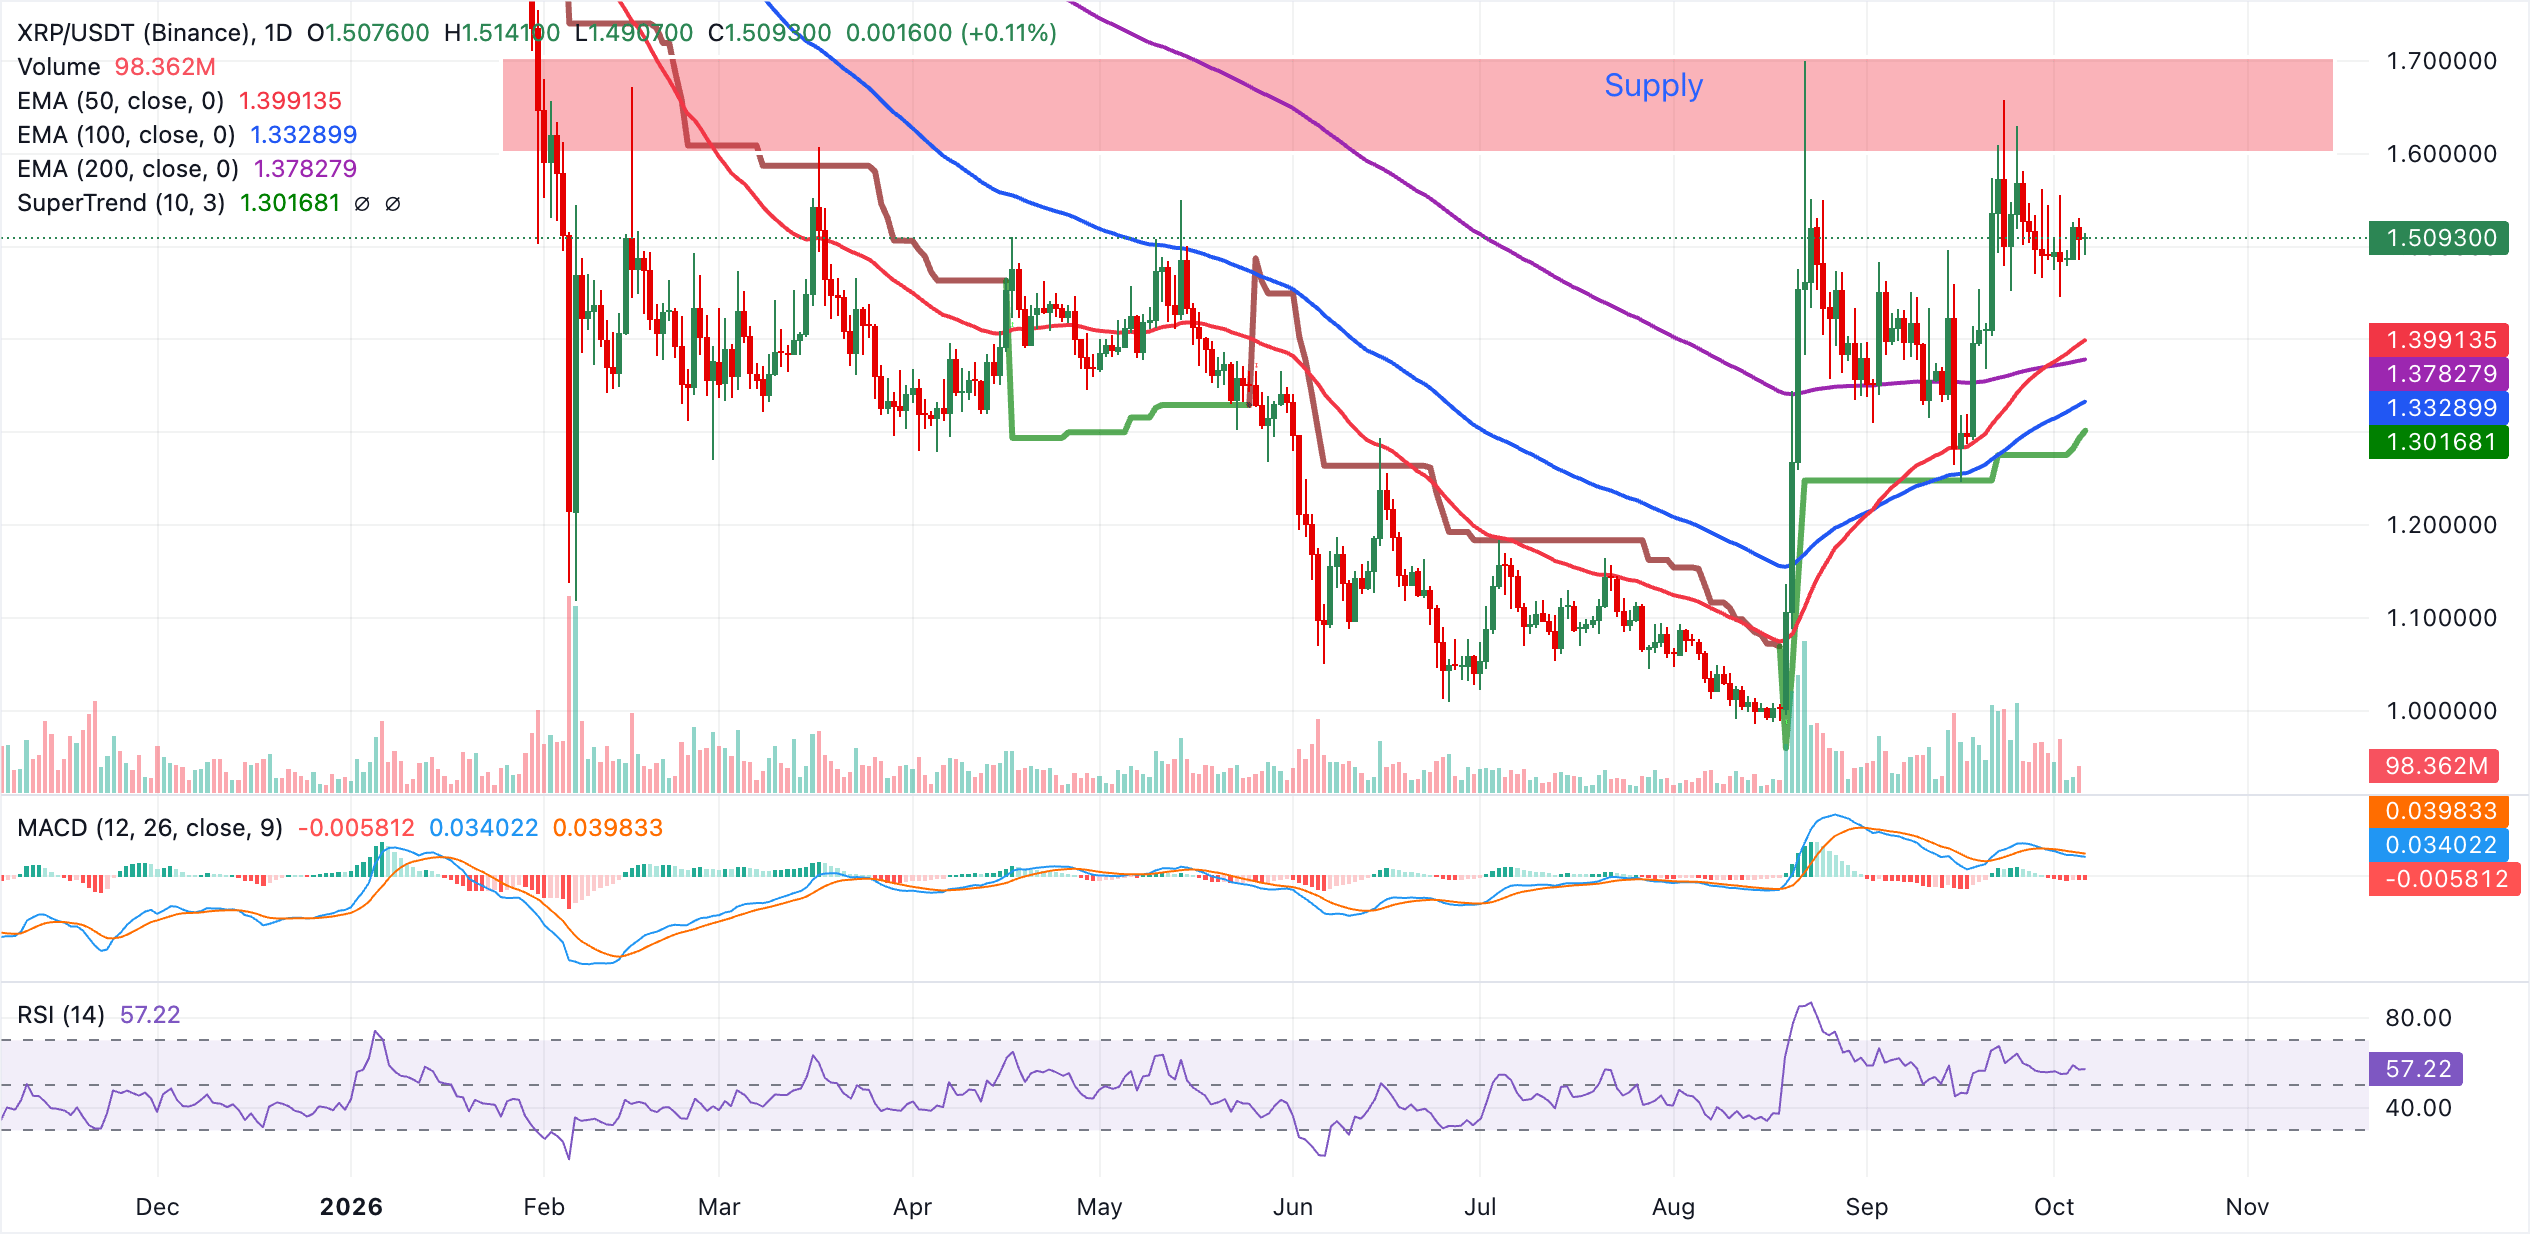
Initial support lies at the 50-day EMA around $1.40, followed by the 200-day EMA near $1.38, which together form a secondary demand zone before the deeper structural floor at the 100-day EMA at $1.33. Below that, the SuperTrend level at $1.30 marks a more distant but important trend-defining base that would need to hold to preserve the broader bullish structure.
Meanwhile, on the weekly, the pair has bounced back above the longer-term 200-week EMA at $1.37, but remains capped by the 50-week EMA at $1.52 and the 100-week EMA at $1.58, keeping the near-term tone mildly bearish while price consolidates just under these dynamic ceilings.
The MACD is positive with the line holding above its signal and a still-constructive histogram, while the RSI at 55 stays in neutral-bullish territory, suggesting that momentum is improving but not yet strong enough to clear overhead resistance.
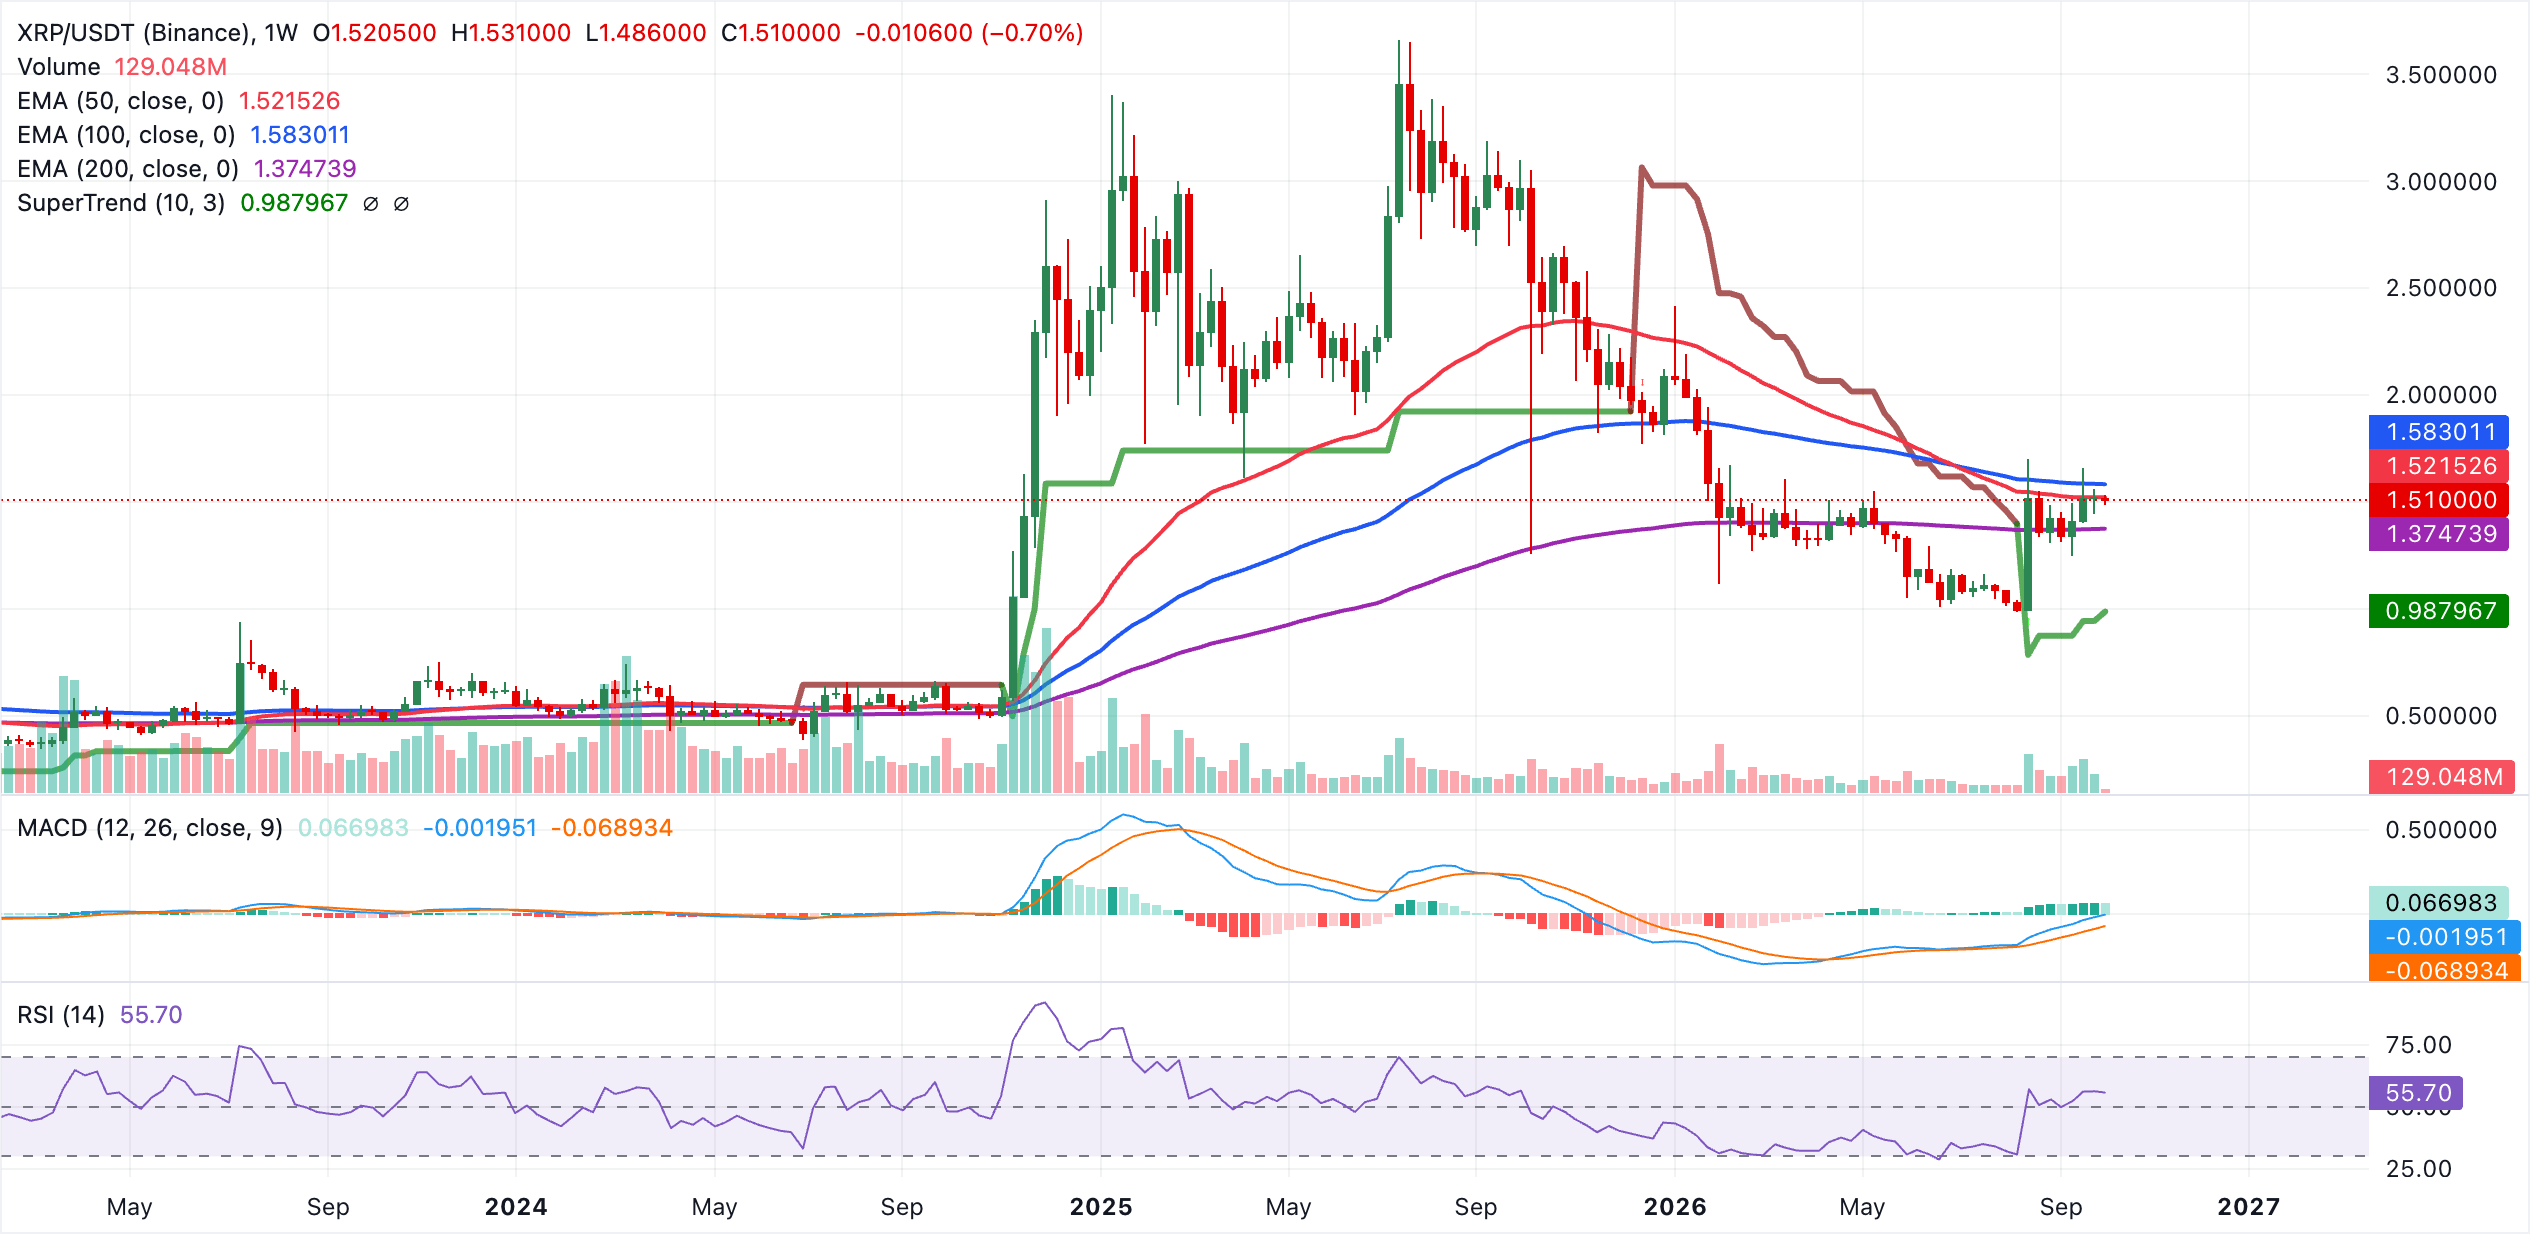
Immediate resistance lies at the 50-week EMA around $1.52, followed by the denser barrier near the 100-week EMA at $1.58, where further buying may struggle. On the downside, the current price area around $1.51 acts as a short-term pivot, with more meaningful support emerging at the 200-week EMA near $1.37. A weekly close back below this level would reopen the path toward the SuperTrend base around $0.99 and signal a deeper corrective phase.
(The technical analysis of this story was written with the help of an AI tool. Know more.)
Open Interest, funding rate FAQs
Higher Open Interest is associated with higher liquidity and new capital inflow to the market. This is considered the equivalent of increase in efficiency and the ongoing trend continues. When Open Interest decreases, it is considered a sign of liquidation in the market, investors are leaving and the overall demand for an asset is on a decline, fueling a bearish sentiment among investors.
Funding fees bridge the difference between spot prices and prices of futures contracts of an asset by increasing liquidation risks faced by traders. A consistently high and positive funding rate implies there is a bullish sentiment among market participants and there is an expectation of a price hike. A consistently negative funding rate for an asset implies a bearish sentiment, indicating that traders expect the cryptocurrency’s price to fall and a bearish trend reversal is likely to occur.
Bài viết đề xuất


