


Crypto Today: Bitcoin and Ethereum edge lower, XRP extends recovery as macro headwinds weigh
- Bitcoin gives back some of its gains from earlier this week and trades near $84,000 as Fed rate-hike bets remain elevated.
- Ethereum slips below $2,700, in tandem with cooling momentum indicators.
- XRP ticks up for a second consecutive day, backed by a rising moving-average support cluster.
The broader cryptocurrency market is consolidating on Friday, with Bitcoin (BTC) paring losses slightly above $84,000. Ethereum (ETH) declines in tandem with BTC, undermining early-week gains that propelled most cryptocurrencies to eight-month highs. The smart contract token hovers marginally below $2,700.
Ripple (XRP), meanwhile, paints a different picture, edging higher and trading at $1.54, suggesting buy-side pressure remains intact even as profit-taking weighs on price action.
Fed rate hike fears weigh on market sentiment
The United States (US) Federal Reserve (Fed) raised interest rates in the latest cycle in September by 25 basis points to the 3.75%-4.00% range. This hike was widely expected and priced in, and the central bank emphasized the need to bring sticky inflation in the world’s largest economy back to the long-term target of 2%.
Still, market participants are anticipating another hike, which would bring interest rates to the 4.00%-4.25% range in October. The hawkish outlook comes amid persistent geopolitical tensions in the Middle East, which are weighing on global supplies, including Oil and energy.
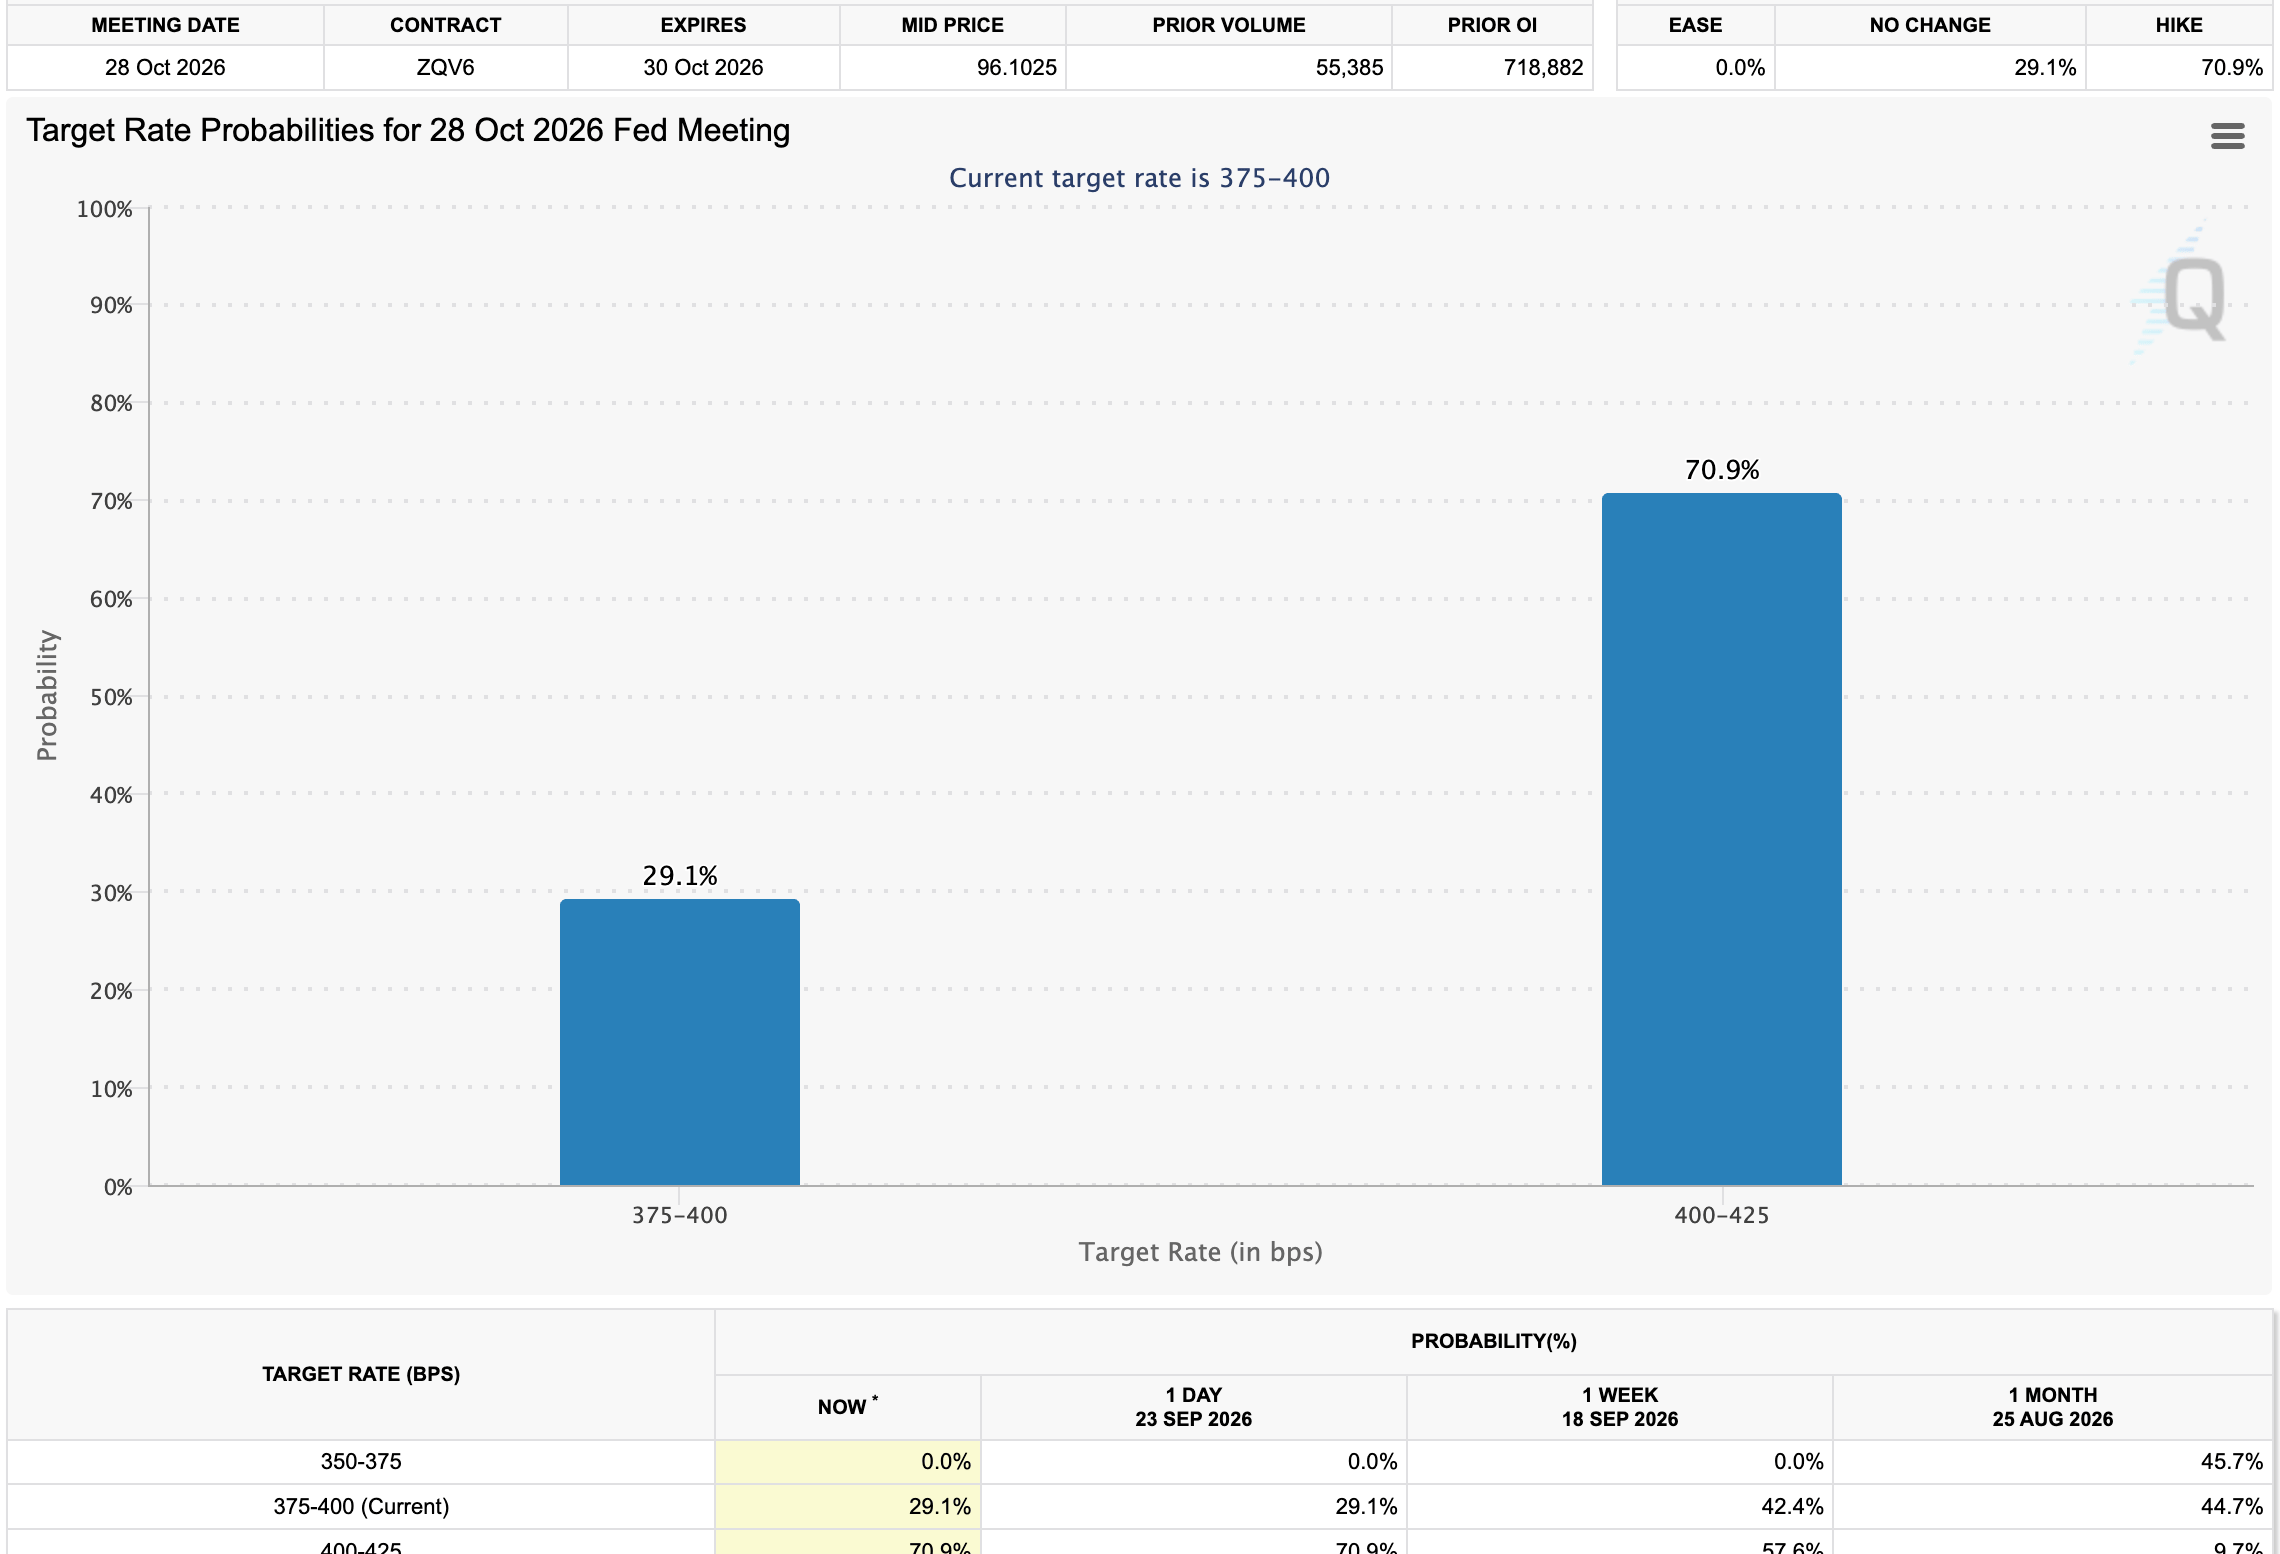
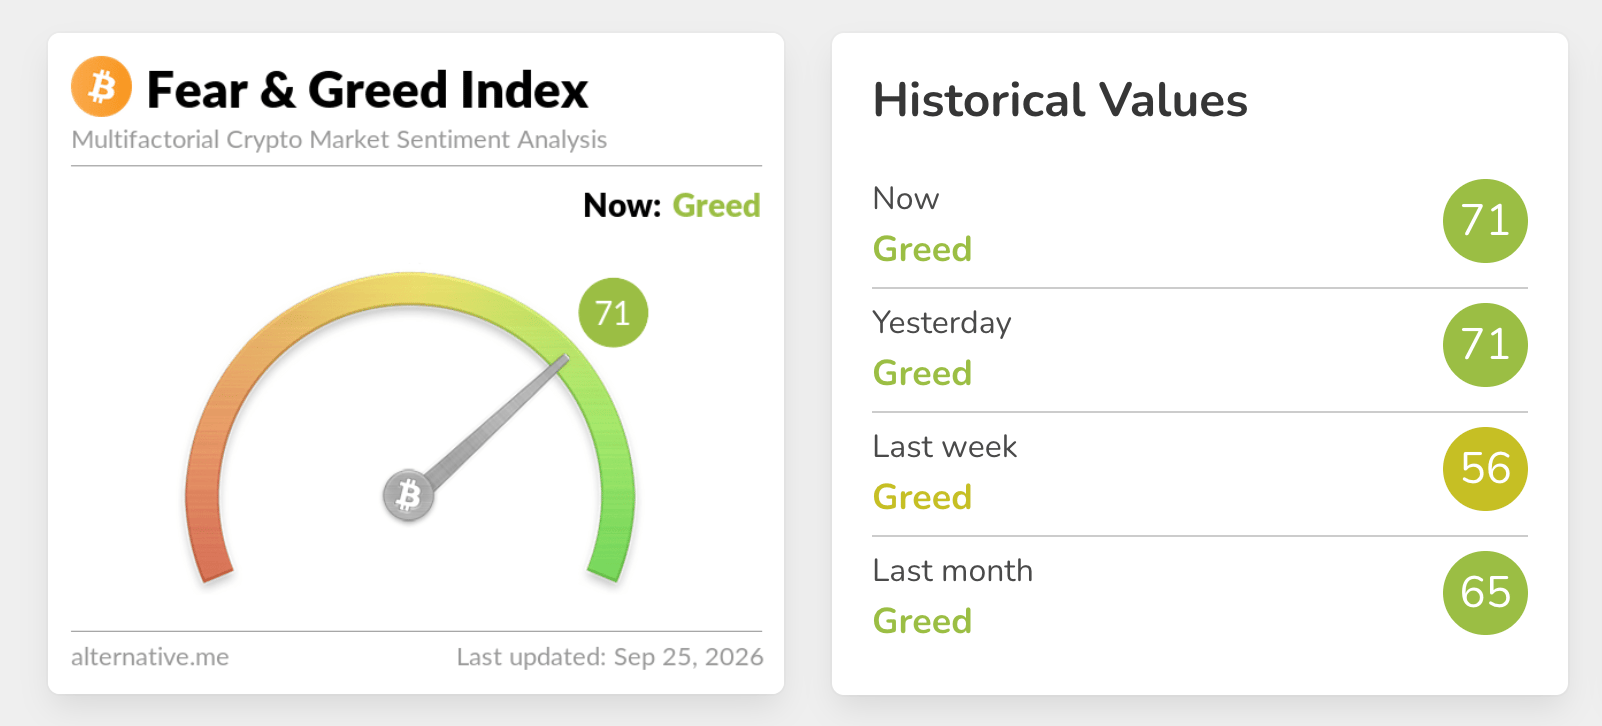
The FedWatch tool shows a 71% chance that the Fed will raise interest rates. However, appetite for digital assets remains elevated, as reflected in the crypto Fear & Greed Index, steady at 71 in the Greed territory.
If bulls keep buying and increasing risk exposure, the path of least resistance for many cryptocurrencies will remain upward. Bitcoin appears poised for another breakout toward the $88,000 mark, while Ethereum eyes a move higher with $3,000 as the next key resistance level. Meanwhile, XRP continues to build on its recovery, with upside potential toward $2.00.
Technical analysis: Bitcoin holds higher support
Bitcoin trades at $84,135, extending a constructive bullish bias despite correcting from a weekly high of $87,378. Price holds well above the short- and long-term Exponential Moving Averages (EMAs), which all sit comfortably beneath spot and hint at a well-supported uptrend structure.
Momentum remains positive, with the Relative Strength Index (RSI) hovering in the mid-60s and the Moving Average Convergence Divergence (MACD) staying above the zero line, suggesting buyers still control the move despite the recent surge.
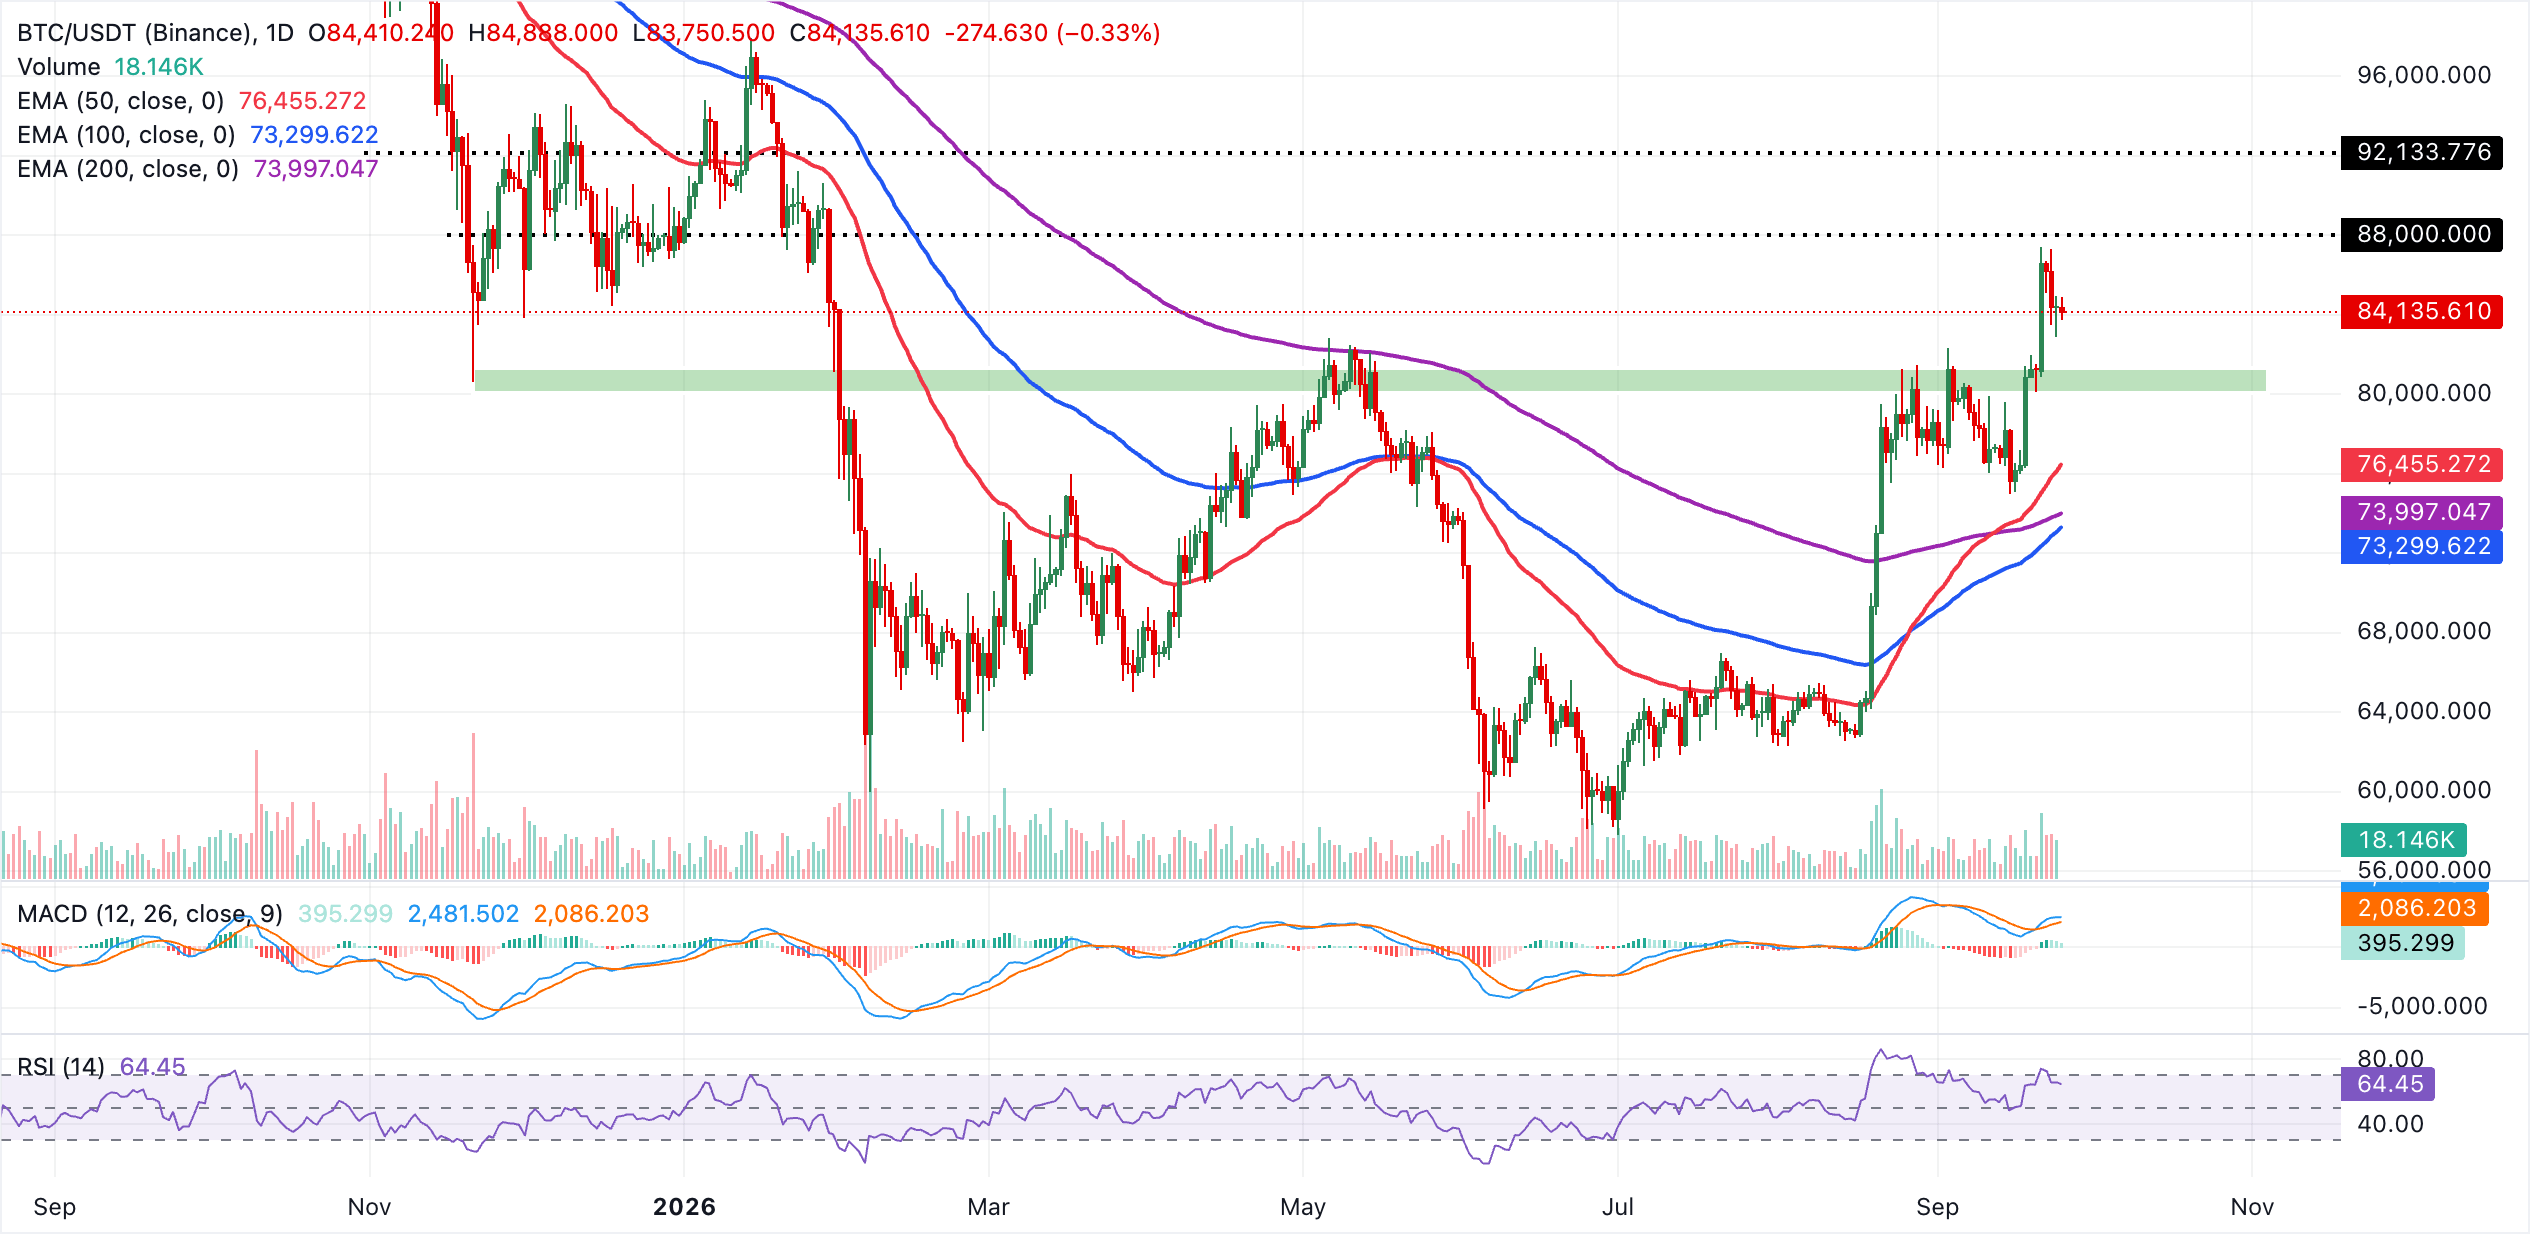
On the downside, initial support lies at the 50-day EMA around $76,455, where dip buyers could emerge on a deeper pullback. A break below this level would expose the next demand band defined by the 200-day EMA near $73,997 and the slightly lower 100-day EMA at about $73,300, which together form a broader medium-term support zone that would need to give way to seriously undermine the prevailing bullish outlook.
Altcoins technical outlook: Ethereum consolidates while XRP gains momentum
Ethereum trades at $2,683, as bulls eye short-term support after a decline from weekly highs at $2,805. The smart contract token extends a constructive bullish bias despite the pullback, as price holds well above the rising 50-, 100-, and 200-day EMAs.
The cluster of EMAs between roughly $2,240 and $2,390, together with the SuperTrend line at $2,434, suggests a broad demand band underpinning the advance, while the MACD indicator remains in positive territory, albeit with easing momentum, hinting at a maturing but still intact uptrend.
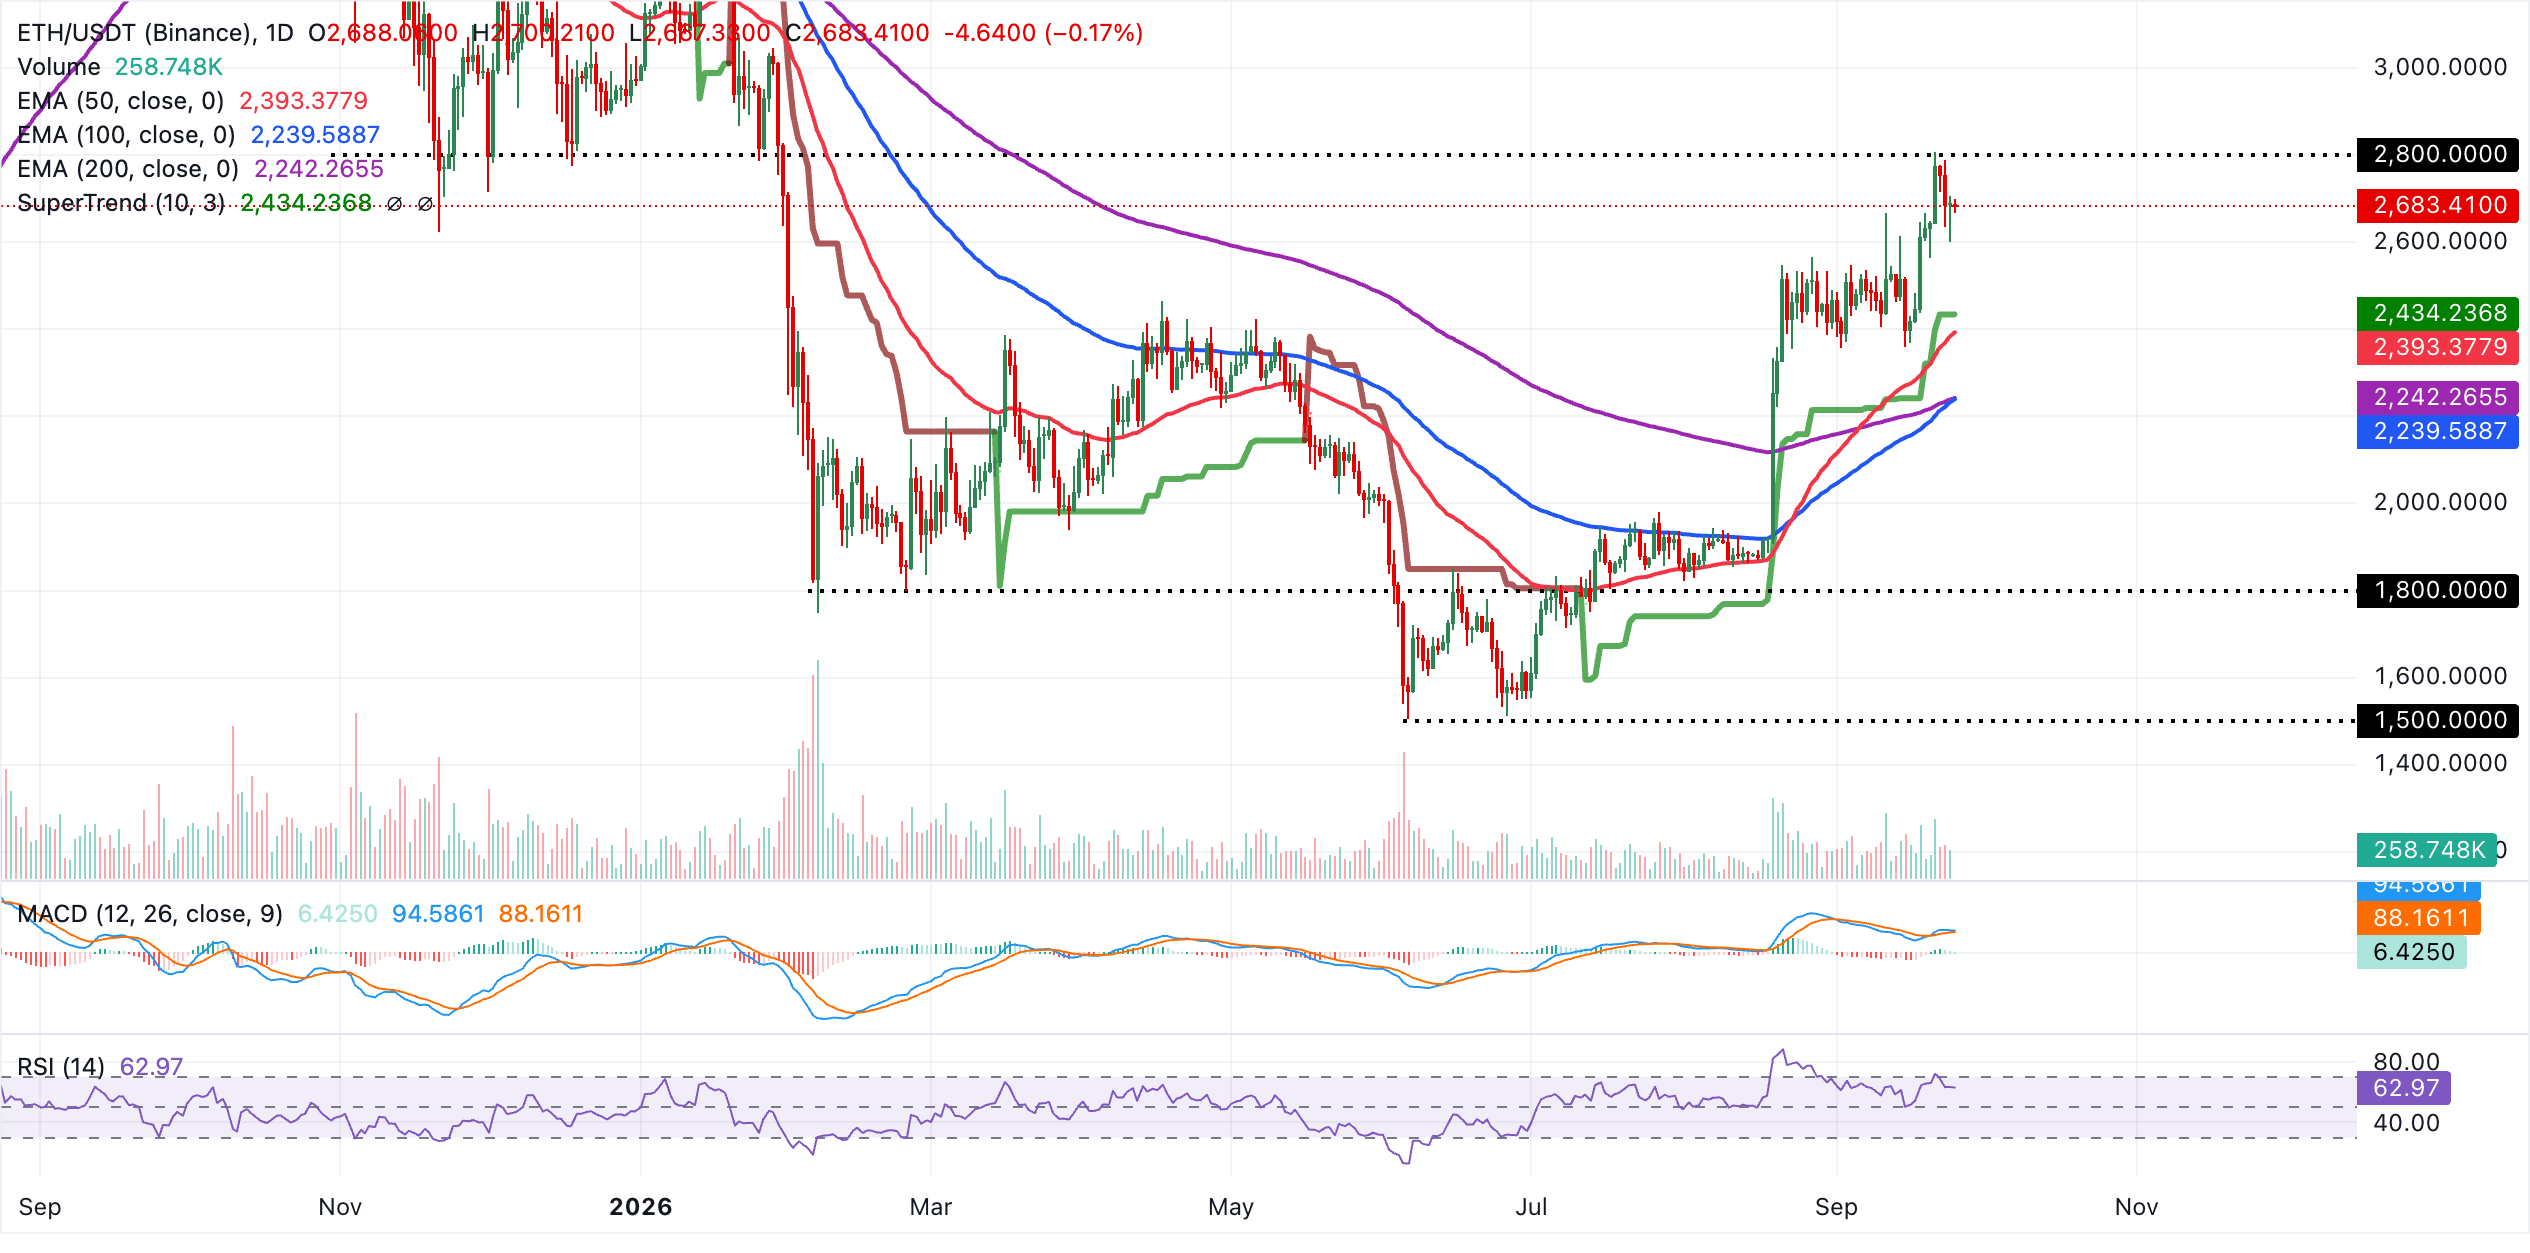
Initial support appears at the SuperTrend level near $2,434, aligning with the broader demand zone defined by the 50-day EMA at $2,393. A deeper pullback would expose the lower structural floor around the 200-day EMA at $2,242, reinforced by the nearby 100-day EMA at $2,240, where buyers would be expected to defend the broader bullish structure as long as daily closes remain above this band.
XRP, meanwhile, trades at $1.54, extending its advance well above the key moving averages, which keeps the near-term bias bullish. Momentum is supportive, with the RSI at 62 in positive territory and the MACD line above both the signal line and the zero mark, suggesting buyers still control the move for now.
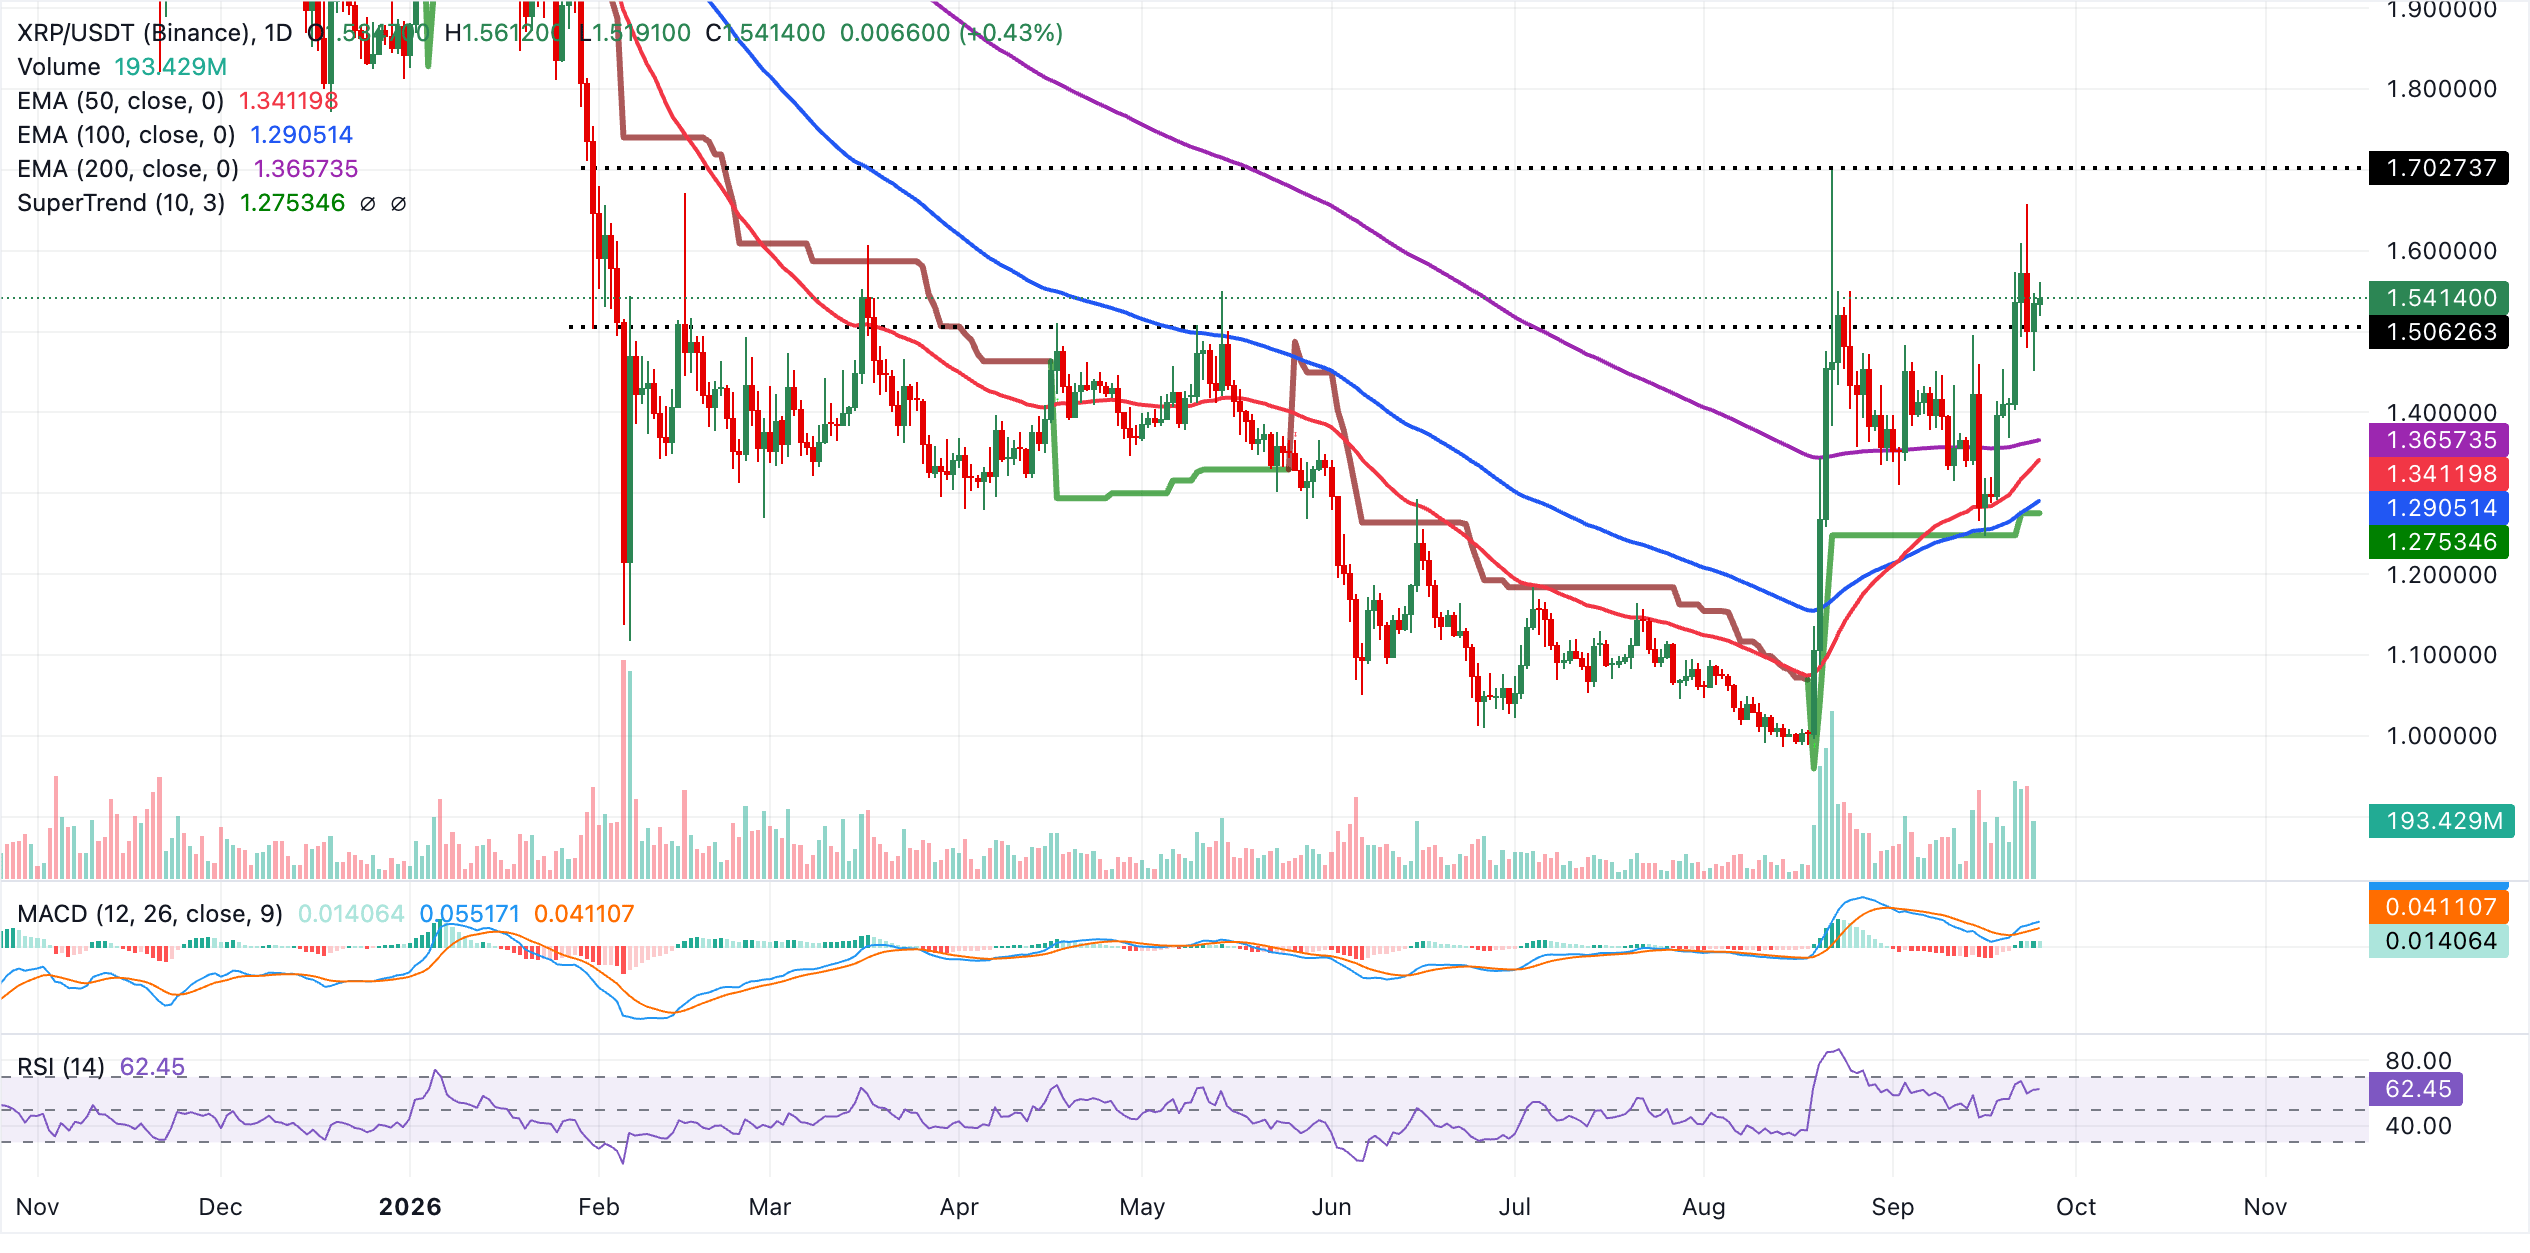
Immediate support is marked by the recent close around $1.54, with the 200-day EMA at $1.37 and the 50-day EMA at $1.34 forming a clustered demand zone on any deeper pullback. Below these, the SuperTrend baseline at $1.28 and the 100-day EMA at $1.29 provide additional structural support to the medium-term bullish setup, and only a sustained break beneath this band would hint at a more meaningful deterioration in the technical picture.
(The technical analysis of this story was written with the help of an AI tool. Know more.)
Bitcoin, altcoins, stablecoins FAQs
Bitcoin is the largest cryptocurrency by market capitalization, a virtual currency designed to serve as money. This form of payment cannot be controlled by any one person, group, or entity, which eliminates the need for third-party participation during financial transactions.
Altcoins are any cryptocurrency apart from Bitcoin, but some also regard Ethereum as a non-altcoin because it is from these two cryptocurrencies that forking happens. If this is true, then Litecoin is the first altcoin, forked from the Bitcoin protocol and, therefore, an “improved” version of it.
Stablecoins are cryptocurrencies designed to have a stable price, with their value backed by a reserve of the asset it represents. To achieve this, the value of any one stablecoin is pegged to a commodity or financial instrument, such as the US Dollar (USD), with its supply regulated by an algorithm or demand. The main goal of stablecoins is to provide an on/off-ramp for investors willing to trade and invest in cryptocurrencies. Stablecoins also allow investors to store value since cryptocurrencies, in general, are subject to volatility.
Bitcoin dominance is the ratio of Bitcoin's market capitalization to the total market capitalization of all cryptocurrencies combined. It provides a clear picture of Bitcoin’s interest among investors. A high BTC dominance typically happens before and during a bull run, in which investors resort to investing in relatively stable and high market capitalization cryptocurrency like Bitcoin. A drop in BTC dominance usually means that investors are moving their capital and/or profits to altcoins in a quest for higher returns, which usually triggers an explosion of altcoin rallies.
Bài viết đề xuất


