


Bitcoin Weekly Forecast: BTC consolidates gains as ETF inflows hit highest level since October 2025
- Bitcoin holds above $84,000 on Friday, up over 4% so far this week.
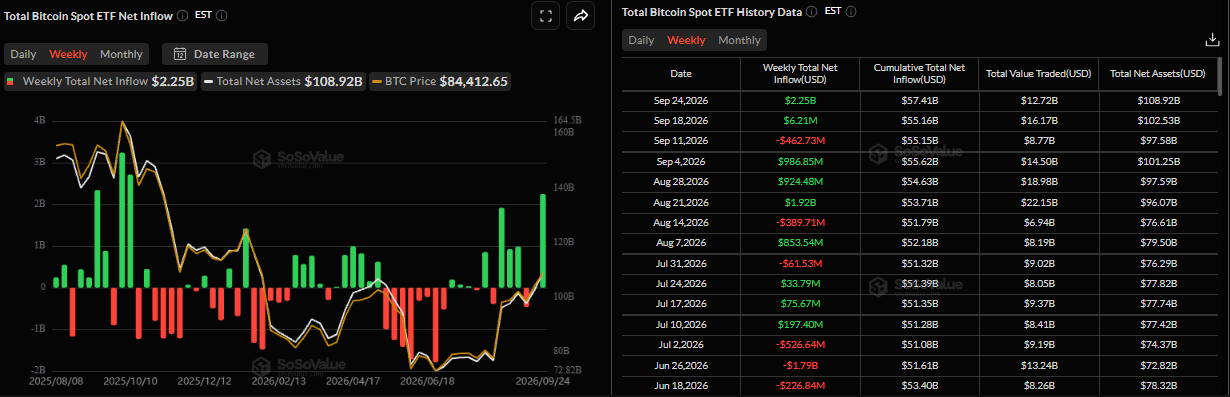
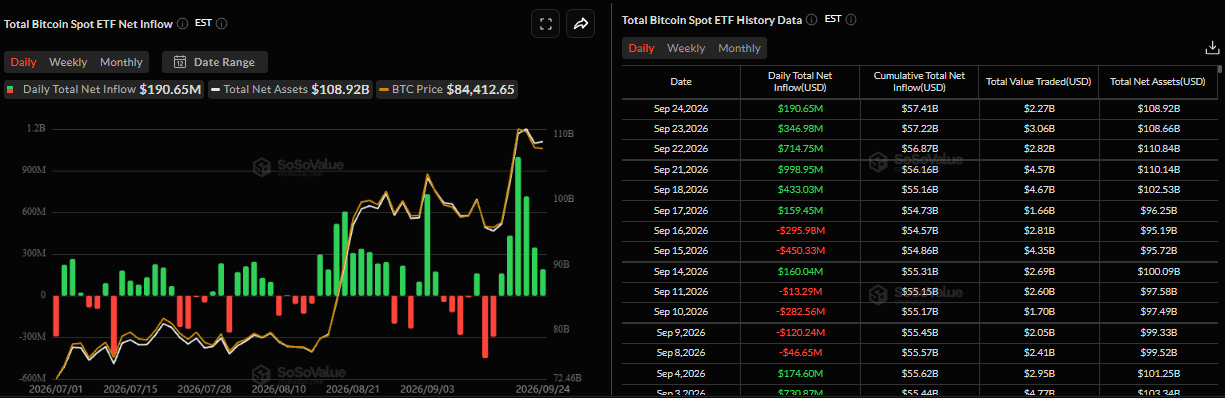
- US-listed spot ETFs recorded a net inflow of $2.25 billion through Thursday, the highest weekly inflow since October 2025.
- BTC’s break above a key long-term hurdle, along with a spike in the NPL metric to a one-year high, signals increased profit-taking following the recent rally.
Bitcoin (BTC) price holds above $84,000 at the time of writing on Friday as it consolidates gains of over 4% so far this week. Institutional demand supports the bullish outlook, with spot Exchange Traded Funds (ETFs) recording a net inflow of $2.25 billion through Thursday, pointing to the highest weekly inflow since October 2025.
Crypto King’s recent rally has surpassed its long-term technical hurdle; however, traders should remain cautious of a minor pullback as profit-taking activity hits a one-year high.
Billions in inflows
Bitcoin’s institutional demand supports its price this week. SoSoValue data showed that spot ETFs recorded a net inflow of $2.25 billion through Thursday, the highest weekly inflow since October 2025. Moreover, Monday’s inflow marked the largest single-day inflow since October 2025, indicating that institutional demand remains robust. If these inflows continue and intensify, BTC could extend the ongoing rally.
On the corporate side, the Bitcoin treasury company led by Michael Saylor added 950 BTC on Monday, bringing its total Bitcoin holdings to 846,000 BTC. These purchases signal a renewed focus on BTC accumulation by Strategy, supporting a bullish outlook.
In addition, on Thursday, Tuttle Capital Management (TCM), together with sub-adviser Strive Asset Management (SAM), announced the launch of the T-Strive Digital Credit Preferred Income ETF (DCAP). DCAP is an actively managed ETF that seeks current income by investing in preferred securities issued by Bitcoin treasury companies, which are corporations that hold Bitcoin as a core balance sheet asset. The fund does not invest directly in Bitcoin and is marketed as the first US “Digital Credit” ETF.
The launch represents another step in the financialization of Bitcoin, as traditional financial products are increasingly being built around corporate Bitcoin holdings. It also supports the longer-term trend of companies treating BTC as a treasury reserve asset.
Bitcoin outperforms Equities and Gold
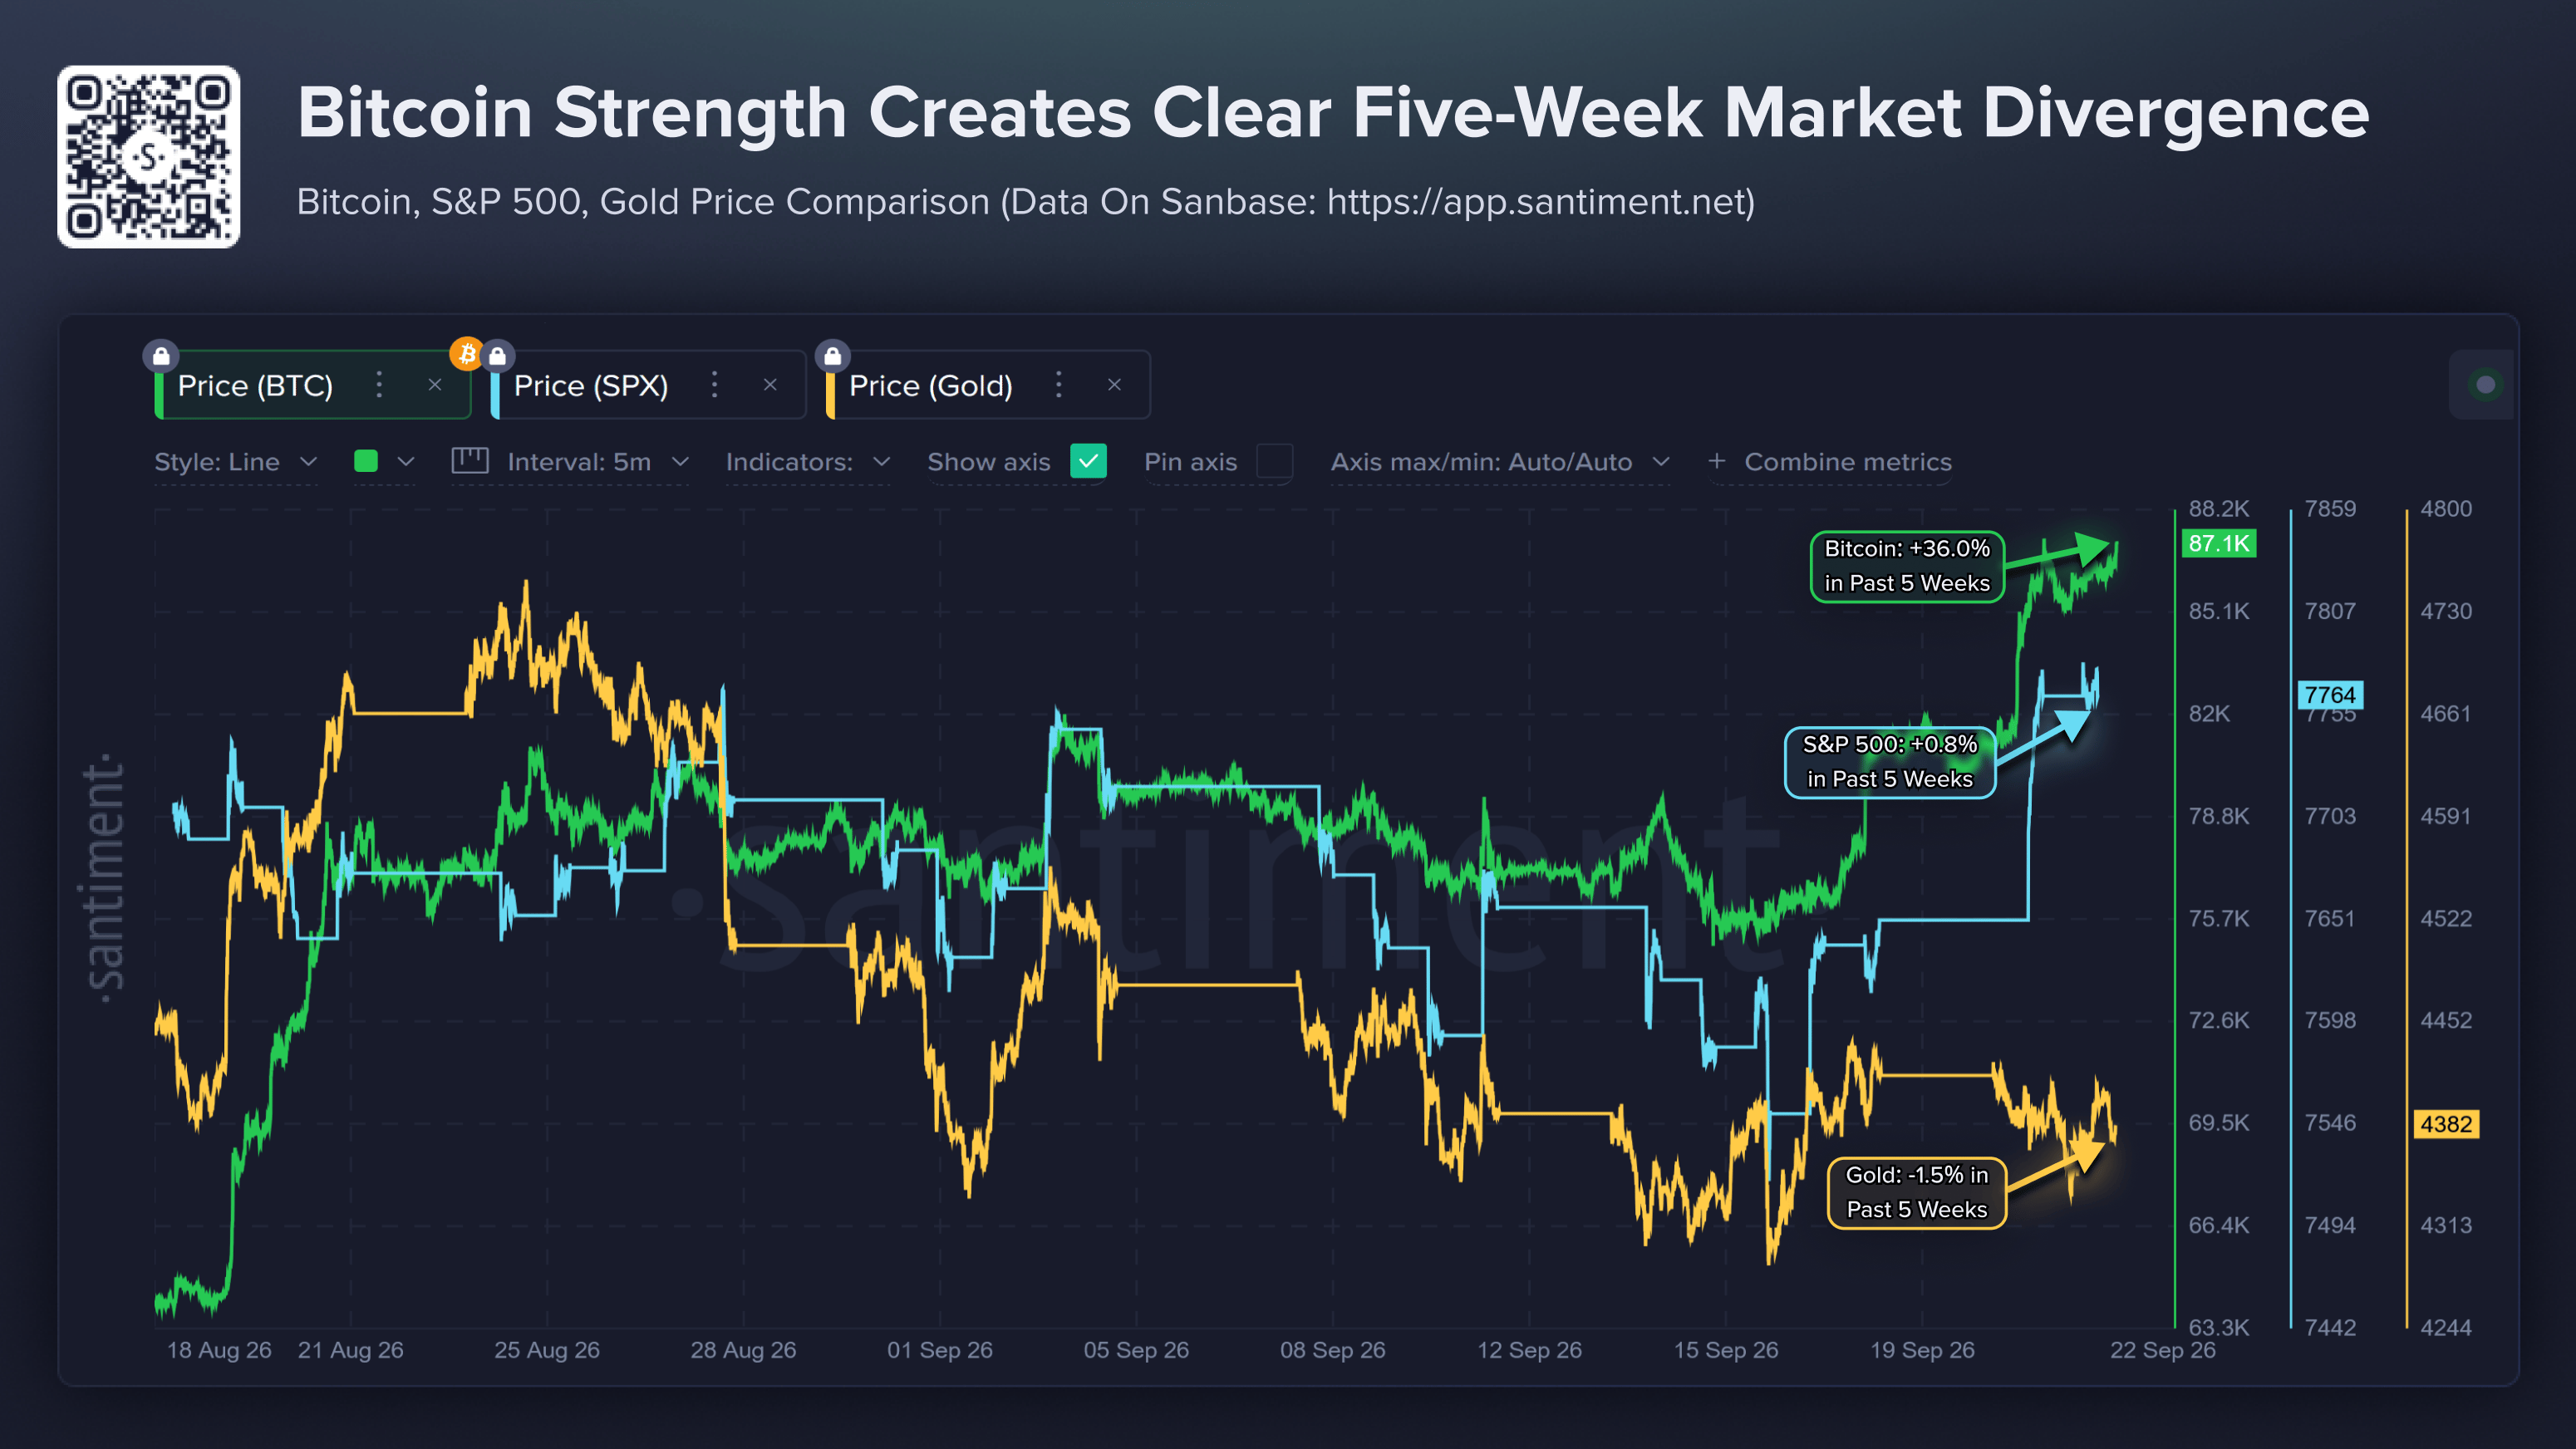
Santiment reported this week that “Crypto no longer living in Equities’ shadow,” highlighting a growing divergence between Bitcoin and traditional assets.
According to the report, BTC has increased by 36% since August 18, significantly outperforming the S&P 500’s 0.8% gain and Gold’s 1.5% decline over the same period.
The five-week divergence suggests Bitcoin has increasingly responded to crypto-specific catalysts rather than simply following equity performance. Meanwhile, Stocks remain near record levels but face elevated yields and uneven market participation, while Gold has weakened as markets price in tighter monetary policy for longer by the Federal Reserve (Fed).
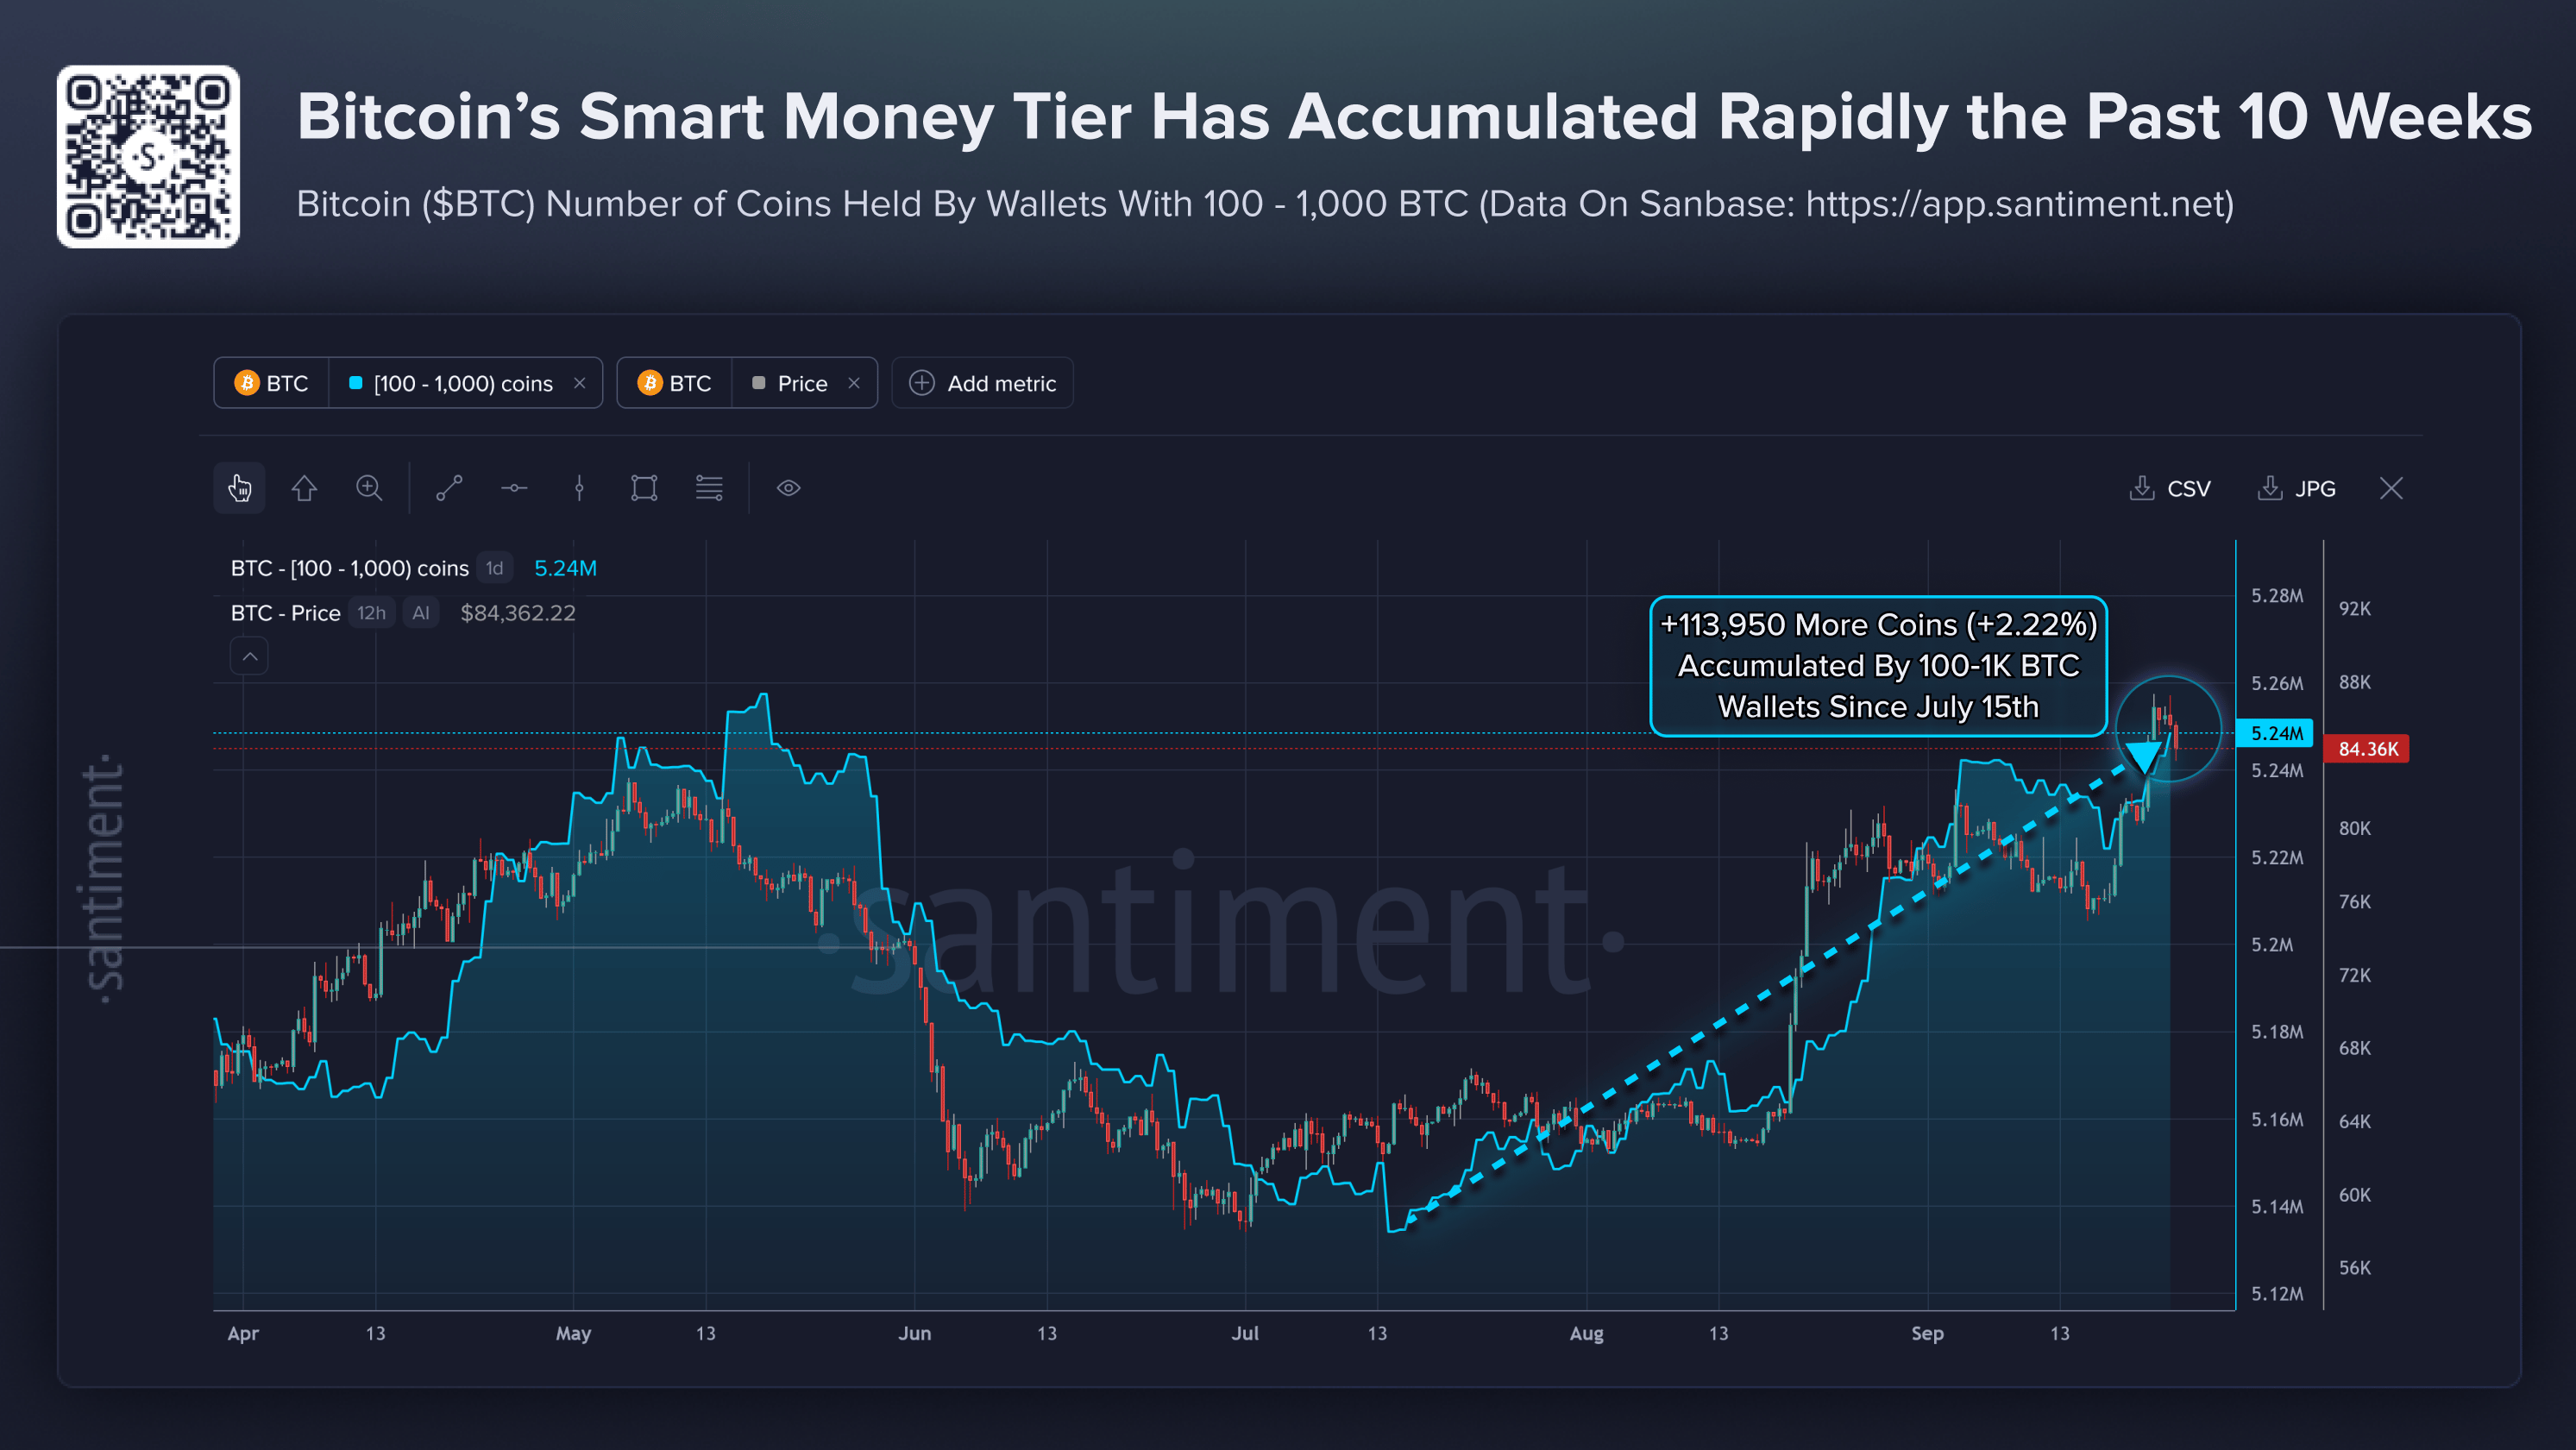
Moreover, wallets holding between 100 and 1,000 BTC have continued to accumulate, adding 113,950 BTC since July 15. Their collective holdings have increased by 2.22% to roughly 5.24 million BTC.
This wallet cohort has historically been one of the key smart-money groups to monitor. Santiment’s five-year analysis found that wallets holding 100–1,000 BTC have shown a notable correlation with broader crypto market direction, with accumulation periods often occurring ahead of or during stronger price moves.
The latest accumulation, as shown in the chart below, is particularly notable as it has continued alongside Bitcoin’s sharp recovery since mid-August. This suggests that the rally has been supported by larger, well-capitalized holders rather than being driven solely by retail demand. Continued buying from this group could provide important support if broader demand remains strong.
Profit-taking adds downside pressure to BTC
Bitcoin surged 6.7% at the start of this week on Monday, climbing to a high of $87,395, its highest level since the end of January, before profit-taking emerged.
BTC’s Network Realized Profit/Loss (NPL) metric spiked sharply on Monday, reaching its highest level since December 12, 2025. This spike indicates that holders are, on average, selling their bags at a significant profit, thereby increasing the selling pressure.
The rise in profit-taking has since weighed on the Crypto King’s price, with BTC falling to a low of $82,874 on Thursday before recovering slightly and trading around $84,600 at the time of writing on Friday.
 [11-1790328858900.18.46, 25 Sep, 2026].png)
Bitcoin technical outlook: Surpass key hurdle
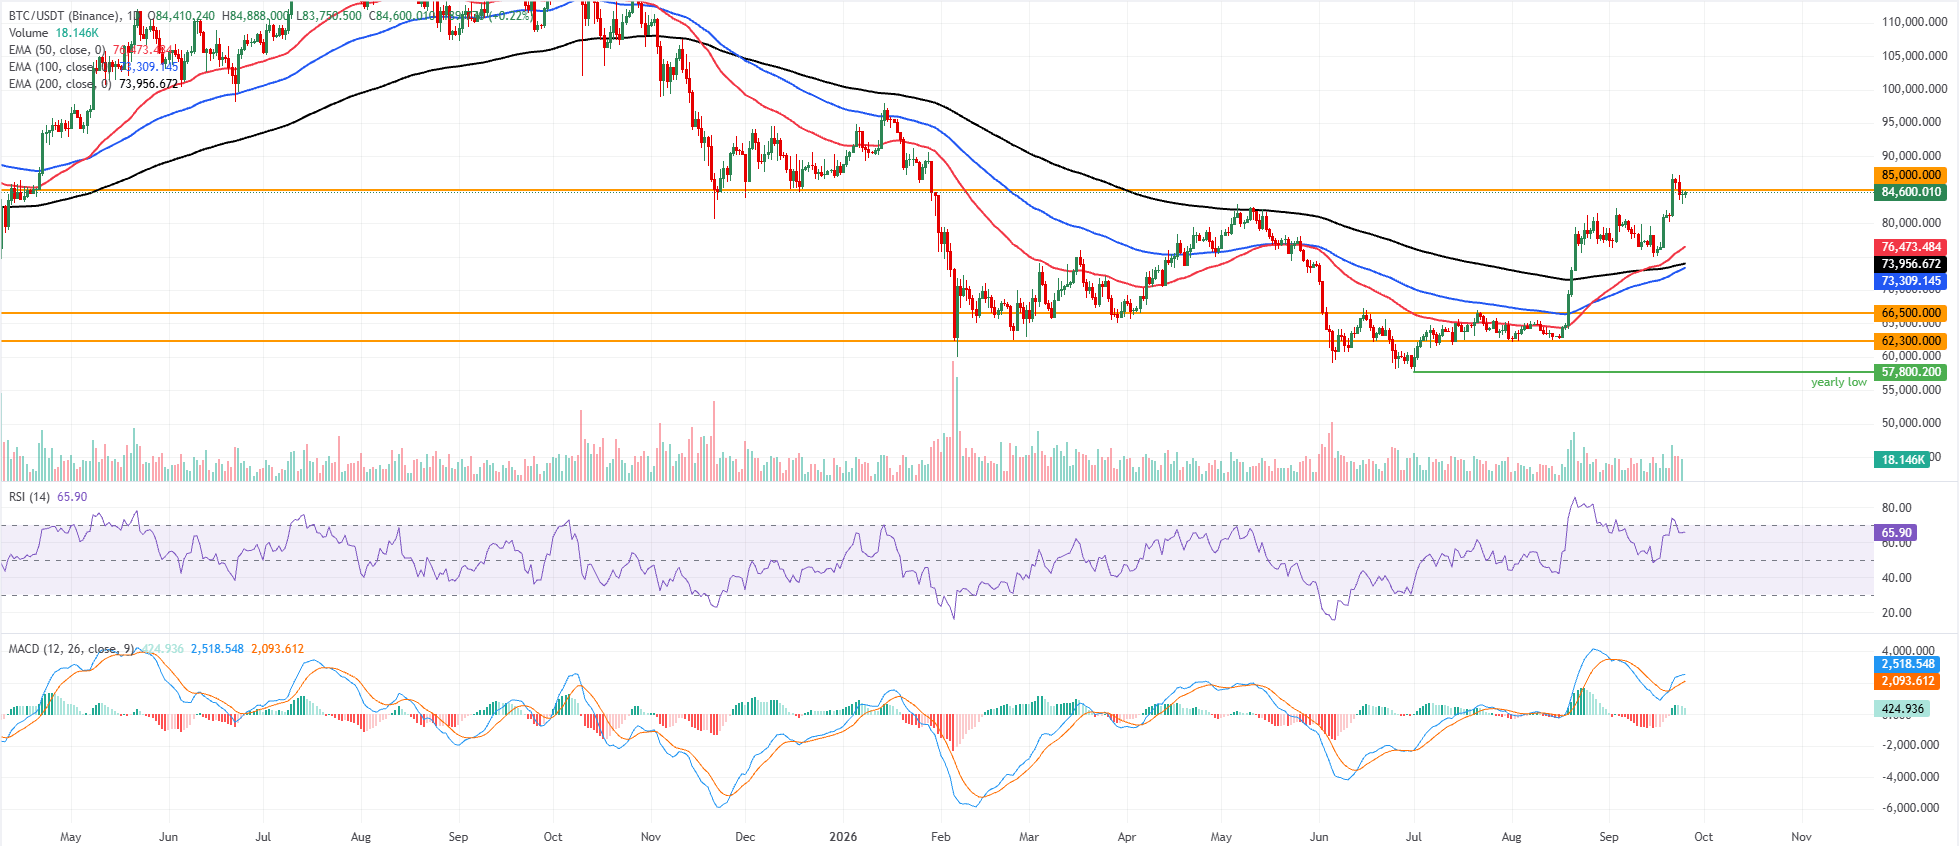
As explained in the previous report, “Why Bitcoin’s over 30% rebound doesn’t mean the bear market cycle is done,” BTC has now closed above the key technical hurdle, its 365-day moving average, currently around $80,300. The sustained move above this level strengthens the bullish technical outlook, while renewed spot demand and stronger institutional flows further confirm that the Crypto King’s rally is gaining momentum.
-1790328882310.png)
On the daily chart, BTC trades at $84,600 on Friday, extending its advance well above the 50-day, 100-day, and 200-day Exponential Moving Averages (EMAs) clustered between roughly $73,300 and $76,500, reinforcing a bullish near-term bias. The Relative Strength Index (RSI) at 65 stays in the bullish zone without being overbought, while the Moving Average Convergence Divergence (MACD) indicator holds in positive territory, hinting at persistent upward momentum as price approaches the horizontal resistance at $85,000.
On the topside, immediate resistance sits at $85,000 as mentioned, where a clear break would open the door to further gains beyond the recent highs.
On the downside, initial support is the 50-day EMA at $76,473, followed by the 200-day EMA at $73,956 and the 100-day EMA at $73,309; deeper pullbacks would expose the previously established horizontal floors at $66,500 and $62,300, which are likely to attract buyers on test.
(The technical analysis of this story was written with the help of an AI tool. Know more.)
Bitcoin, altcoins, stablecoins FAQs
Bitcoin is the largest cryptocurrency by market capitalization, a virtual currency designed to serve as money. This form of payment cannot be controlled by any one person, group, or entity, which eliminates the need for third-party participation during financial transactions.
Altcoins are any cryptocurrency apart from Bitcoin, but some also regard Ethereum as a non-altcoin because it is from these two cryptocurrencies that forking happens. If this is true, then Litecoin is the first altcoin, forked from the Bitcoin protocol and, therefore, an “improved” version of it.
Stablecoins are cryptocurrencies designed to have a stable price, with their value backed by a reserve of the asset it represents. To achieve this, the value of any one stablecoin is pegged to a commodity or financial instrument, such as the US Dollar (USD), with its supply regulated by an algorithm or demand. The main goal of stablecoins is to provide an on/off-ramp for investors willing to trade and invest in cryptocurrencies. Stablecoins also allow investors to store value since cryptocurrencies, in general, are subject to volatility.
Bitcoin dominance is the ratio of Bitcoin's market capitalization to the total market capitalization of all cryptocurrencies combined. It provides a clear picture of Bitcoin’s interest among investors. A high BTC dominance typically happens before and during a bull run, in which investors resort to investing in relatively stable and high market capitalization cryptocurrency like Bitcoin. A drop in BTC dominance usually means that investors are moving their capital and/or profits to altcoins in a quest for higher returns, which usually triggers an explosion of altcoin rallies.
Bài viết đề xuất


