

Solana Price Forecast: SOL extends rally as tokenized equity holders hit a record

Nguồn Fxstreet
  • Solana climbs above $111.70 on Monday after gaining nearly 12% last week.
  • SOL announced on X that its tokenized equity ecosystem hit a new all-time high, with 850,000 unique on-chain holders.
  • Improving momentum indicators and strengthening institutional demand support further gains in SOL.

Solana (SOL) extends its gains, trading above $111.70 at the time of writing on Monday after rallying nearly 12% last week. The bullish price action comes as growth in Solana’s tokenized equity ecosystem reaches a new milestone. Meanwhile, improving momentum indicators and strengthening institutional demand point to further gains in SOL.

Solana tokenized equities ecosystem reaches a new milestone

Solana announced on its official X post on Sunday that its tokenized equities hit a new all-time high (ATH) of 850,000 unique on-chain holders. This indicates continued growth in tokenized assets on the network, highlighting market confidence and growing participation, which could boost the SOL price in the long term.

Strengthening institutional demand

Institutional demand for Solana has strengthened. SoSoValue data showed that SOL Exchange-Traded Funds (ETFs) recorded an inflow of $13.19 million last week, marking 12 weeks of continued inflows since early July. If these inflows continue and intensify this week, SOL could extend gains.
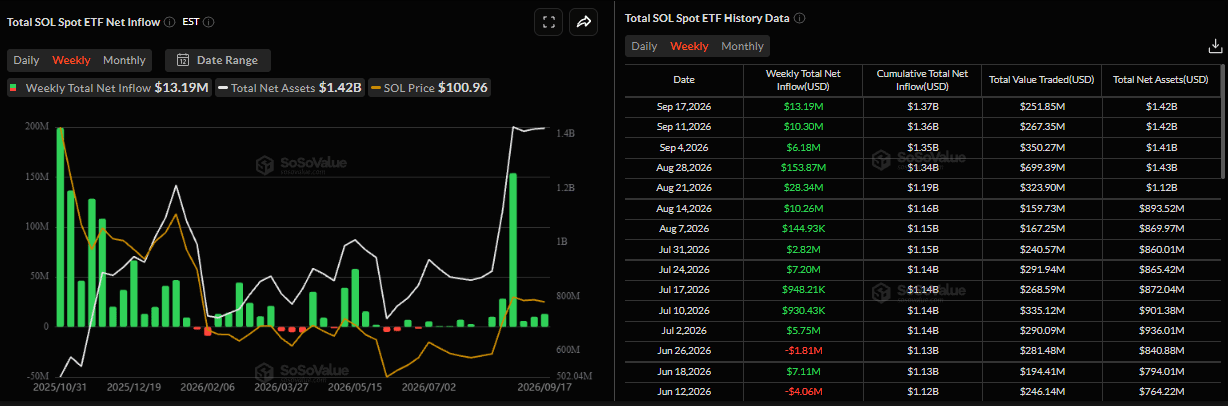
Total SOL spot ETF net inflow weekly chart. Source: SoSoValue

Solana technical outlook: Improving momentum indicators hint at higher highs

Solana price trades at $111.74 on Monday after gaining nearly 12% last week. SOL is maintaining a constructive bullish bias as it holds well above the 50-day, 100-day, and 200-day exponential moving averages (EMAs). The uptrend support line guiding the advance has been tested around the current region, while a firm close above recent highs sustains the broader upward structure. 

Momentum indicators support this stance, with the Relative Strength Index (RSI) hovering in the mid‑60s and the Moving Average Convergence Divergence (MACD) line above the signal line in positive territory, suggesting buyers still retain near‑term control.

On the downside, initial cushioning appears near the immediate pivot zone around $111. A deeper pullback would expose the horizontal support and the 50-day EMA clustered just below $96, ahead of the 200-day EMA near $93 and the 100-day EMA closer to $90. At the same time, a more pronounced correction could revisit the broader structural floor around $77. 

On the topside, bulls are aiming for the $120 mark, where a close above suggests further gains.
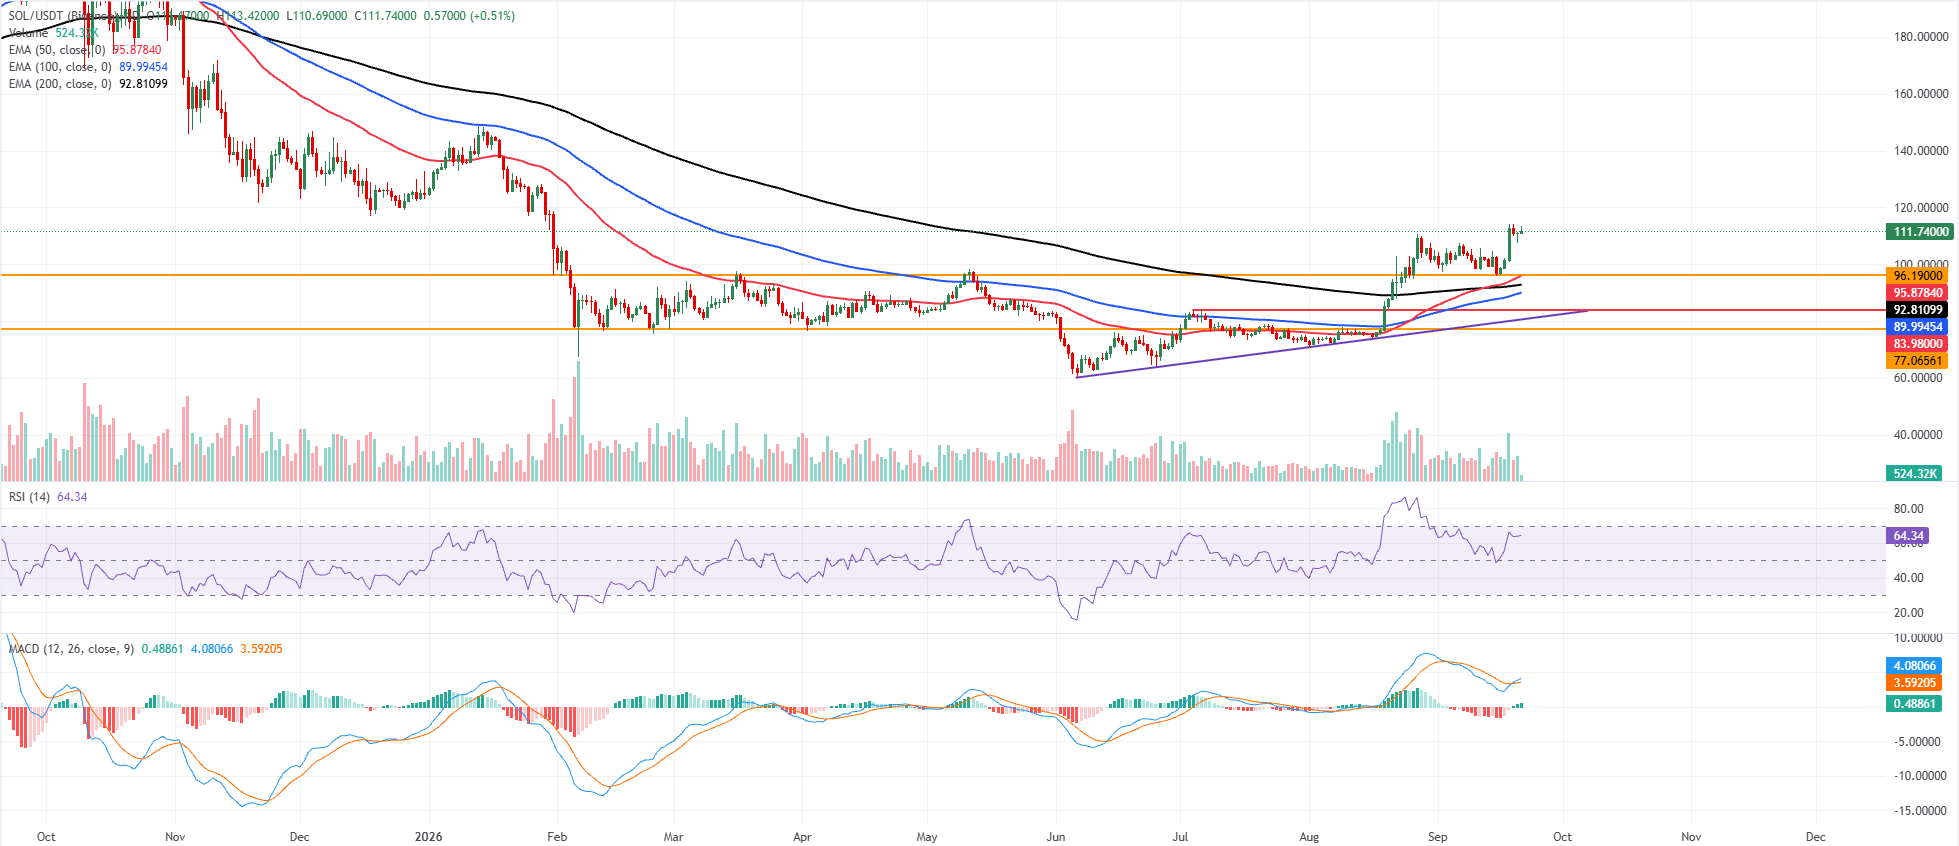
SOL/USDT daily chart

(The technical analysis of this story was written with the help of an AI tool. Know more.)

Tuyên bố miễn trừ trách nhiệm: Chỉ dành cho mục đích thông tin. Hiệu suất trong quá khứ không đảm bảo cho kết quả trong tương lai.
placeholder
Dự đoán giá BNB coin (Binance) 2024/2025/2026 Theo trang cryptopredictions.com, các chuyên gia đã dự báo giá Binance Coin (BNB) sẽ có giá trung bình 285 USD trong năm 2023. Tuy nhiên, giá BNB lại sẽ giao động từ 200 USD đến 300 USD trong năm 2024 . Trong năm 2025, giá sẽ tăng lên trên 400 USD cho 1 BNB Theo BeInCrypto, có những dự báo kỹ thuật cho giá BNB có thể đạt mức cao nhất là 468,66 USD vào cuối năm 2023, với mức trung bình là 411,30 USD và mức thấp nhất là 398,30 USD.
Tác giả  Nguyen Hoang Phu
ngày14 tháng 6 năm 2024
Theo trang cryptopredictions.com, các chuyên gia đã dự báo giá Binance Coin (BNB) sẽ có giá trung bình 285 USD trong năm 2023. Tuy nhiên, giá BNB lại sẽ giao động từ 200 USD đến 300 USD trong năm 2024 . Trong năm 2025, giá sẽ tăng lên trên 400 USD cho 1 BNB Theo BeInCrypto, có những dự báo kỹ thuật cho giá BNB có thể đạt mức cao nhất là 468,66 USD vào cuối năm 2023, với mức trung bình là 411,30 USD và mức thấp nhất là 398,30 USD.
placeholder
Forex hôm nay: Dữ liệu lạm phát từ Khu vực đồng euro và Mỹ làm tăng biến động thị trườngDưới đây là những thông tin bạn cần biết vào thứ Sáu, ngày 31 tháng 5:
Tác giả  FXStreet
ngày03 tháng 6 năm 2024
Dưới đây là những thông tin bạn cần biết vào thứ Sáu, ngày 31 tháng 5:
placeholder
Giá vàng thu thập động lực trên mức 4.600$ nhờ kế hoạch mua lại trái phiếu Kho bạc MỹGiá vàng (XAU/USD) tăng lực kéo lên quanh mức 4.625$ trong đầu giờ giao dịch châu Á vào thứ Hai. Kim loại quý này leo lên mức cao nhất kể từ ngày 15 tháng 5 khi kế hoạch hỗ trợ mua lại của Bộ Tài chính Mỹ đè nặng lên đồng đô la Mỹ (USD).
Tác giả  FXStreet
8 tháng 24 ngày Thứ Hai
Giá vàng (XAU/USD) tăng lực kéo lên quanh mức 4.625$ trong đầu giờ giao dịch châu Á vào thứ Hai. Kim loại quý này leo lên mức cao nhất kể từ ngày 15 tháng 5 khi kế hoạch hỗ trợ mua lại của Bộ Tài chính Mỹ đè nặng lên đồng đô la Mỹ (USD).
placeholder
Đồng yên Nhật tăng lên mức cao nhất kể từ ngày 18 tháng 2 khi dữ liệu tiền lương khả quan và GDP thúc đẩy kỳ vọng BoJ tăng lãi suấtCặp USD/JPY giảm trong ngày thứ hai liên tiếp – đồng thời đánh dấu ngày giảm thứ tư trong năm ngày qua – và rơi xuống mức thấp nhất kể từ ngày 18 tháng 2, quanh vùng giữa 153,00 trong phiên giao dịch châu Á vào thứ Ba.
Tác giả  FXStreet
9 tháng 08 ngày Thứ Ba
Cặp USD/JPY giảm trong ngày thứ hai liên tiếp – đồng thời đánh dấu ngày giảm thứ tư trong năm ngày qua – và rơi xuống mức thấp nhất kể từ ngày 18 tháng 2, quanh vùng giữa 153,00 trong phiên giao dịch châu Á vào thứ Ba.
placeholder
WTI giảm xuống gần 93,50$ khi hy vọng ngoại giao ở Trung Đông làm dịu lo ngại về nguồn cungGiá dầu West Texas Intermediate (WTI) tiếp tục chuỗi giảm sang ngày thứ tư liên tiếp, giao dịch quanh mức 93,60$/thùng trong giờ châu Á vào thứ Hai.
Tác giả  FXStreet
3 giờ trước
Giá dầu West Texas Intermediate (WTI) tiếp tục chuỗi giảm sang ngày thứ tư liên tiếp, giao dịch quanh mức 93,60$/thùng trong giờ châu Á vào thứ Hai.
sản phẩm liên quan
goTop
quote