


Bitcoin shows early signs of bottom despite lingering market stress
- Bitcoin has produced a second early bull signal, historically associated with periods when a market bottom forms before a sustained uptrend.
- BTC's 90-day correlation with gold has climbed from nearly -0.9 to around +0.7, reviving its digital-gold narrative.
- Long-term holders NUPL have entered negative territory, with losses still below historical capitulation levels seen during previous major Bitcoin cycle bottoms.
Bitcoin (BTC) is showing several signs of a potential market bottom as multiple indicators show improving market conditions, according to CryptoQuant analysts.
Bitcoin flashes second early bull signal
CryptoQuant data revealed that Bitcoin has produced a second early bull signal, a pattern that has historically appeared closer to market bottoms. The firm noted that another decline generally follows the first early bull signal, while the second signal has historically emerged when a bottom begins to form and an uptrend gets underway.
“A second early bull signal has appeared. This signifies another bottom signal,” analyst CW8900 wrote, citing CryptoQuant data.
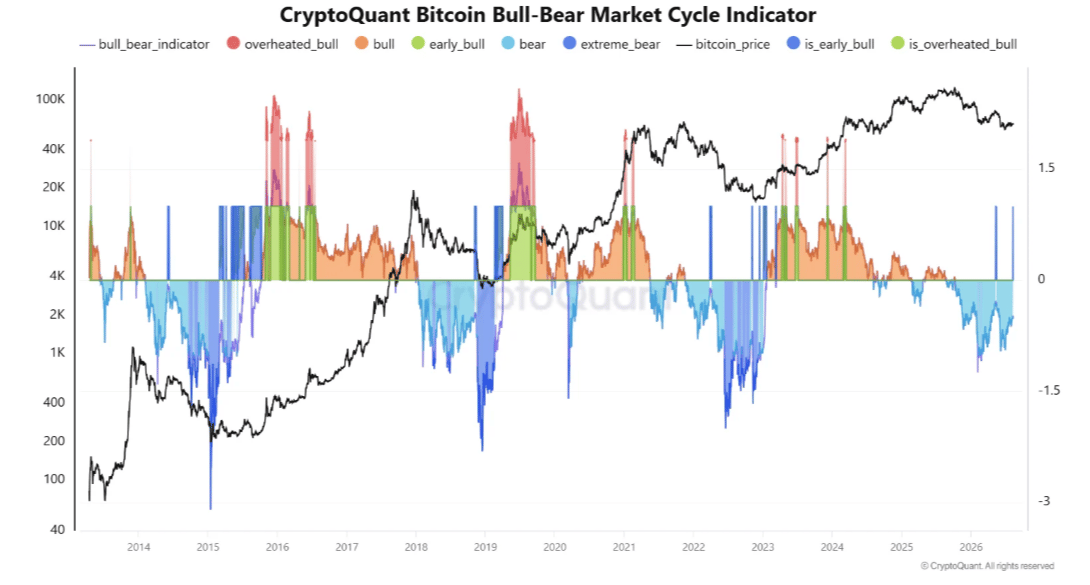
The analyst also highlighted the structure of the previous market rally. Bitcoin did not experience an overheated bull phase during its last rally, while the extreme bear phase during the subsequent decline was relatively short.
Meanwhile, BTC's 90-day correlation with Gold has rebounded from nearly -0.9 in early 2026 to around +0.7. CryptoQuant CEO Ki Young Ju described the current relationship as a return to “digital-gold-era levels.”
“The shift suggests Bitcoin is again being priced as a scarce, non-sovereign asset and a hedge against currency debasement, fiscal stress and geopolitical uncertainty,” CryptoQuant contributor XWIN wrote.
However, CryptoQuant cautioned that positive correlation with gold does not automatically mean Bitcoin is bullish. Both assets can move higher or lower together, while the 90-day correlation can also change as older data falls outside the measurement period.
“At times it moves with Nasdaq as a liquidity-sensitive risk asset; at others it follows gold as a scarcity asset. Its volatility, however, remains much higher,” XWIN added.
The analyst added that it is too early to conclude that Bitcoin has become a true haven.
Long-term holder losses point to bottom formation
The final indicator is the Net Unrealized Profit/Loss (NUPL), which revealed increasing pressure among Bitcoin’s long-term holder base. The metric signaled that long-term holder NUPL has fallen below the broader market average and entered negative territory, while Bitcoin remains roughly 50% below its cycle high.
“This suggests the market is no longer experiencing an ordinary correction; long-term capital is now being tested,” CryptoQuant contributor MorenoDV wrote in a Wednesday post on CryptoQuant.
Historically, major Bitcoin cycle bottoms have occurred when long-term holders were carrying deeper unrealized losses than the broader market. The current structure therefore resembles conditions seen during previous macro bottoms.
However, the analyst noted that the current level of losses remains less severe than in previous bottoms. LTH NUPL has not yet entered the “depression territory” associated with full capitulation.
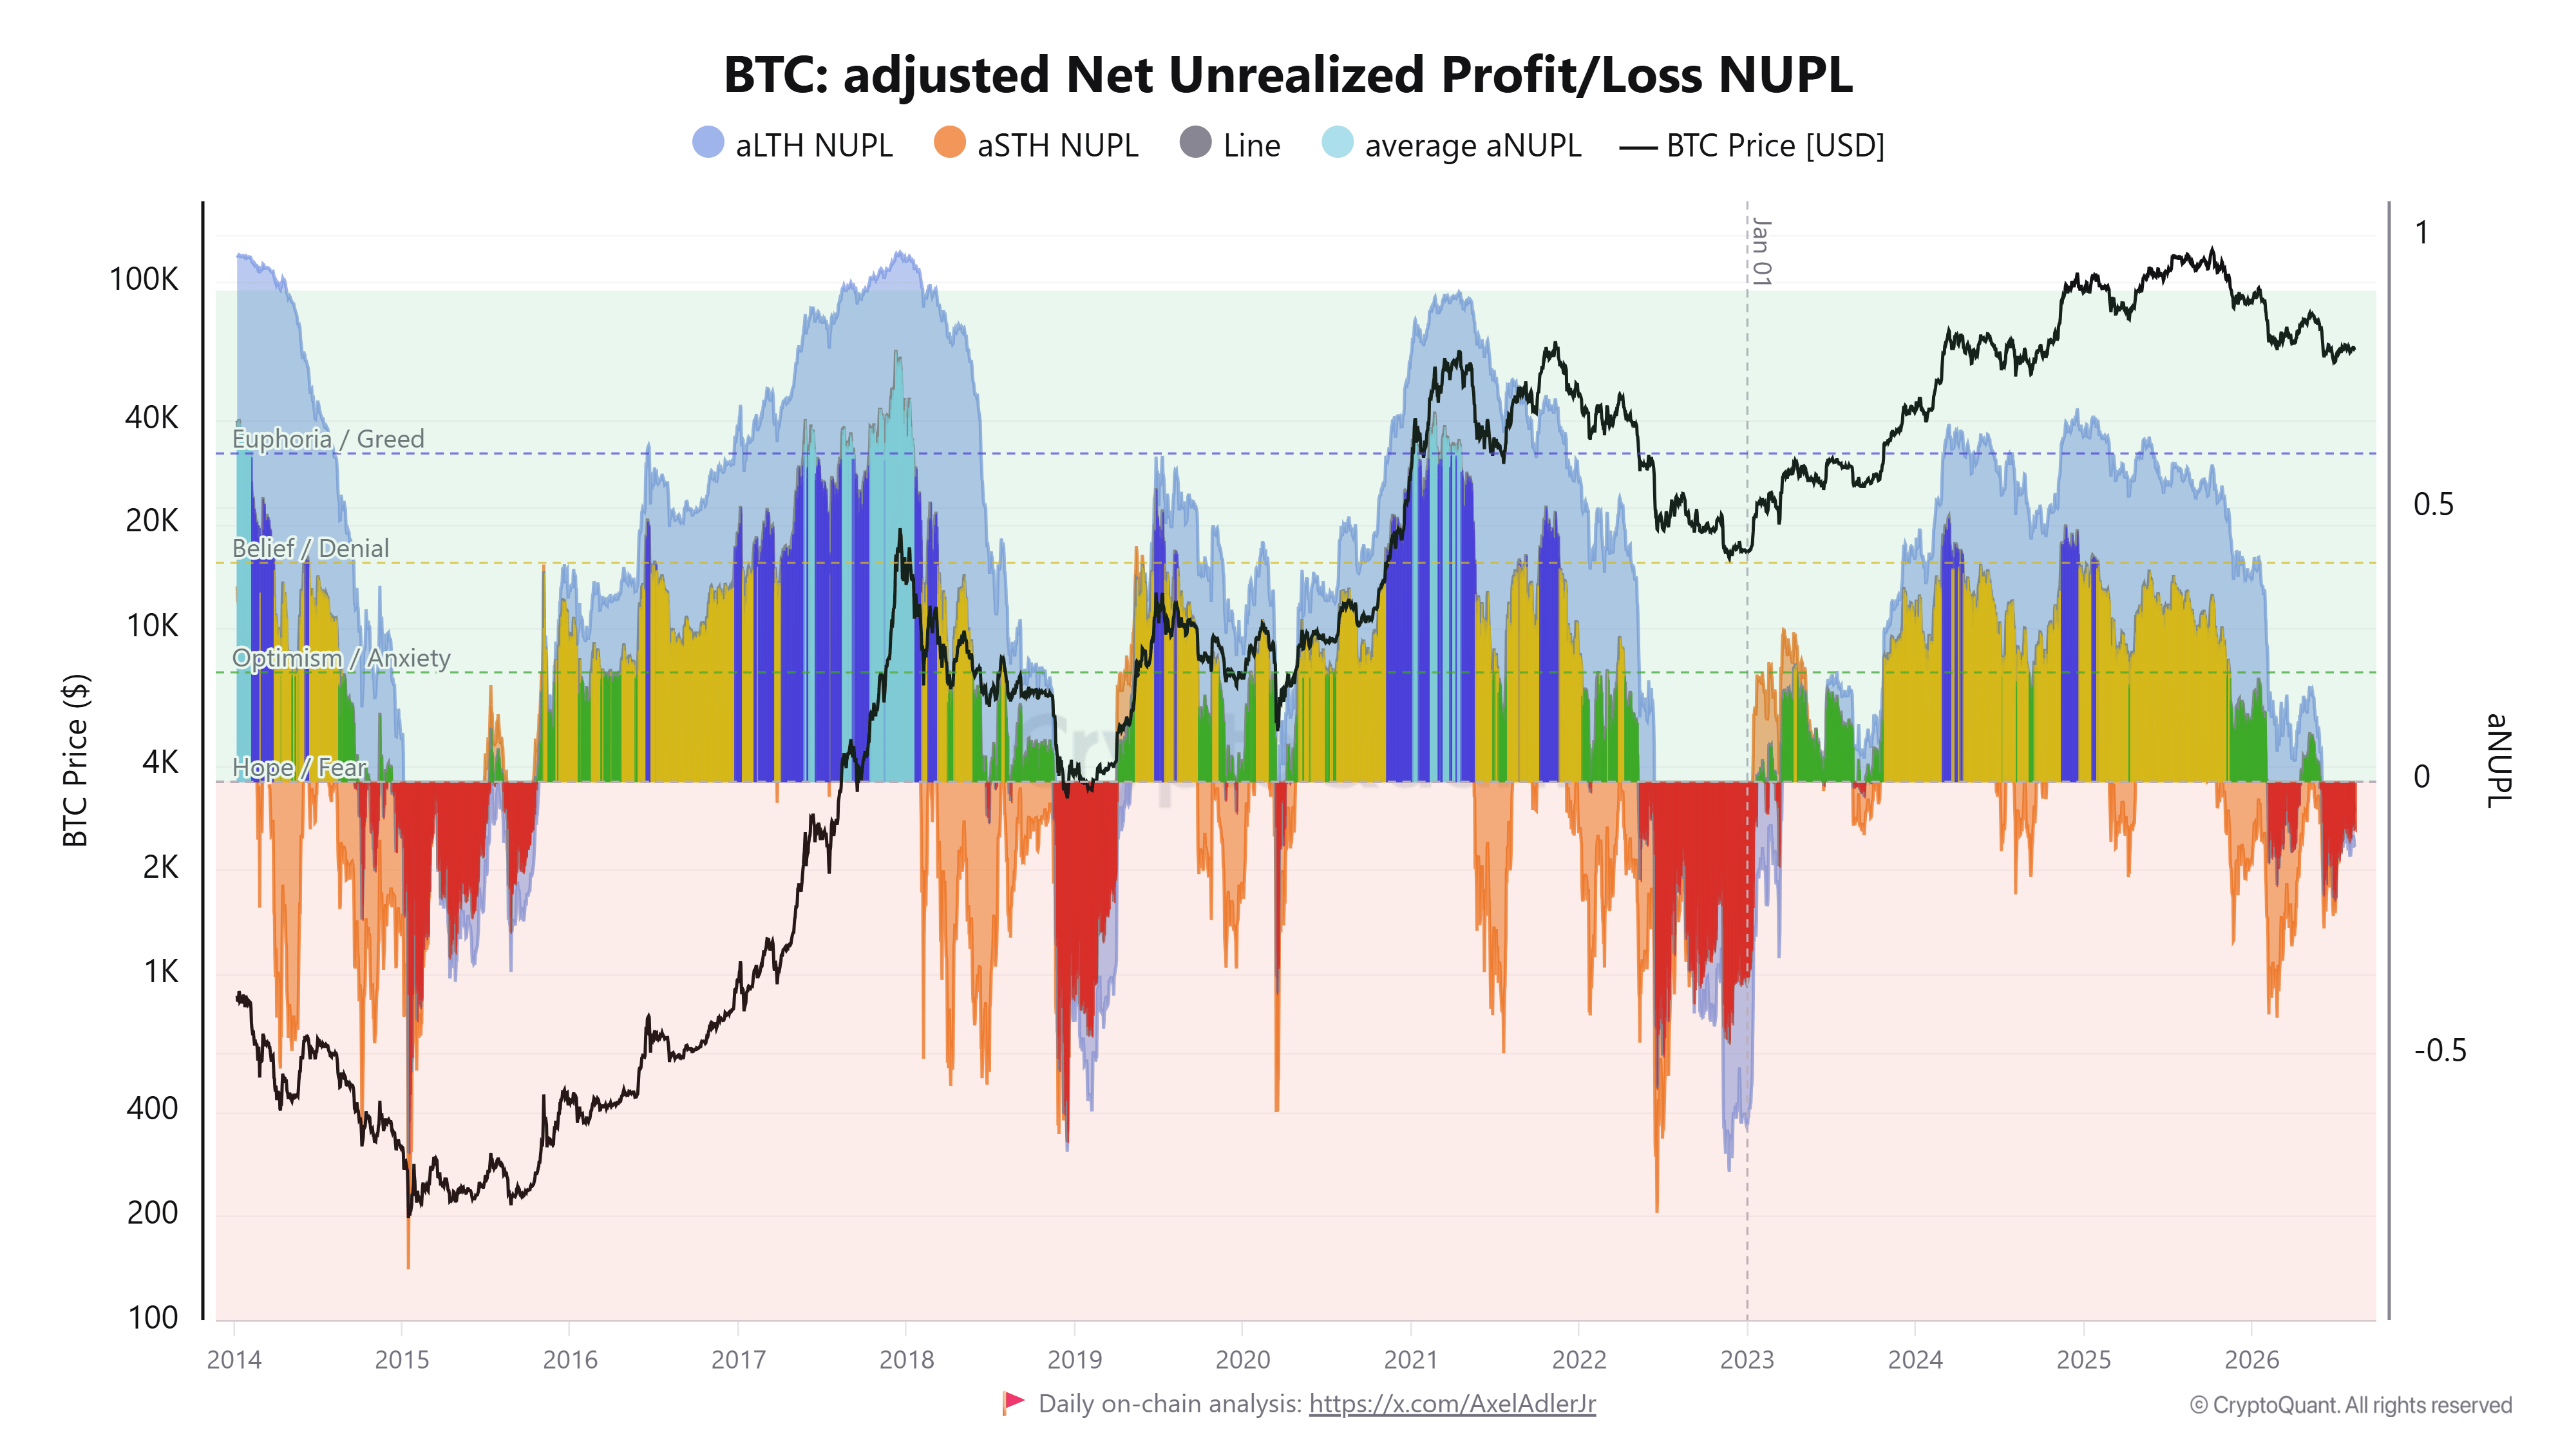
The analyst highlighted that current conditions suggest two possible outcomes. Bitcoin could experience another decline that pushes LTH losses toward historical extremes. On the other hand, institutional demand and a stronger holder base could absorb selling pressure earlier, allowing BTC to establish a bottom without another major capitulation event.
“A recovery toward zero while BTC holds a higher low would instead suggest that LTH stress has peaked and losses are being absorbed,” MorenoDV stated.
BTC is trading at $63,314, down 0.1% in the past 24 hours at the time of writing.
Bài viết đề xuất


