


Ripple Price Forecast: XRP lags recovery as exchange reserves expand
- XRP holds near the $1.00 support amid limited upside and a weak technical structure.
- Binance exchange reserves rise above 2.61 billion XRP, pointing to potentially higher selling pressure.
- XRP’s outlook remains bearish amid muted spot ETF inflows.
Ripple (XRP) is trading within a broadly constrained technical structure, with support at $1.00 and key moving averages limiting its recovery potential. In August, the remittance token declined by approximately 6.5%, extending its total pullback to around 14% from July's $1.18 peak. A drop below the key short-term support would further undermine recovery prospects.
XRP exchange reserves rise jeopardizing recovery
Binance exchange reserves have increased slightly above 2.61 billion XRP, valued at roughly $2.68 billion as of Tuesday. This represents a slight increase from approximately 2.607 billion XRP over the last seven days, pointing to higher available sell-side liquidity, which can mean a mild headwind to upside momentum, especially if the recovery is not supported by other demand signals.
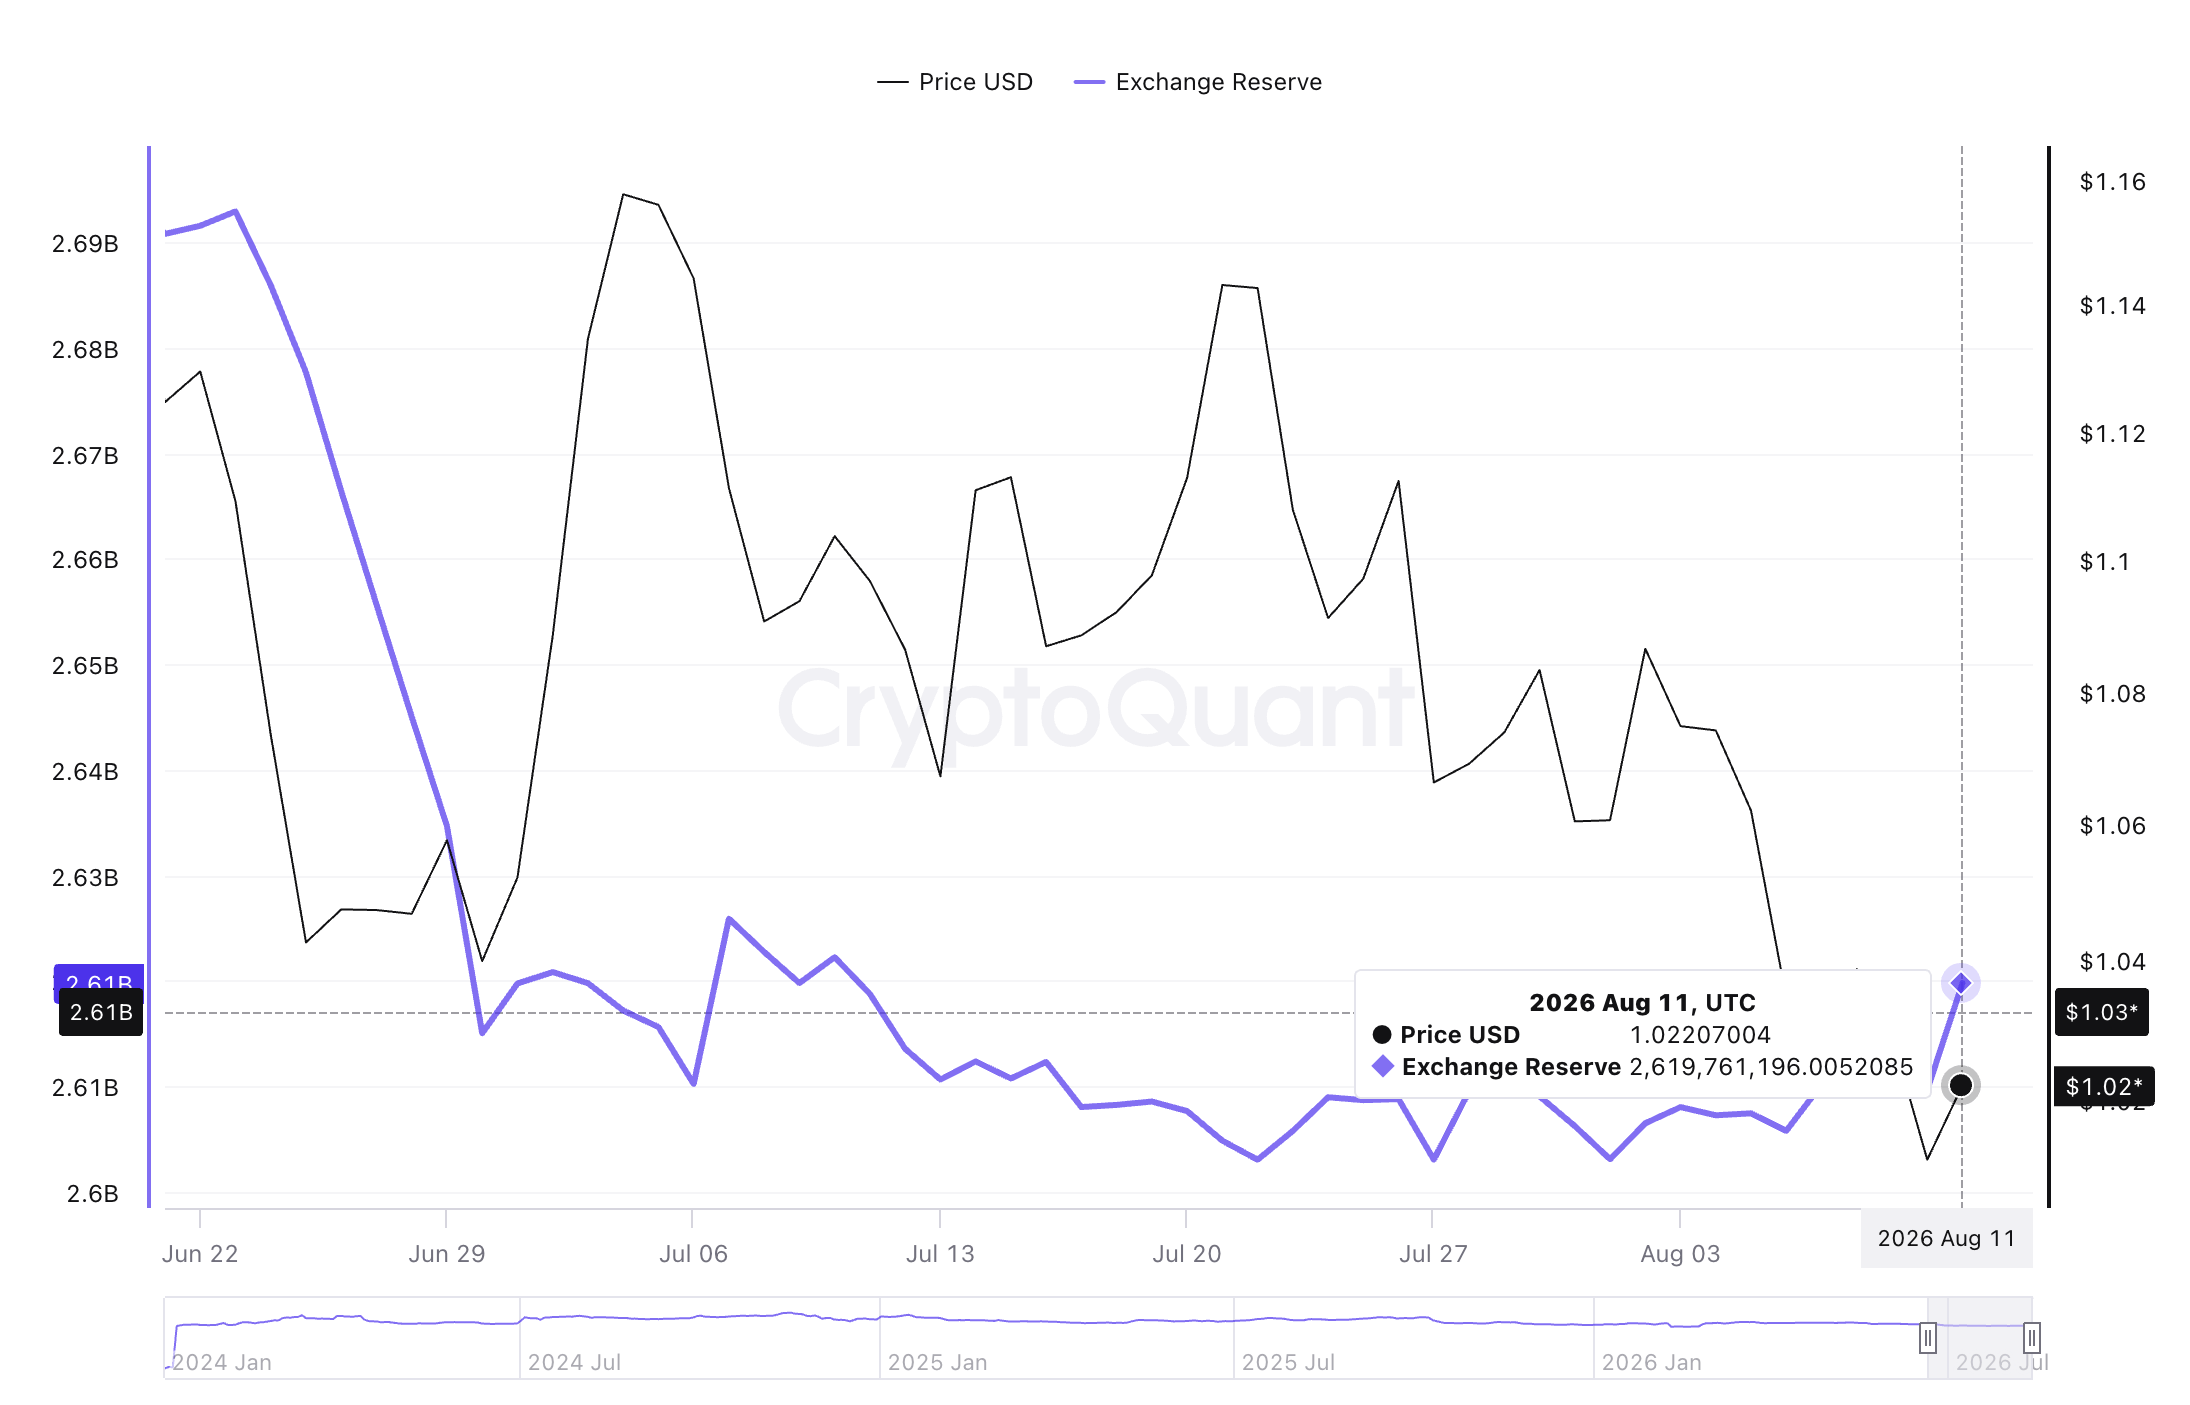
Rising exchange reserves amid price weakness generally signal distribution in the face of near-term selling pressure. As exchange reserves grow, price action around the critical $1.00 support will be pivotal in determining the next directional move.
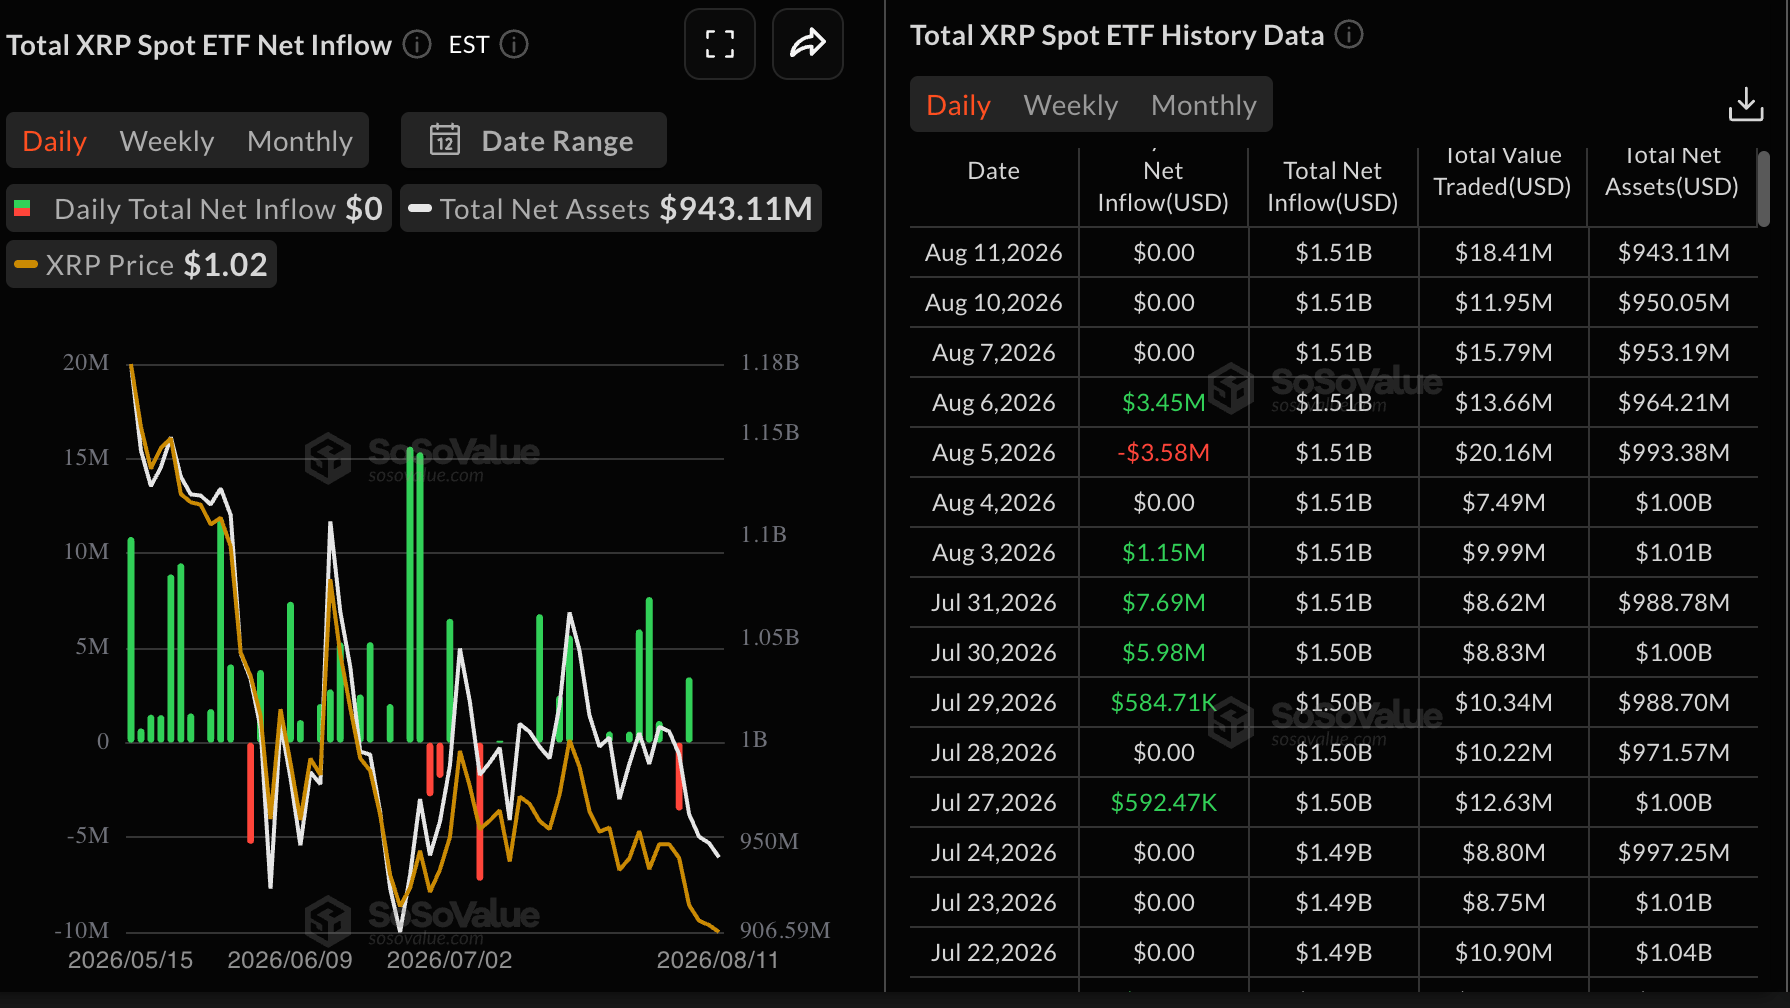
US-listed XRP spot Exchange-Traded Funds (ETFs) continue to underperform, with muted trading activity persisting through Friday, Monday and Tuesday. The absence of institutional participation underscores prevailing bearish sentiment across the crypto sector, diminishing prospects for a sustained recovery. However, cumulative inflows remain stable at $1.51 billion, while assets under management stand at $943 million, underpinning investors’ long-term positive outlook in the underlying asset.
Technical analysis: XRP tests $1.00 lifeline support
XRP remains under clear bearish pressure as price is capped beneath the 50-day Exponential Moving Average (EMA) at $1.09, the 100-day EMA at $1.18 and the 200-day EMA at $1.37, keeping the broader trend downside-biased. The spot price also sits below the Bollinger Bands middle boundary at $1.06 and the upper layer near $1.12, reinforcing the idea of a subdued recovery attempt.
At the same time, the Moving Average Convergence Divergence (MACD) indicator prints the histogram in negative territory, and the Relative Strength Index (RSI) hovers around 38, hinting at persistent bearish momentum rather than an oversold capitulation.
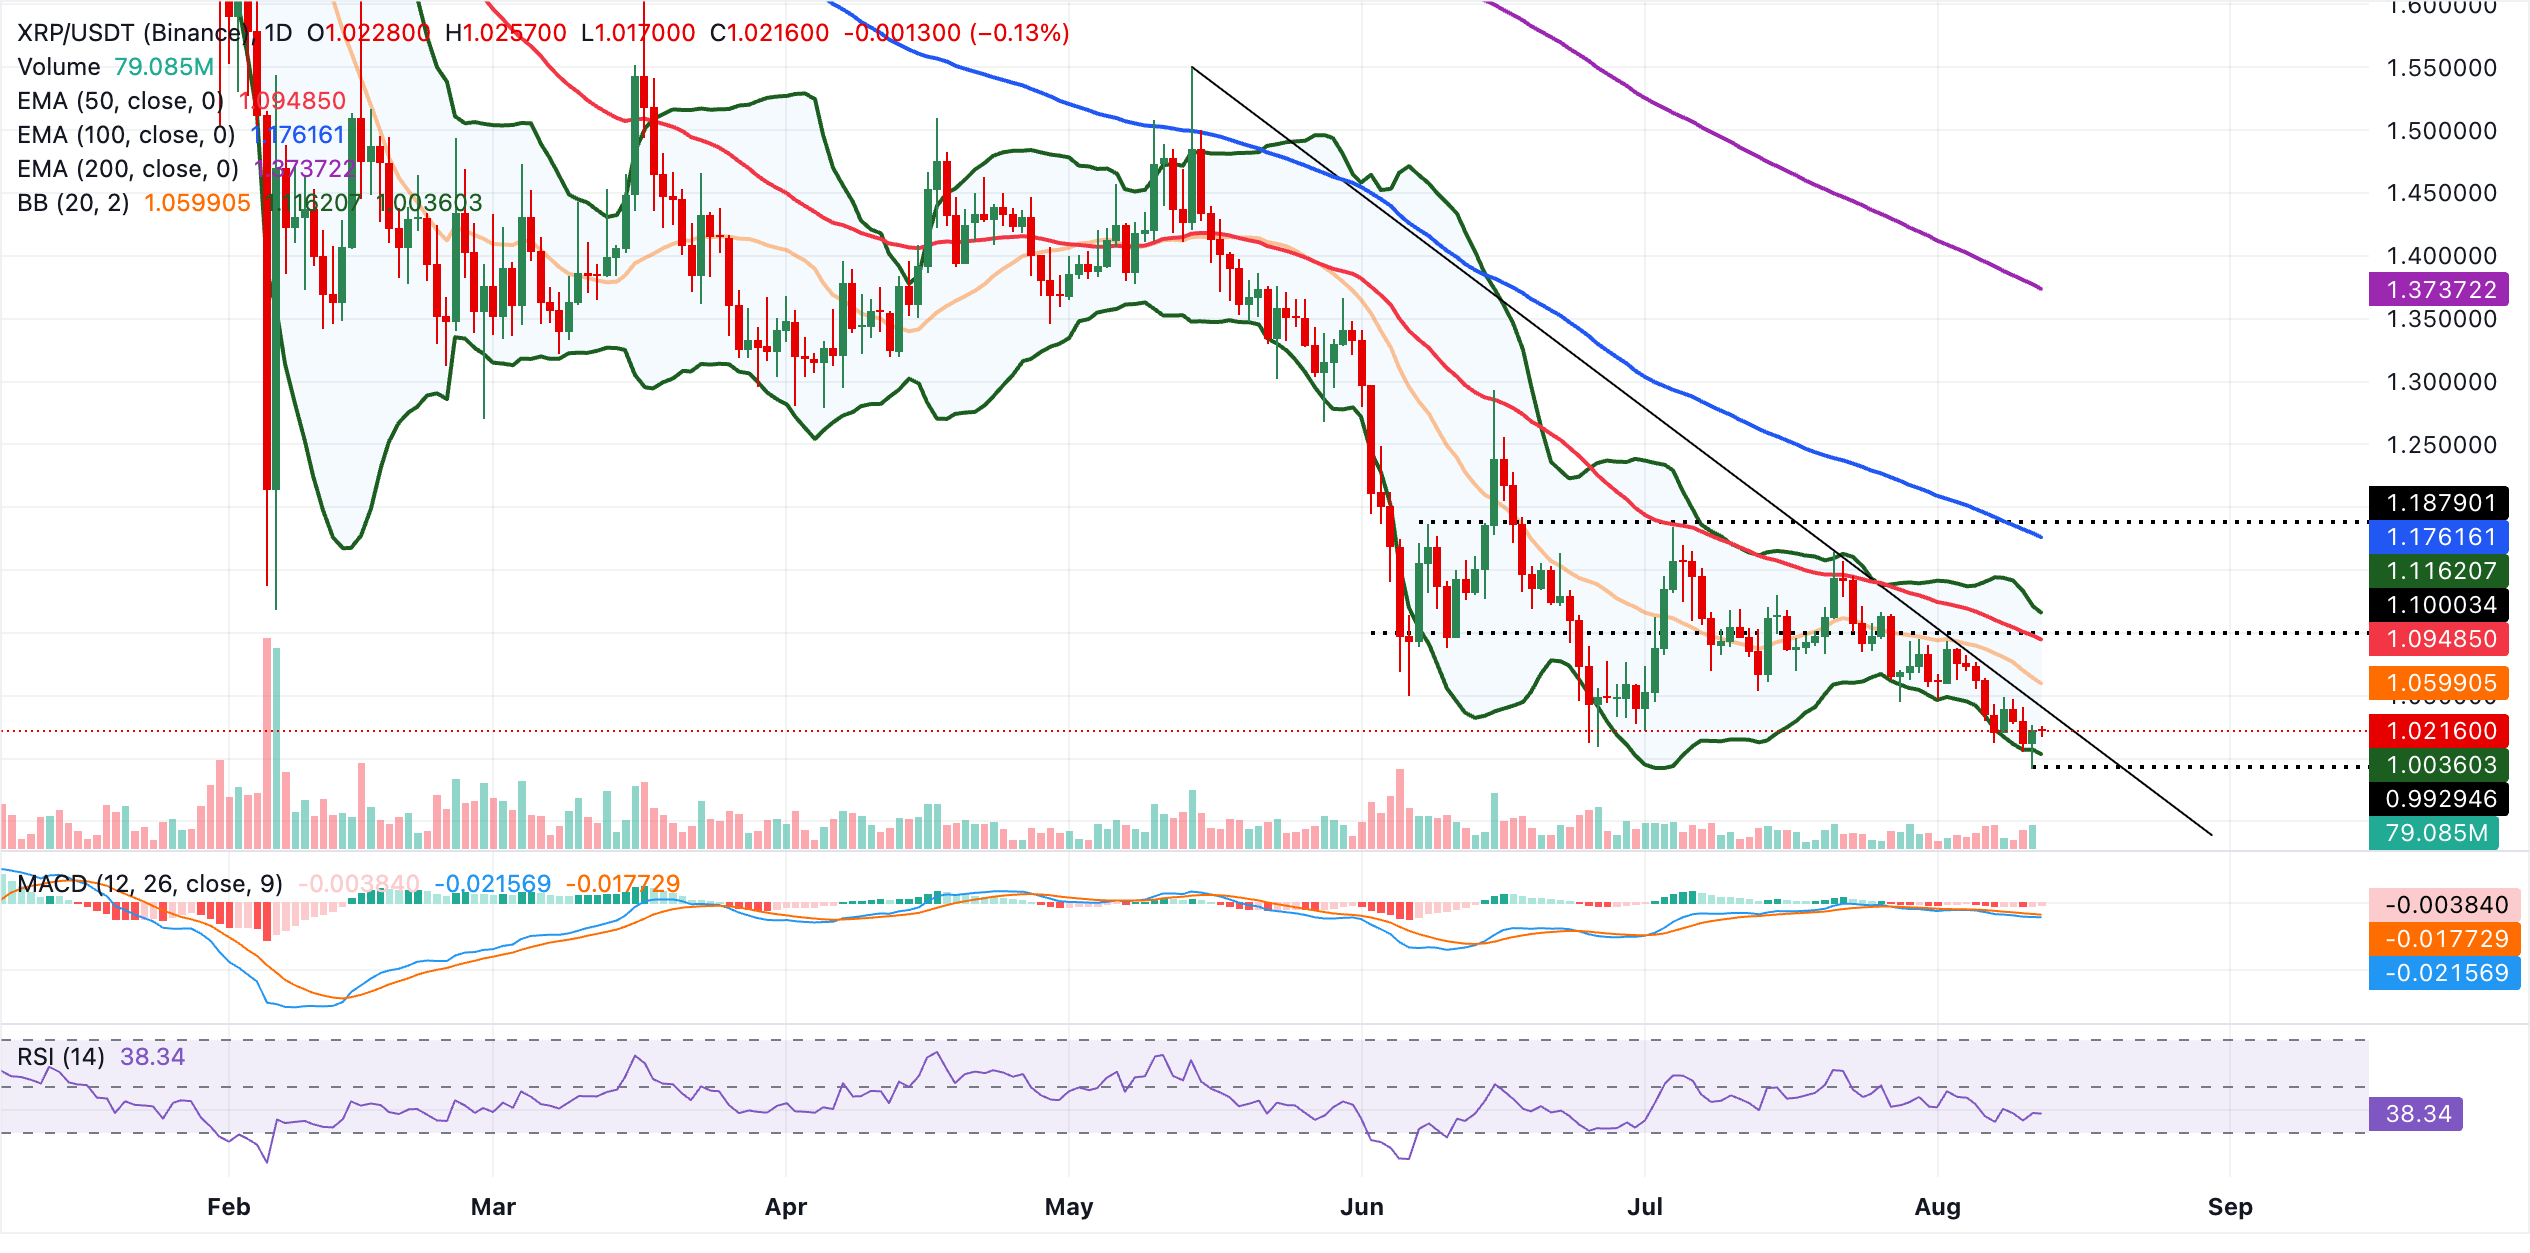
Initial resistance emerges at the broken downward trendline area around $1.04, followed by the Bollinger middle boundary at $1.06 and the 50-day EMA at $1.09, which together form a dense barrier zone ahead of the upper Bollinger band at $1.12. Above these, the 100-day EMA at $1.18 and the 200-day EMA near $1.37 remain key levels that would need to be reclaimed to neutralize the broader downtrend.
On the downside, immediate support is provided by the Bollinger lower band at $1.00, and a clear break below this level would expose the pair to further losses and extend the current bearish phase.
(The technical analysis of this story was written with the help of an AI tool. Know more.)
Open Interest, funding rate FAQs
Higher Open Interest is associated with higher liquidity and new capital inflow to the market. This is considered the equivalent of increase in efficiency and the ongoing trend continues. When Open Interest decreases, it is considered a sign of liquidation in the market, investors are leaving and the overall demand for an asset is on a decline, fueling a bearish sentiment among investors.
Funding fees bridge the difference between spot prices and prices of futures contracts of an asset by increasing liquidation risks faced by traders. A consistently high and positive funding rate implies there is a bullish sentiment among market participants and there is an expectation of a price hike. A consistently negative funding rate for an asset implies a bearish sentiment, indicating that traders expect the cryptocurrency’s price to fall and a bearish trend reversal is likely to occur.
Bài viết đề xuất


