


Top Altcoins Price Forecast: Ripple hits 20-month low as Cardano and Solana lack momentum
- Ripple hovers around $1.01 on Tuesday, after hitting a 20-month low the previous day around $1.00.
- Cardano edges lower for the fifth consecutive day, heading toward the 50-day EMA at $0.1803.
- Solana remains capped beneath a crucial 50% retracement level at $76.92 and the 100-day EMA at $78.46.
Top altcoins, including Ripple (XRP), Cardano (ADA), and Solana (SOL), are maintaining a bearish tone as the broader market remains risk-averse. XRP is down to a 20-month low, risking a drop below the $1.00 psychological threshold, while ADA and SOL risk losing their recent gains amid a lack of upside momentum.
Technical outlook: XRP, ADA, and SOL continue to face downside pressure
Ripple hovers around $1.01 at press time on Tuesday, extending a bearish bias. Price holds the 50-day Exponential Moving Average (EMA) at $1.09, which is the first cap on the topside, reinforced by the 100-day EMA at $1.17 and the 200-day EMA at $1.37, marking deeper overhead supply.
Momentum is weak, as the Relative Strength Index (RSI) at 36 hovers close to the oversold boundary, while the Moving Average Convergence Divergence (MACD) remains below the signal line in negative territory, suggesting that downside pressure remains dominant.
On the downside, immediate support is located at the horizontal level near $1.00, reinforced by the S1 Pivot level at $0.99, where buyers could attempt to defend the recent pullback. A slip below this zone could extend the decline toward the S2 Pivot level near $0.92.
On the topside, a sustained recovery would first need to clear the 50-day EMA at $1.09 to reinstate a short-term recovery.
Cardano hovers around $0.1906 on Tuesday, holding above the 50-day EMA at $0.1804 while still capped below the 100-day EMA at $0.1971. This placement suggests a neutral-to-bullish near-term bias.
The path of least resistance for ADA targets the 50-day EMA at $0.1804 as the immediate target, followed by the rising support trendline near $0.1607 as a more distant structural floor if sellers regain control.
The RSI at about 58 leans toward a corrective phase as it reverses toward the midline, while the MACD risks crossing below its signal line, hinting at declining upside momentum.
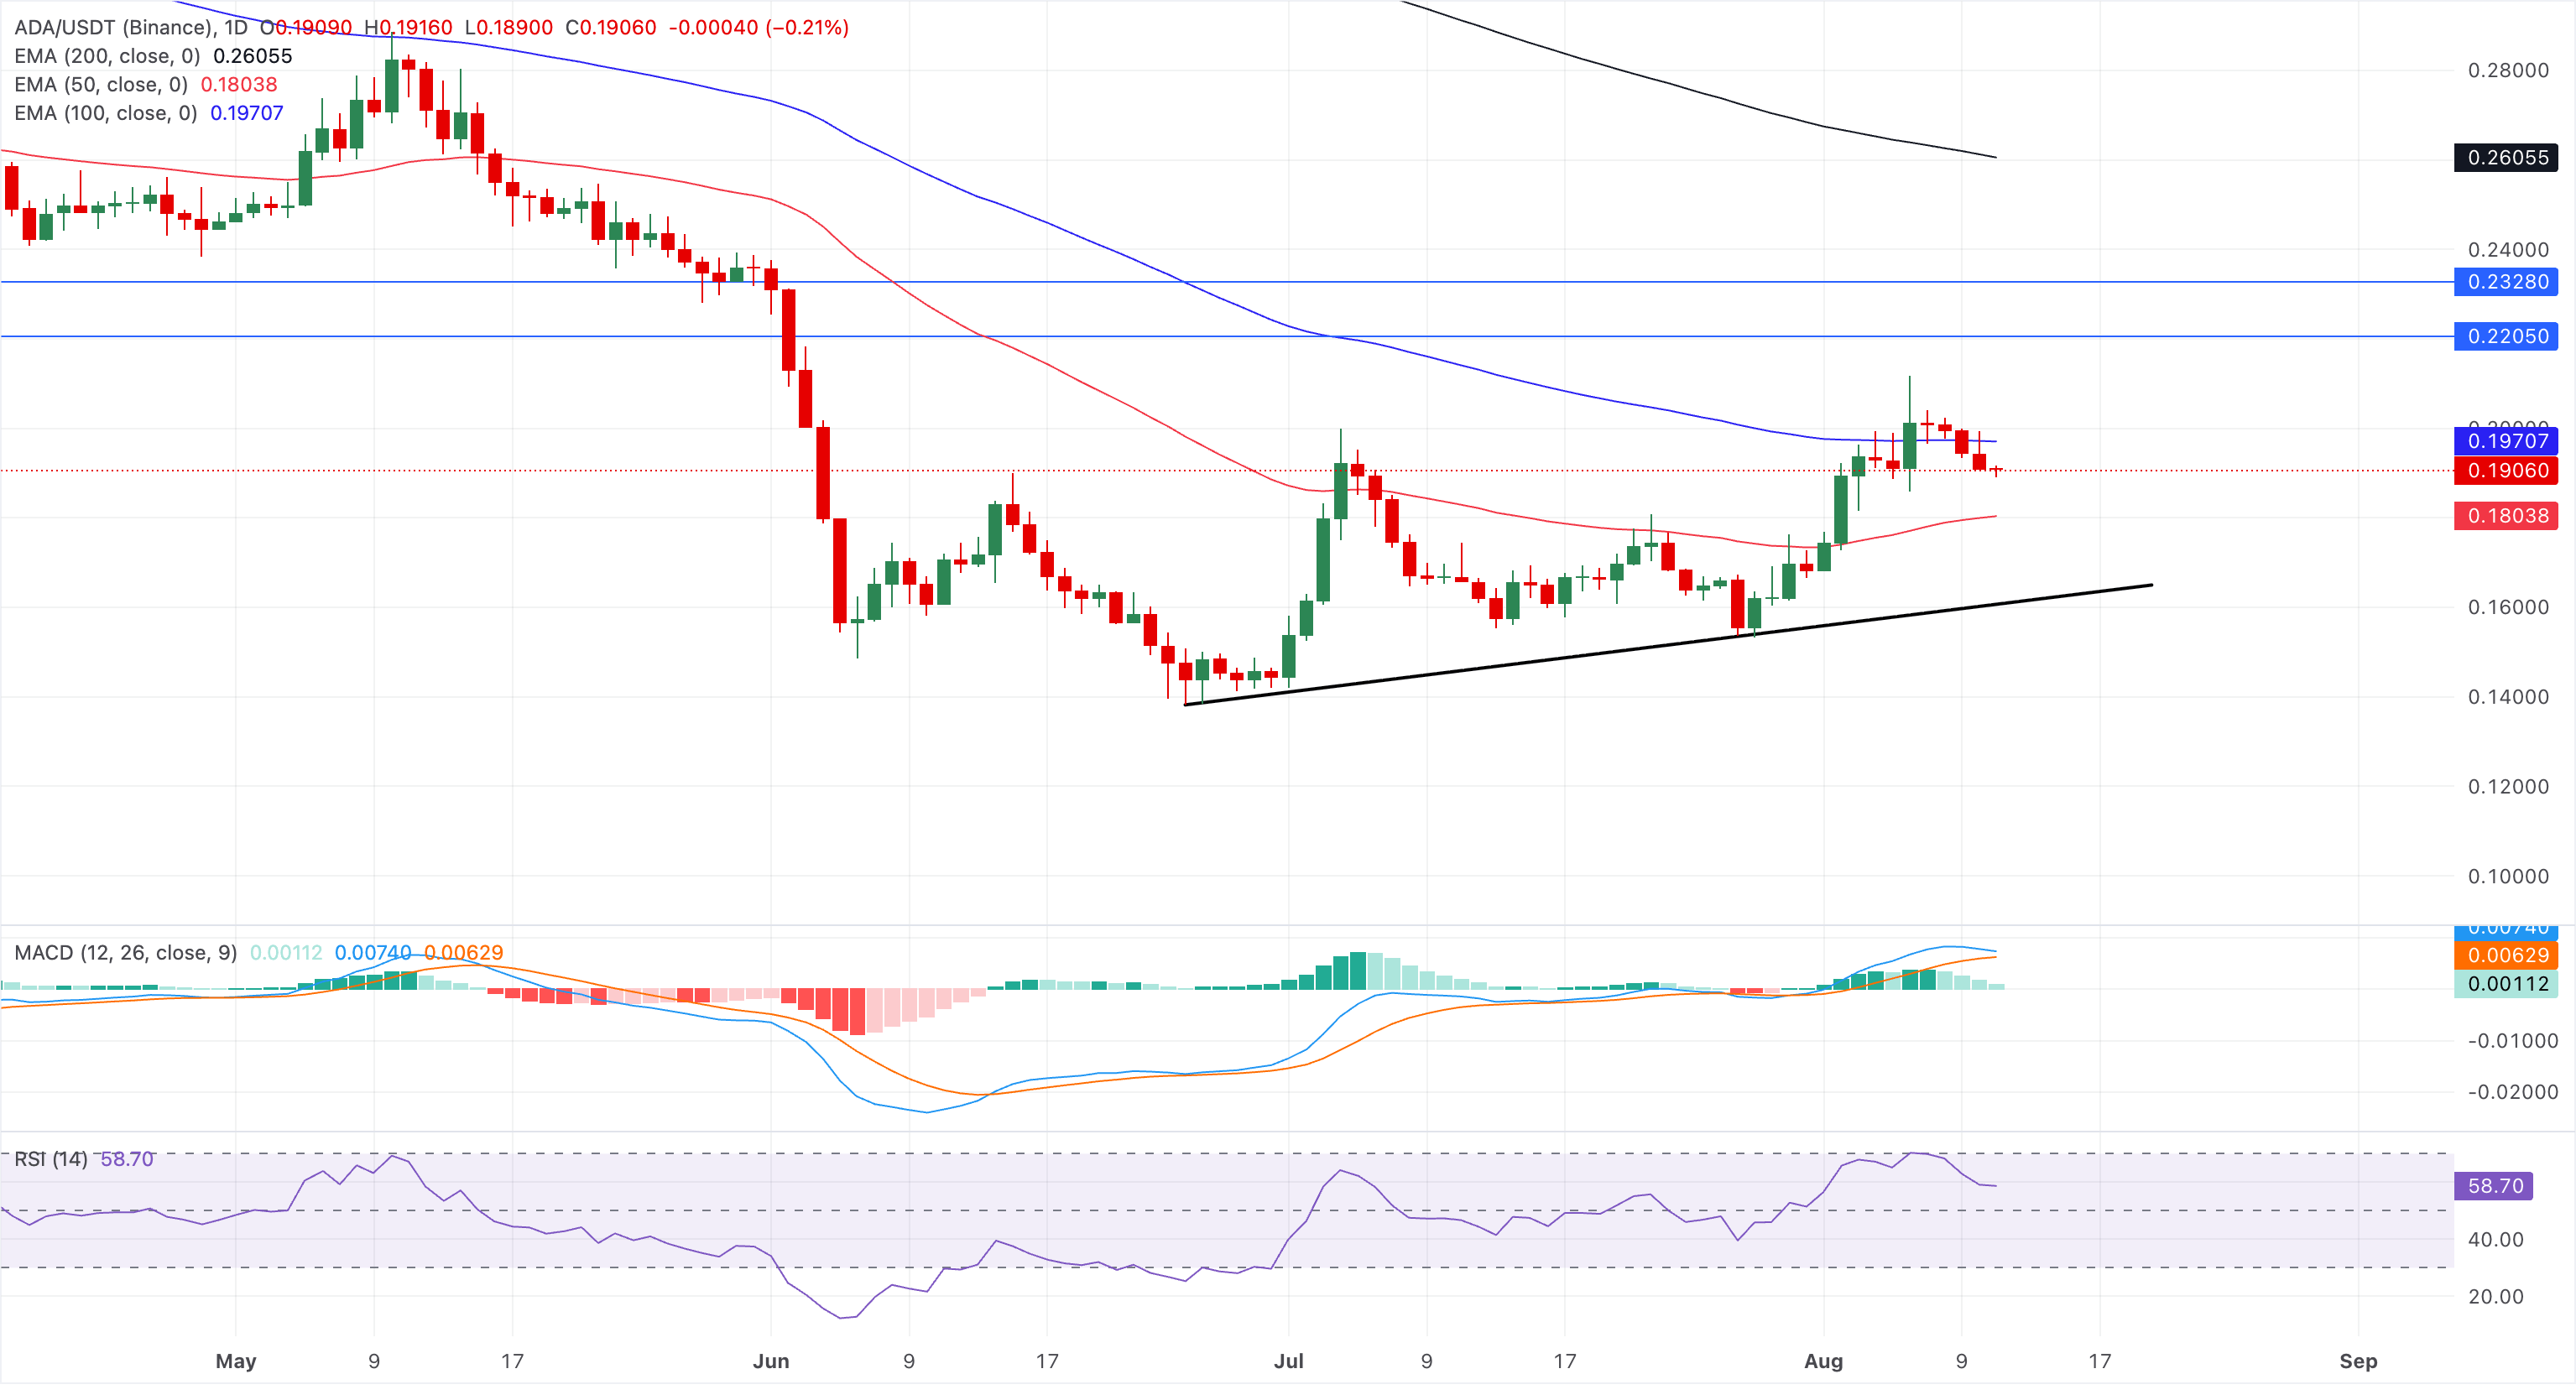
On the topside, initial resistance is defined by the 100-day EMA at $0.1971, and a sustained move above this barrier would expose the next, much stronger resistance zone at the $0.2000 psychological threshold.
Solana trades above $75 at press time on Tuesday, holding a constructive short-term tone as it trades above the 50-day EMA at $75.47 and the reclaimed resistance trendline near $75.66.
Momentum shows a mild improvement as the MACD and signal line rise, while the RSI hovers around 55 in the neutral territory.
However, the broader structure remains capped by the 100-day EMA at $78.47 and the 50% Fibonacci retracement of the downswing from $98.41 to $60.13 at $76.92, keeping the pair in a neutral-to-bullish consolidation. A sustained break above this cluster would expose the 78.6% Fibonacci retracement level at $88.56, ahead of the more distant 200-day EMA at $94.23.
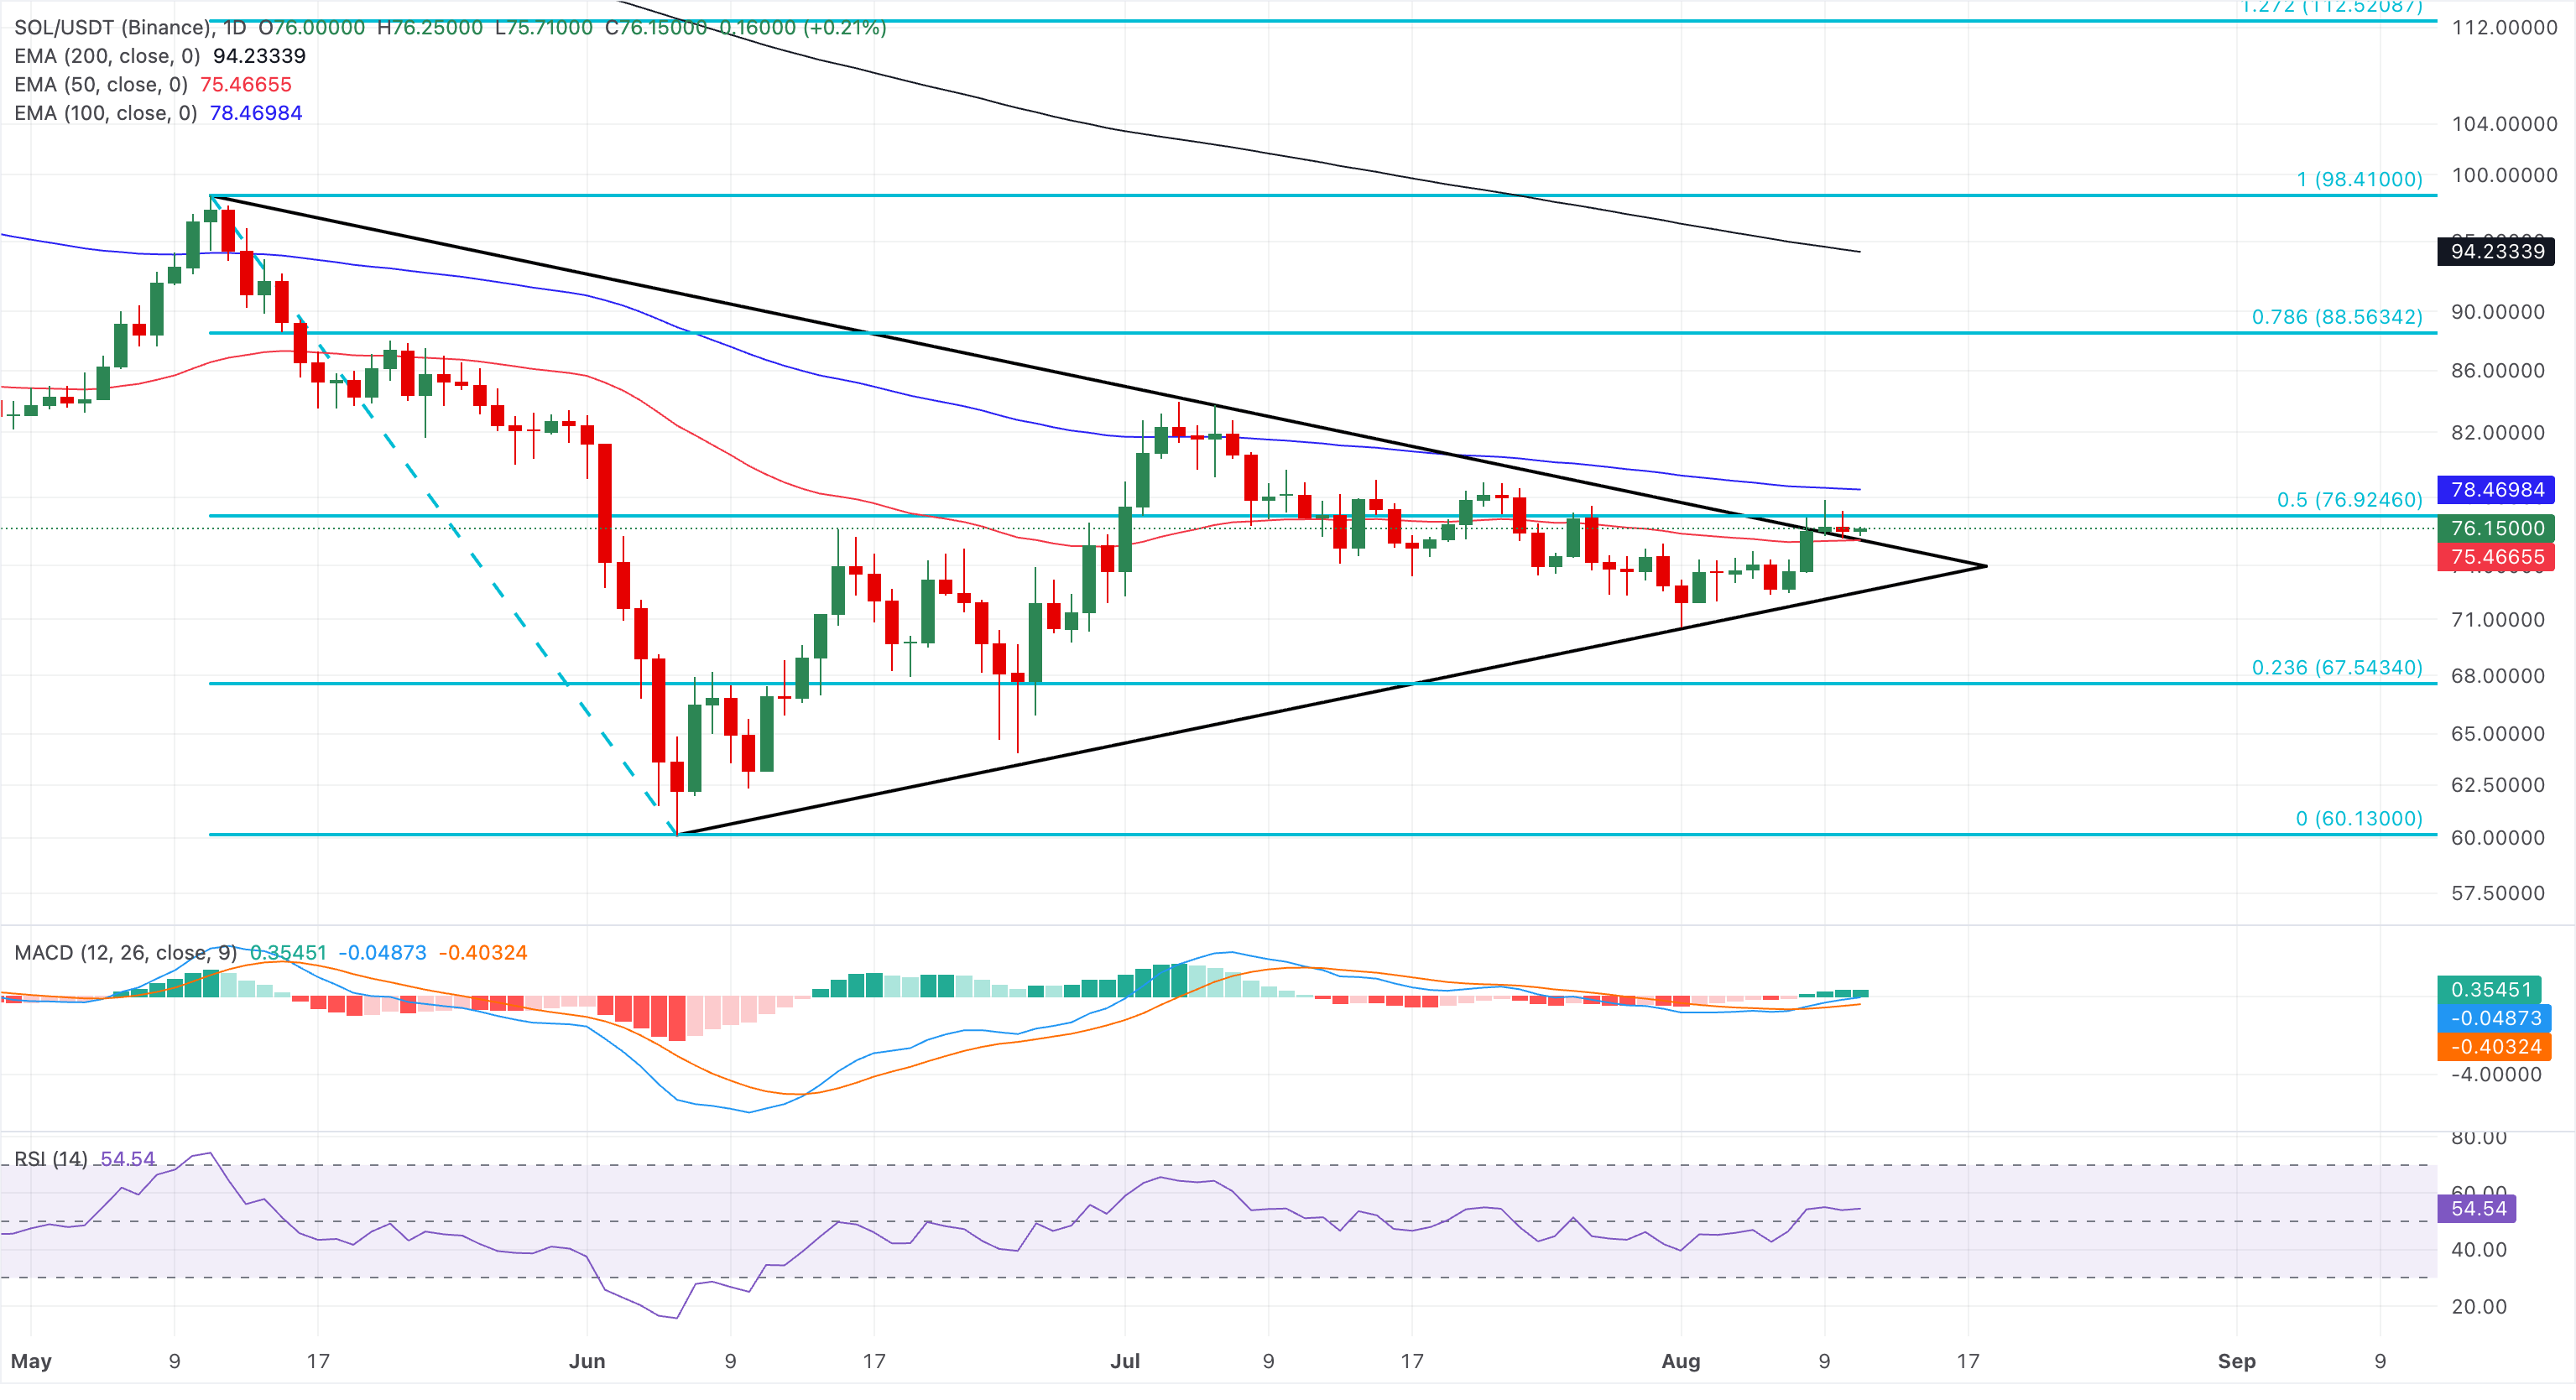
Looking down, immediate support is formed by the 50-day EMA at $75.47, with additional demand emerging at the rising trendline near $72.67.
(The technical analysis of this story was written with the help of an AI tool. Know more.)
Bài viết đề xuất


