

Ripple Price Forecast: XRP stalls under $1.20 as rebound gets sold amid muted investor interest
- XRP struggles to stay above $1.15 on Tuesday after a rejection near $1.20 the previous day.
- Risk-off sentiment persists, as reflected in the weak derivatives market and muted XRP ETF activity.
- XRP’s upside remains largely limited by declining major moving averages and a bearish Parabolic SAR indicator.
Ripple (XRP) hovers above $1.15 on Tuesday, following a rejection near $1.20. The remittance token mirrors the broader risk-off mood, with Bitcoin (BTC) stalling around $63,000 and Ethereum (ETH) trading below $1,700.
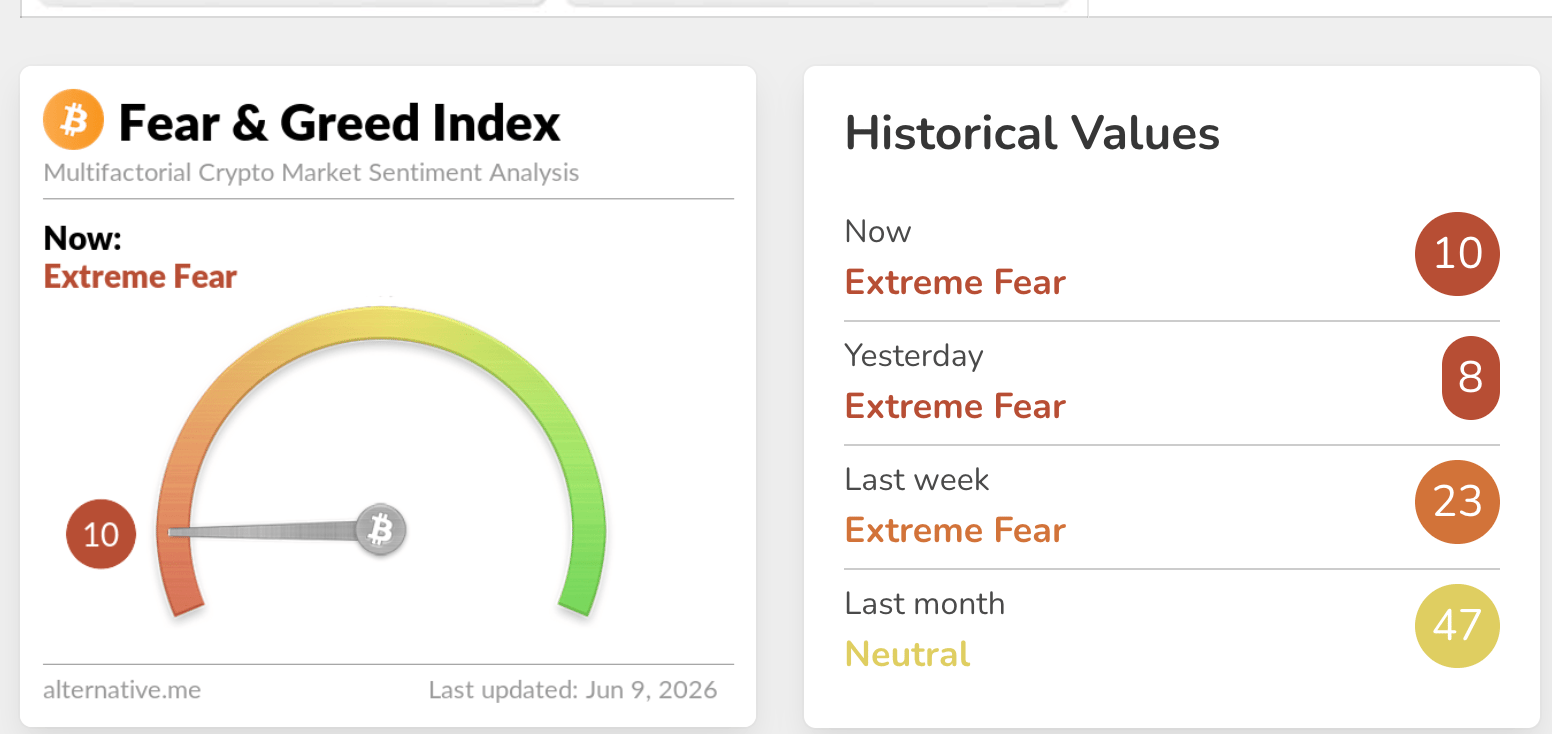
The Crypto Fear & Greed Index remains in Extreme Fear territory at 10 on Tuesday, marginally increasing from 8 the previous day. Weak sentiment suggests a lack of confidence in the crypto market's ability to sustain a recovery. Persistent weakness could lower the odds of an XRP rebound toward the $2.00 level.
Risk-aversion grows amid muted demand
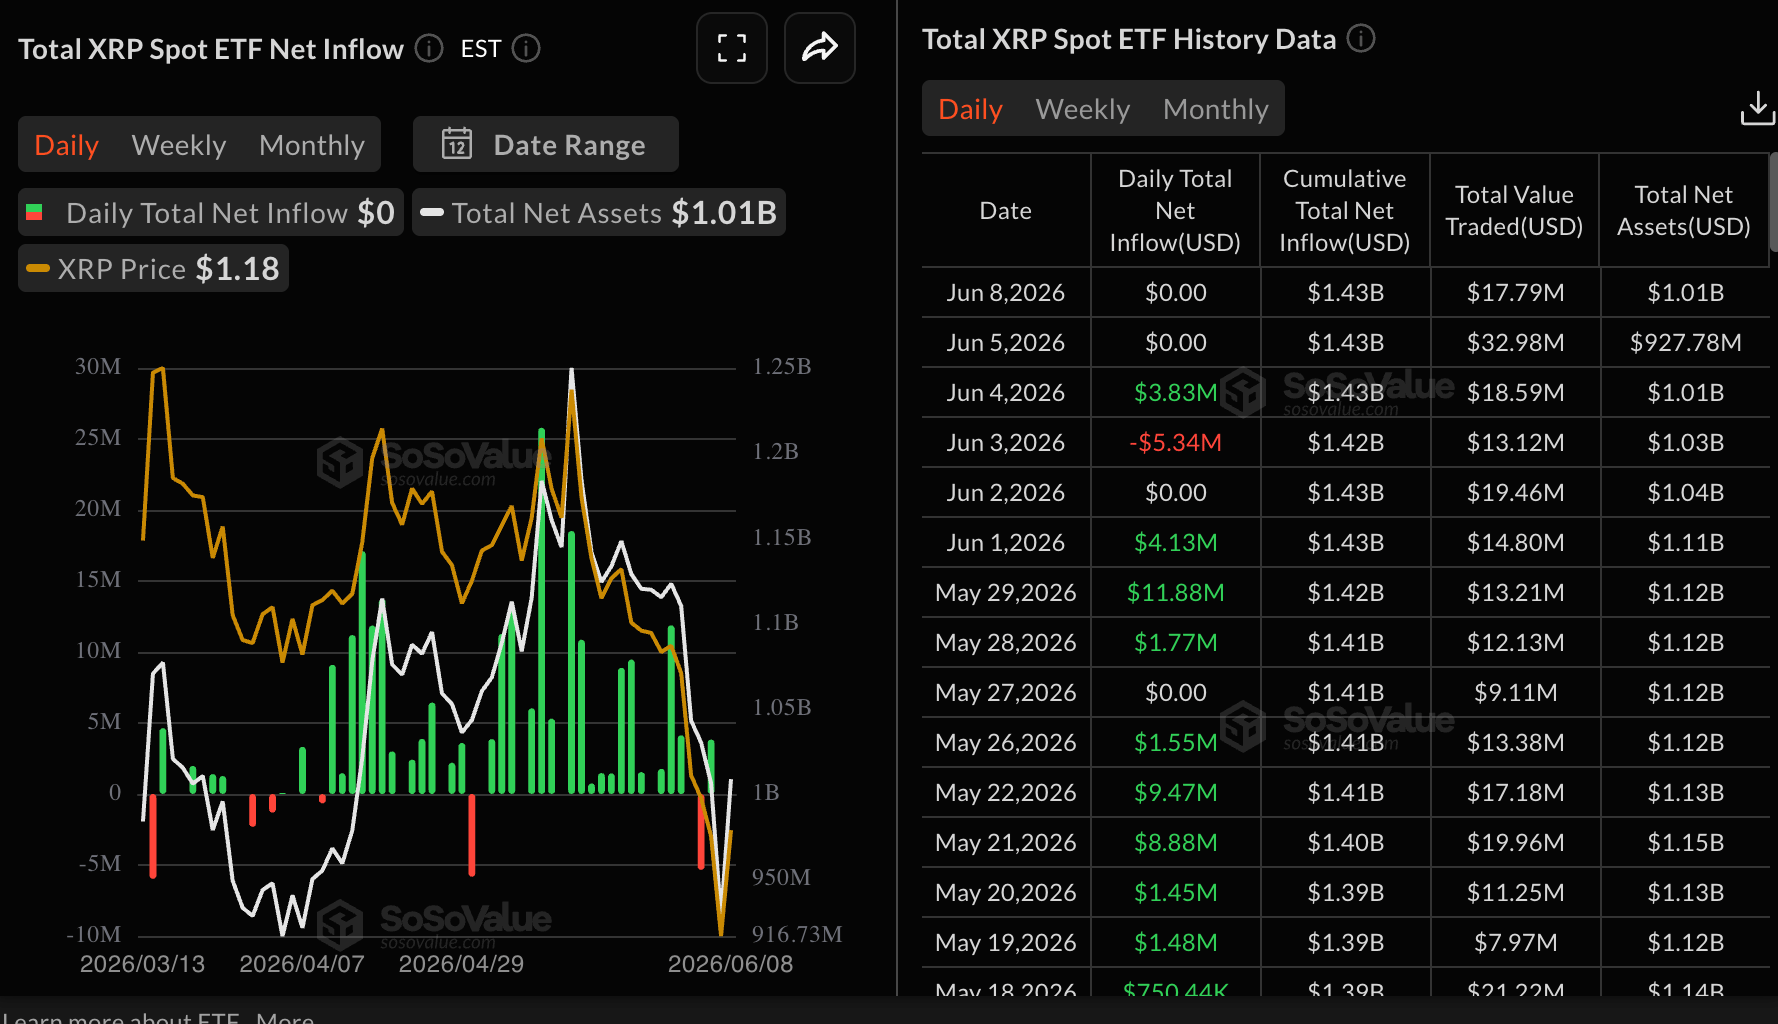
Institutional engagement with XRP digital investment products remains limited, as demonstrated by subdued activity in spot Exchange-Traded Funds (ETFs). SoSoValue data shows that XRP ETFs remained quiet on Monday, leaving cumulative inflows at $1.43 billion while net assets under management increased to $1.01 billion, up from $928 million the previous day.
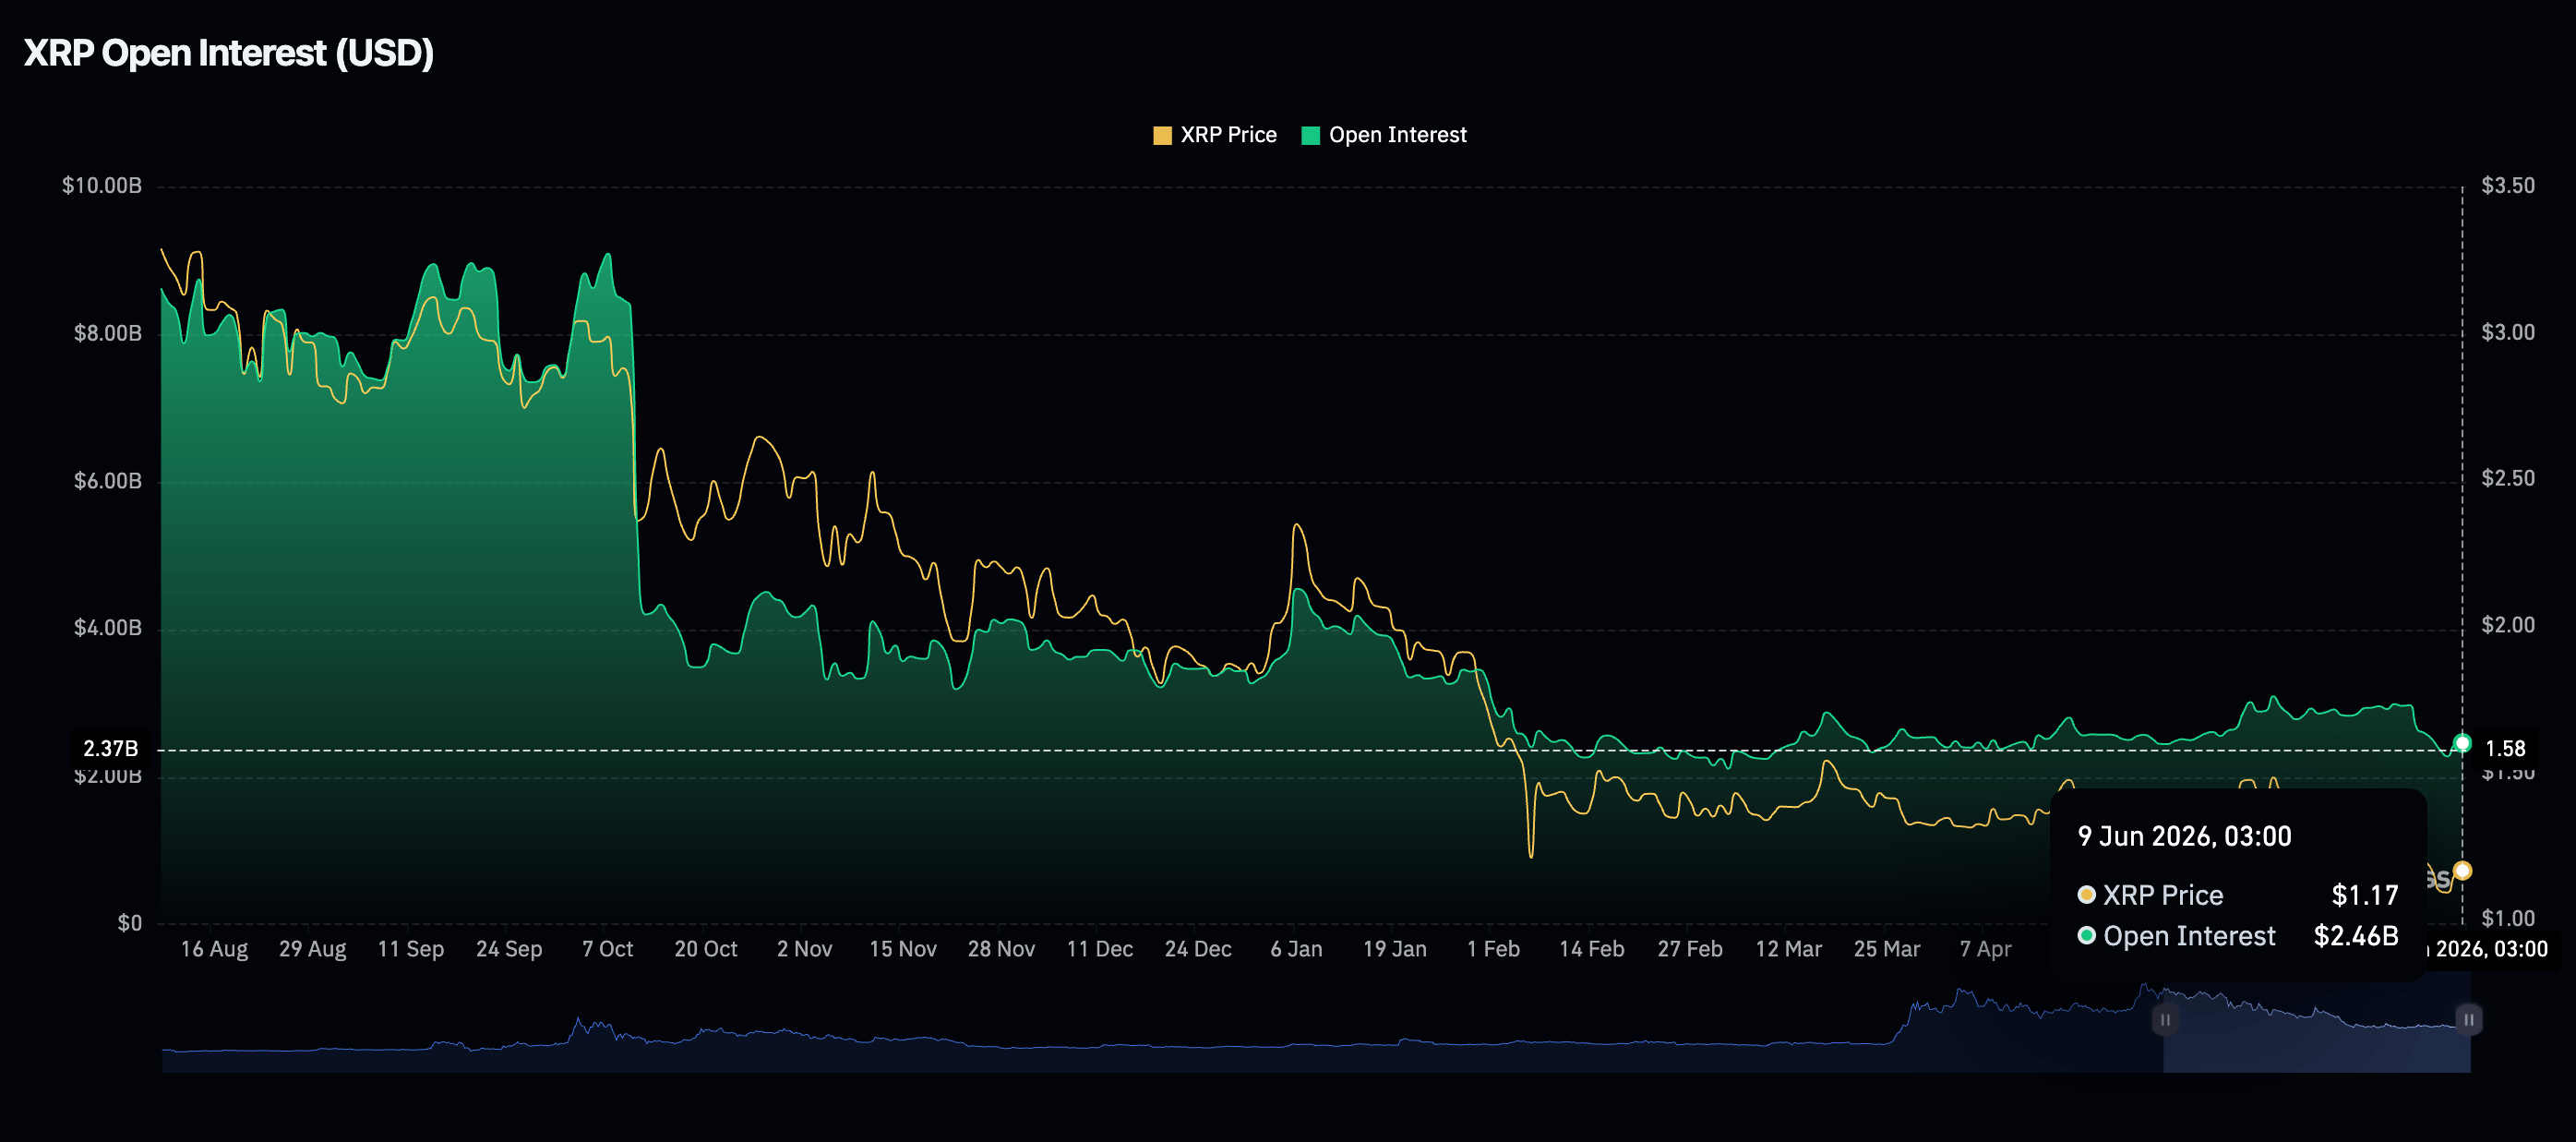
Demand for XRP derivatives holds steady with the futures Open Interest (OI) at $2.44 billion on Tuesday, increasing from the $2.28 billion recorded on Sunday. A sustained uptick in retail participation is essential to fuel a broader recovery in the XRP. However, subdued demand suggests XRP lacks the tailwind needed to sustain the uptrend.
Price analysis: XRP maintains broader bearish structure
XRP trades above $1.15, maintaining a bearish near-term bias as price holds below the 50-day Exponential Moving Average (EMA) at $1.32, the 100-day EMA at $1.41and the 200-day EMA at $1.62, keeping the broader structure under clear downside pressure.
The Parabolic SAR indicator at $1.25 also sits above spot, reinforcing the idea that rallies remain capped for now, while the Relative Strength Index (RSI) near 33 on the daily chart hints at sustained but not yet extreme oversold conditions.
At the same time, the Moving Average Convergence Divergence (MACD) histogram remains in negative territory on the same chart, but contracting, suggesting that downside momentum is starting to moderate.
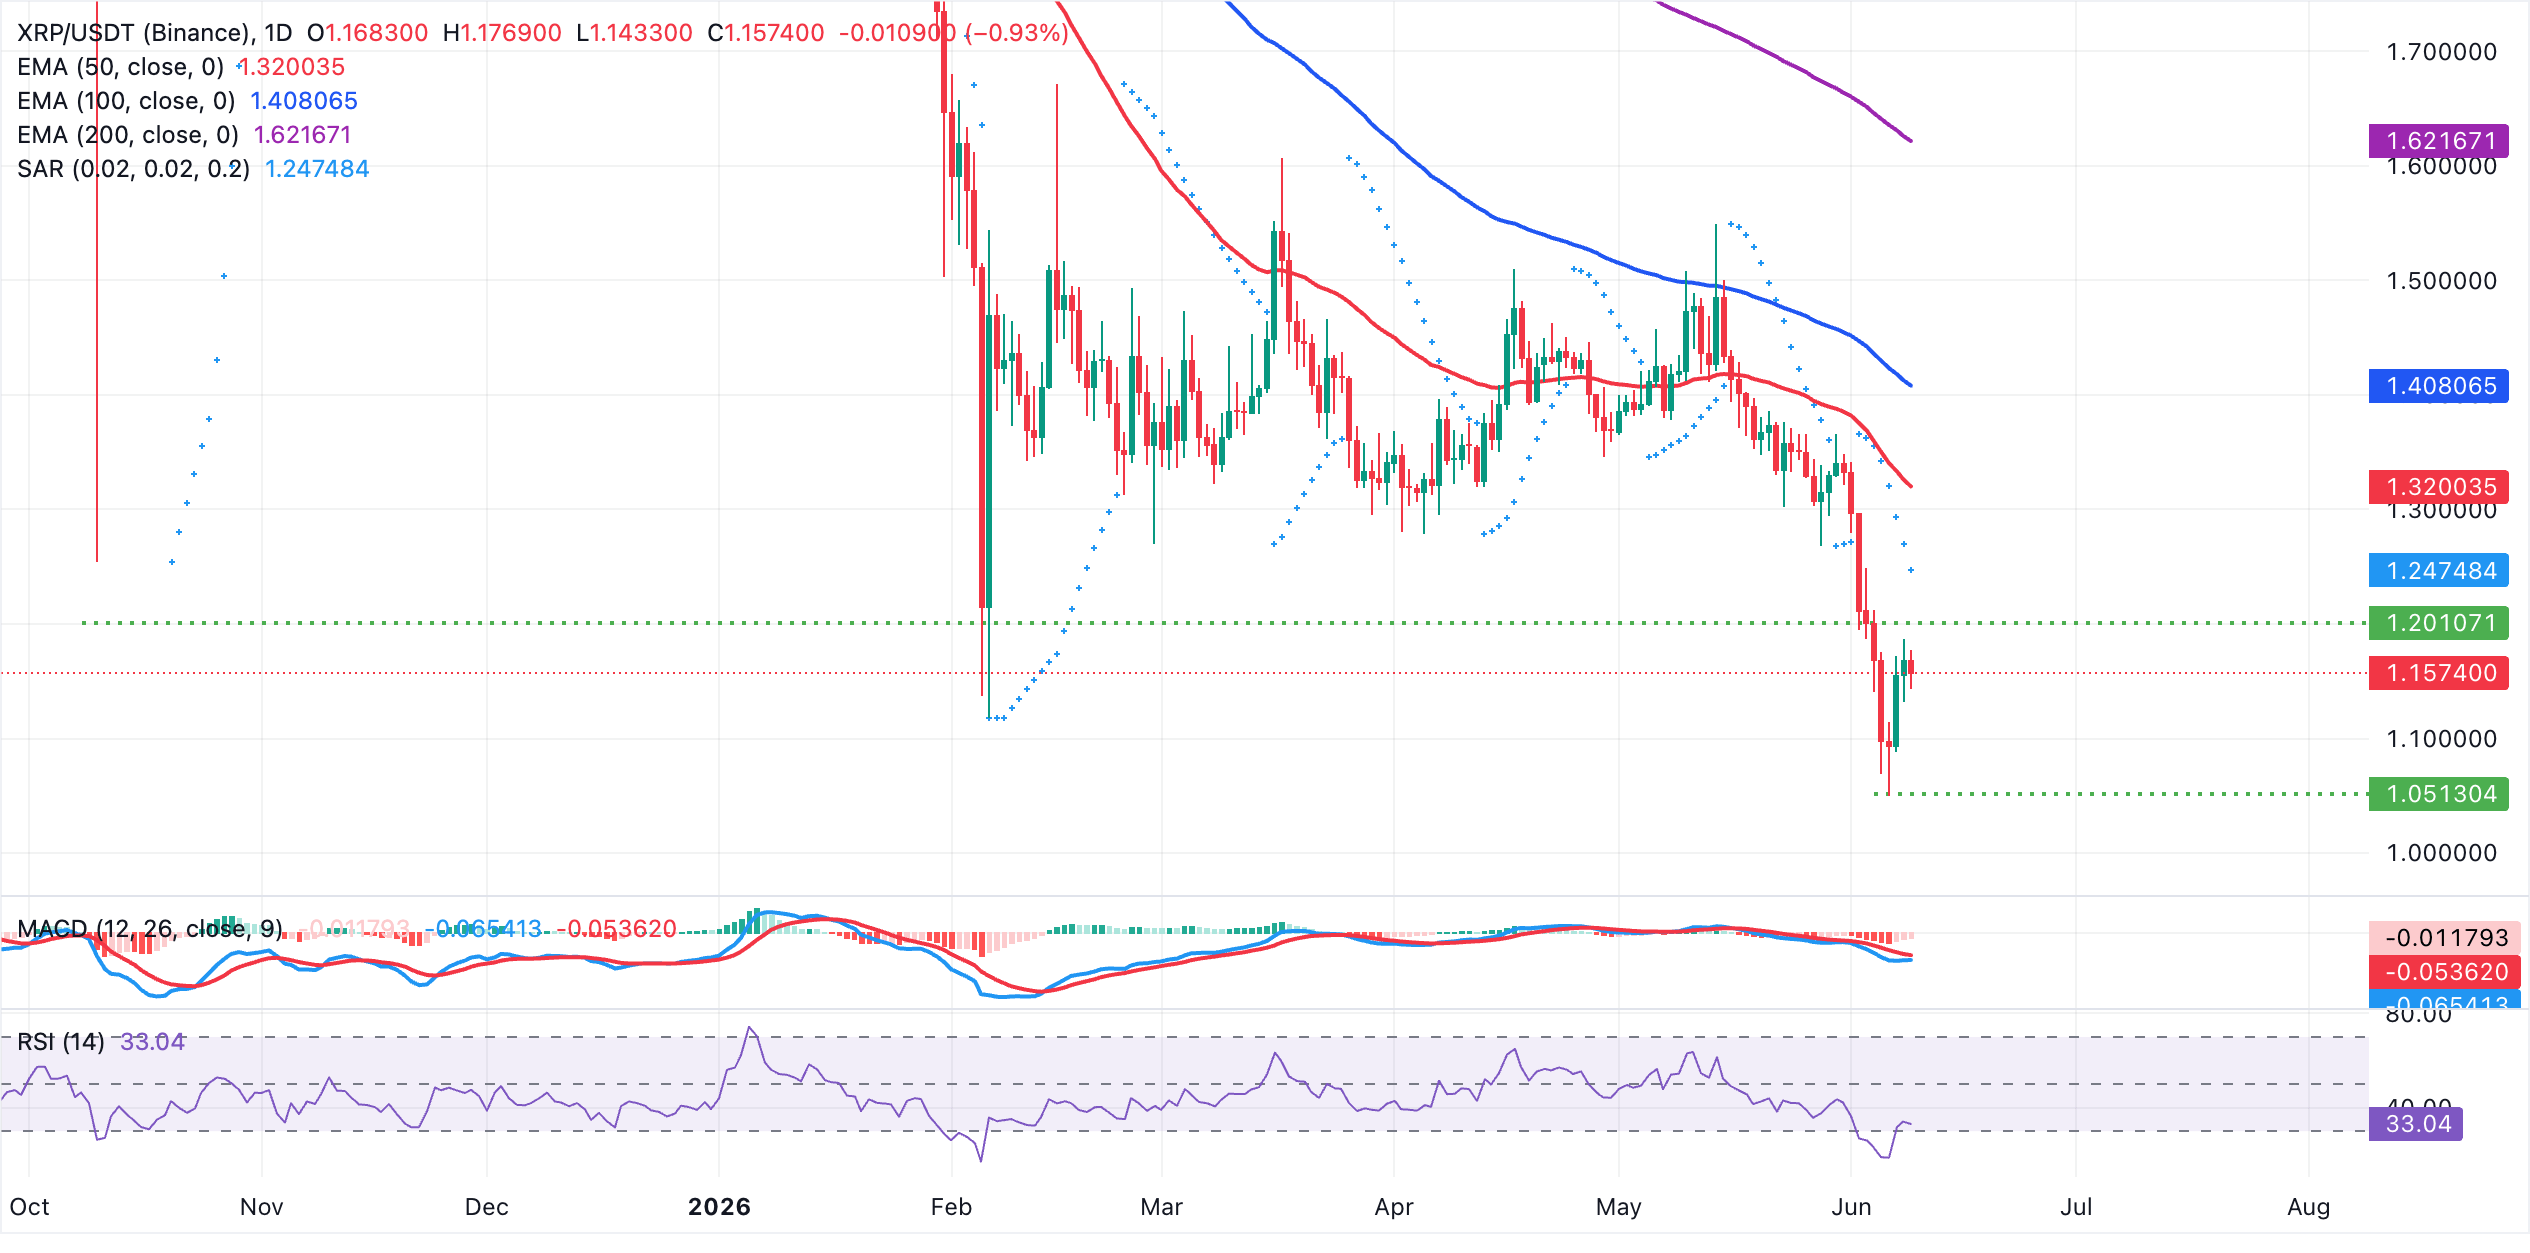
On the topside, initial resistance emerges at the Parabolic SAR barrier around $1.25, with the 50-day EMA at $1.32 forming the next key cap if buyers attempt a deeper rebound. Above these resistance levels, the 100-day EMA at $1.41 and the 200-day EMA near $1.62 outline a broader supply band that would need to be reclaimed to ease the prevailing bearish tone.
In the absence of any nearby structural support levels, a deeper correction would retest $1.05 and $1.00 levels, respectively and attract potential buy-the-dip demand. Still, failure to overcome these caps would keep XRP vulnerable to renewed selling on any recovery attempts.
(The technical analysis of this story was written with the help of an AI tool.)
Crypto ETF FAQs
An Exchange-Traded Fund (ETF) is an investment vehicle or an index that tracks the price of an underlying asset. ETFs can not only track a single asset, but a group of assets and sectors. For example, a Bitcoin ETF tracks Bitcoin’s price. ETF is a tool used by investors to gain exposure to a certain asset.
Yes. The first Bitcoin futures ETF in the US was approved by the US Securities & Exchange Commission in October 2021. A total of seven Bitcoin futures ETFs have been approved, with more than 20 still waiting for the regulator’s permission. The SEC says that the cryptocurrency industry is new and subject to manipulation, which is why it has been delaying crypto-related futures ETFs for the last few years.
Yes. The SEC approved in January 2024 the listing and trading of several Bitcoin spot Exchange-Traded Funds, opening the door to institutional capital and mainstream investors to trade the main crypto currency. The decision was hailed by the industry as a game changer.
The main advantage of crypto ETFs is the possibility of gaining exposure to a cryptocurrency without ownership, reducing the risk and cost of holding the asset. Other pros are a lower learning curve and higher security for investors since ETFs take charge of securing the underlying asset holdings. As for the main drawbacks, the main one is that as an investor you can’t have direct ownership of the asset, or, as they say in crypto, “not your keys, not your coins.” Other disadvantages are higher costs associated with holding crypto since ETFs charge fees for active management. Finally, even though investing in ETFs reduces the risk of holding an asset, price swings in the underlying cryptocurrency are likely to be reflected in the investment vehicle too.
Bài viết đề xuất


