

Crypto Overview: Zcash, Terra Classic sustain gains amid broader market risk-off phase
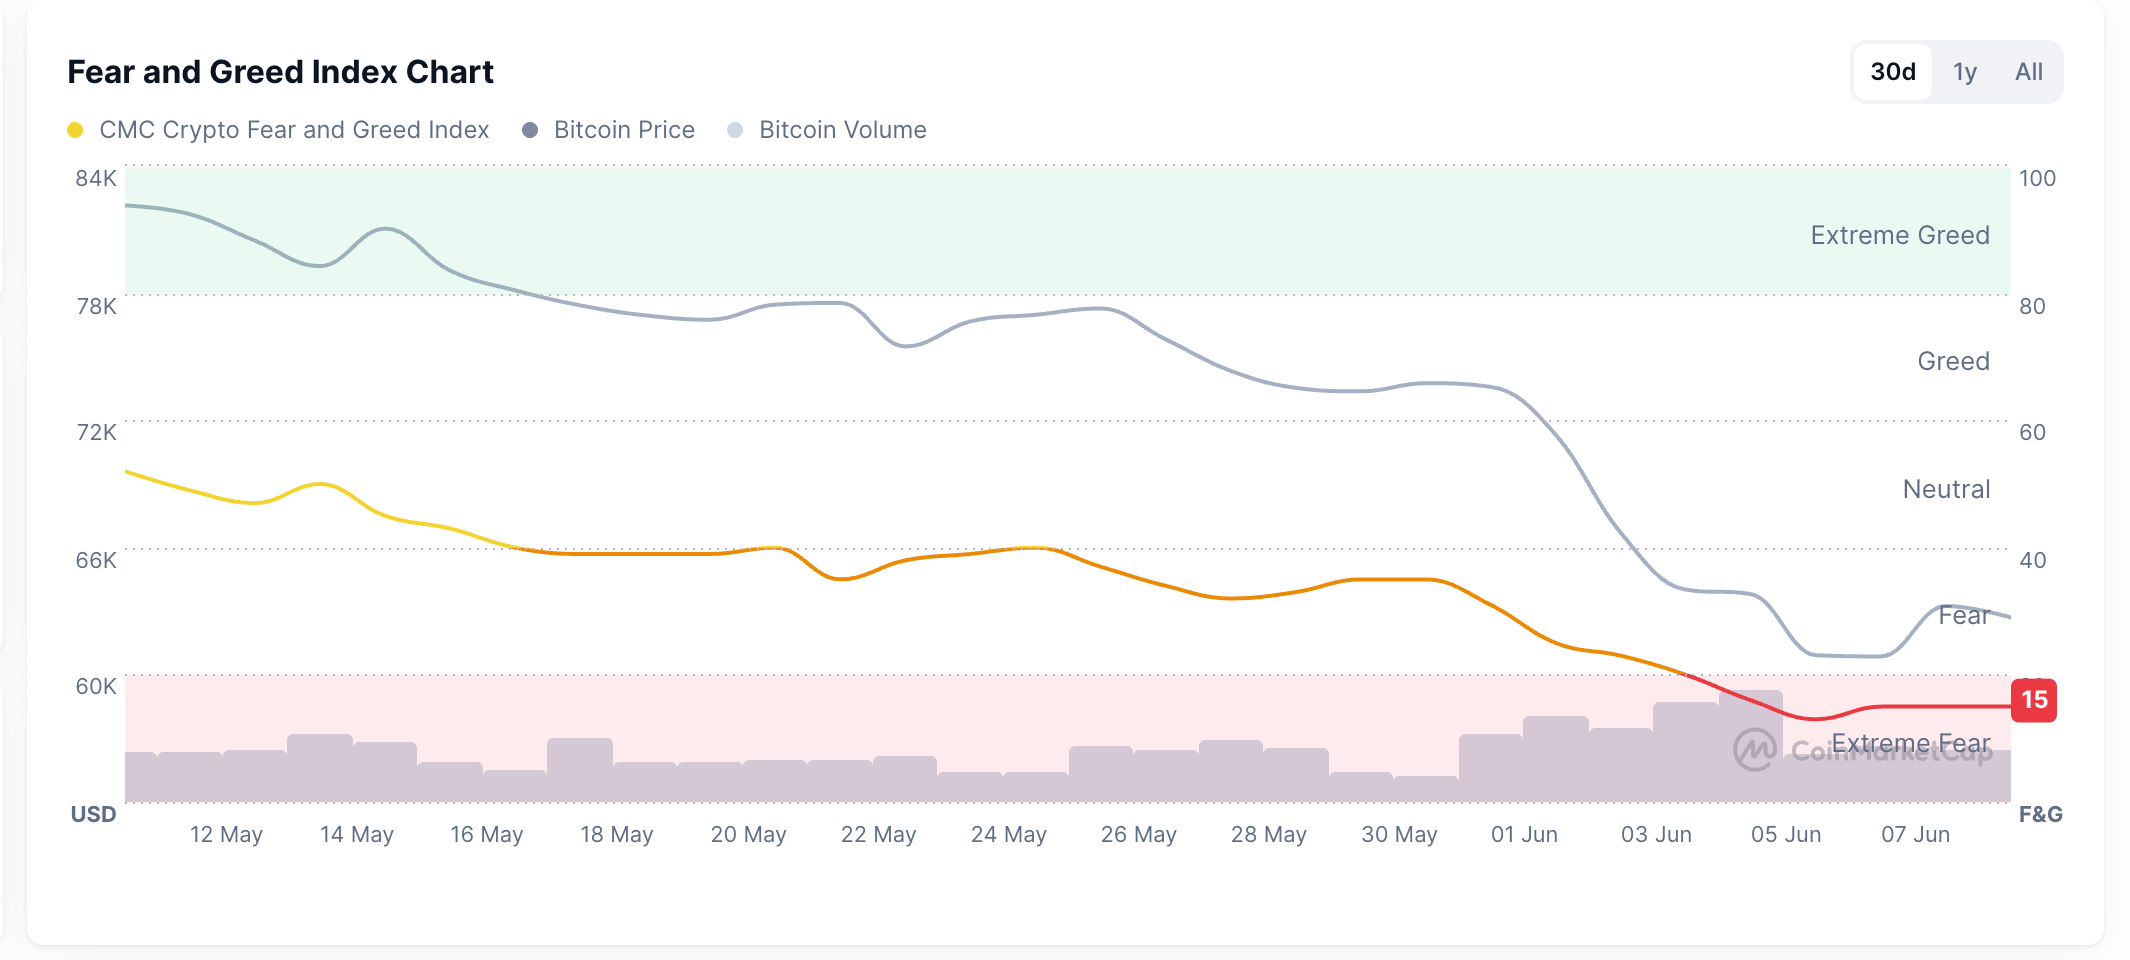
- The cryptocurrency market signals a risk-off sentiment, with the Fear and Greed Index indicating extreme fear among investors.
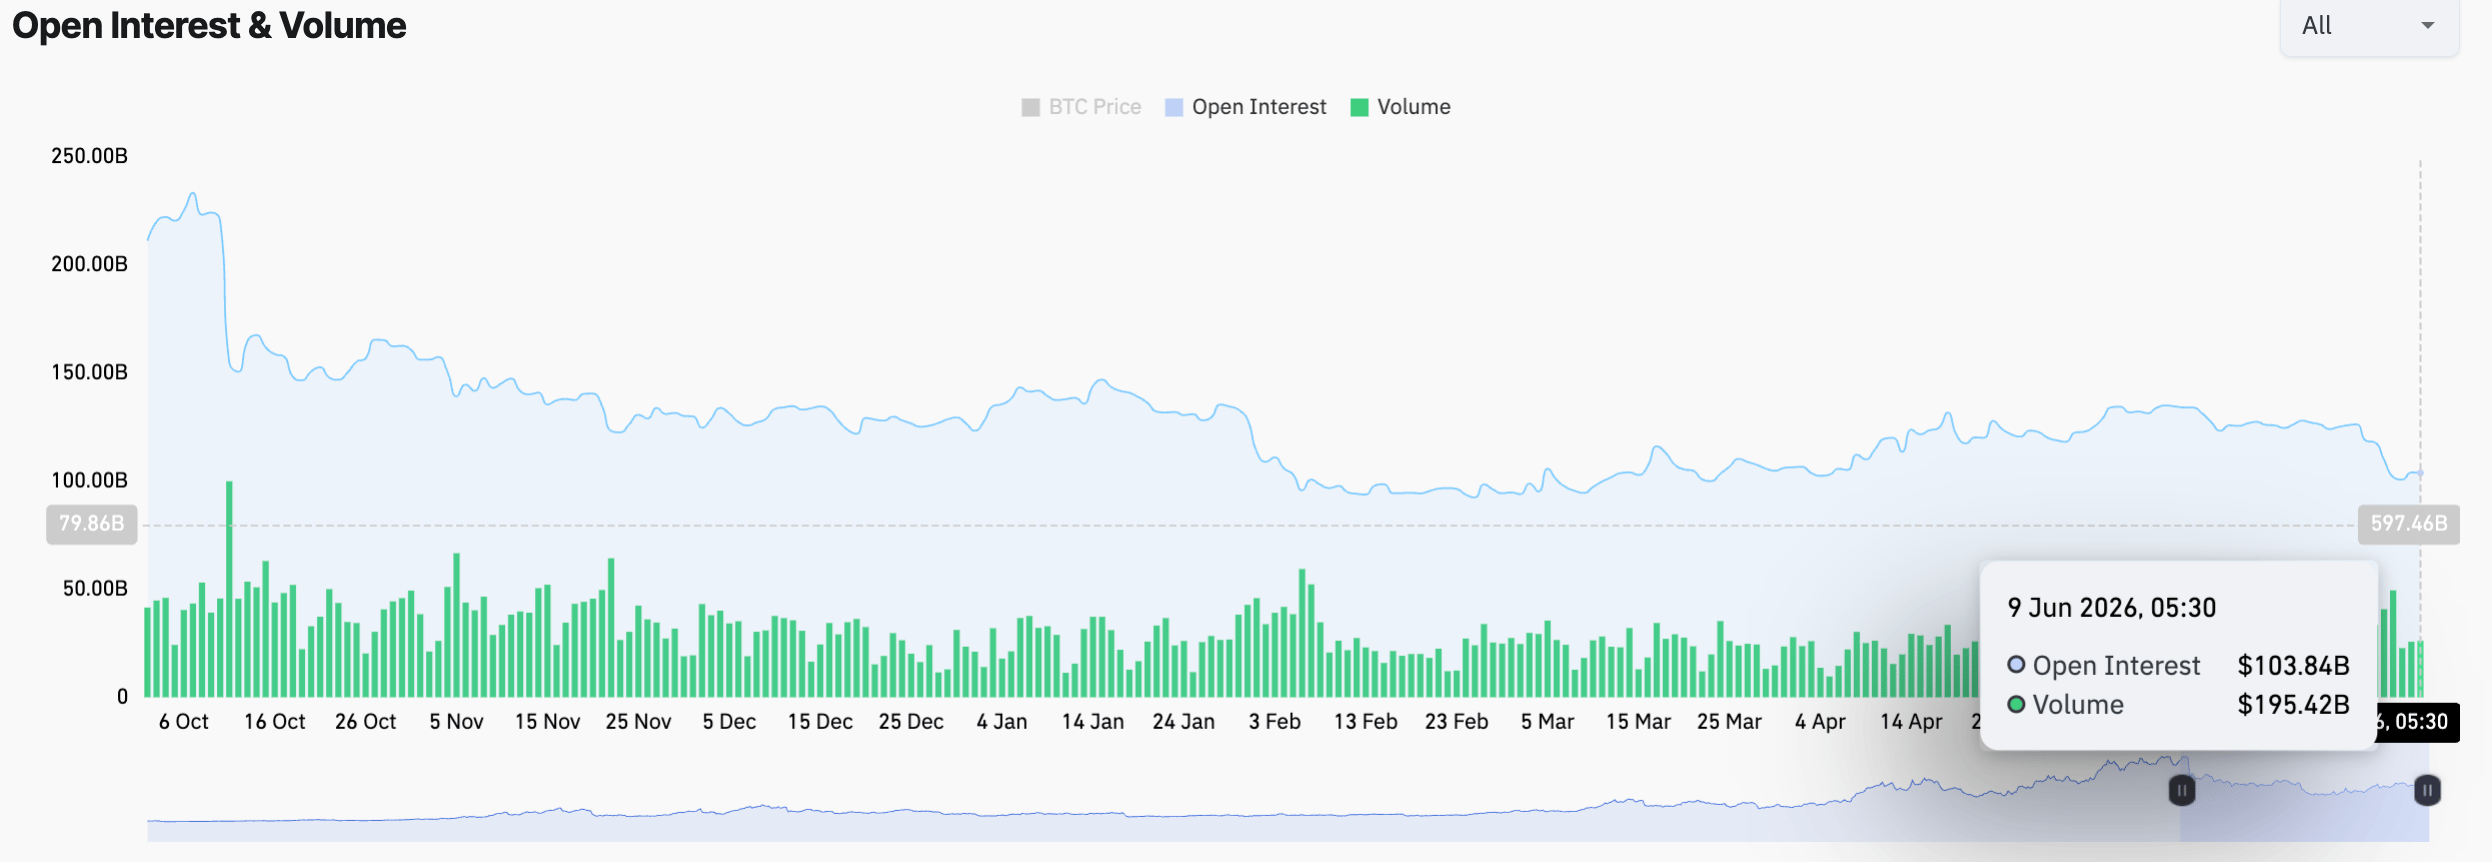
- The crypto market Open Interest is down to $103 billion, from the $135 billion peak in May, reflecting an easing in leverage exposure.
- Zcash and Terra Classic emerge as top gainers over the last 24 hours.
The broader cryptocurrency market remains under pressure, with Bitcoin (BTC) trading around $62,000 on Tuesday, while market-wide Open Interest stabilizes after hitting a two-month low. Reduced leverage exposure reflects a risk-off phase, as supported by the Fear and Greed Index, which indicates extreme fear in the market. Although downside pressure lingers, Zcash (ZEC) and Terra Classic (LUNC) emerge as top performers over the last 24 hours, defying market trends.
Crypto is under pressure
Bitcoin’s rebound following a brief slip below $60,000 on Friday, as stronger-than-expected US jobs report data fueled hawkish Fed expectations, is losing momentum. The intraday pullback below $63,000 on Tuesday is consistent with the broader market risk-off sentiment.
CoinMarketCap data shows the Fear and Greed Index down to 15 on Tuesday, from 25 last week, reflecting a sharp decline in investors' risk appetite. Corroborating the de-risking phase, the broader market Open Interest (OI) dropped to a two-month low of $100 billion on Sunday, down from the May 12 peak of $135 billion, driven largely by over $1 billion in daily liquidations last week. As of Tuesday, the OI stands at $103 billion, stabilizing in the near-term as liquidations cool off.
Though the data suggests easing of near-term volatility, persistent downside pressure could extend the decline in Bitcoin and major altcoins.
Zcash and Terra Classic attempt to scale the market tide
Zcash hovers slightly below $450 at press time on Tuesday, holding after a 4% gain above the 100-day Exponential Moving Average (EMA) at $430 on Monday. The privacy coin keeps the near-term tone neutral to slightly bullish with a near-term V-shaped recovery from the 200-day EMA at $369. The upward trend in EMAs suggests the broader uptrend remains intact, but it is capped by the 50-day EMA at $485.
That said, the momentum is subdued on the daily chart, with the Relative Strength Index (RSI) hovering around 44 and the Moving Average Convergence Divergence (MACD) still below its signal line, which hints that recovery attempts could struggle while price trades beneath the 50-day EMA.
Looking up, the 50-day EMA at $485 could serve as the final dynamic resistance, capping the upside toward the $500 psychological threshold.
On the downside, initial support is seen at the 100-day EMA at $430, ahead of a structural band around the 200-day EMA at $369.
Terra Classis mirrors a similar near-term V-shaped rebound from its 200-day EMA at $0.000057 on Saturday. At the time of writing, LUNC is down over 3% on Tuesday as the 50-day EMA at $0.000072 caps the three-day recovery, keeping the near-term bias neutral.
With the MACD and signal line trending in the negative zone and the RSI rising to 45, momentum remains subdued.
A daily close above the 50-day EMA at $0.000072 could extend the LUNC recovery toward $0.000091 resistance, which capped a minor bullish attempt in late May.
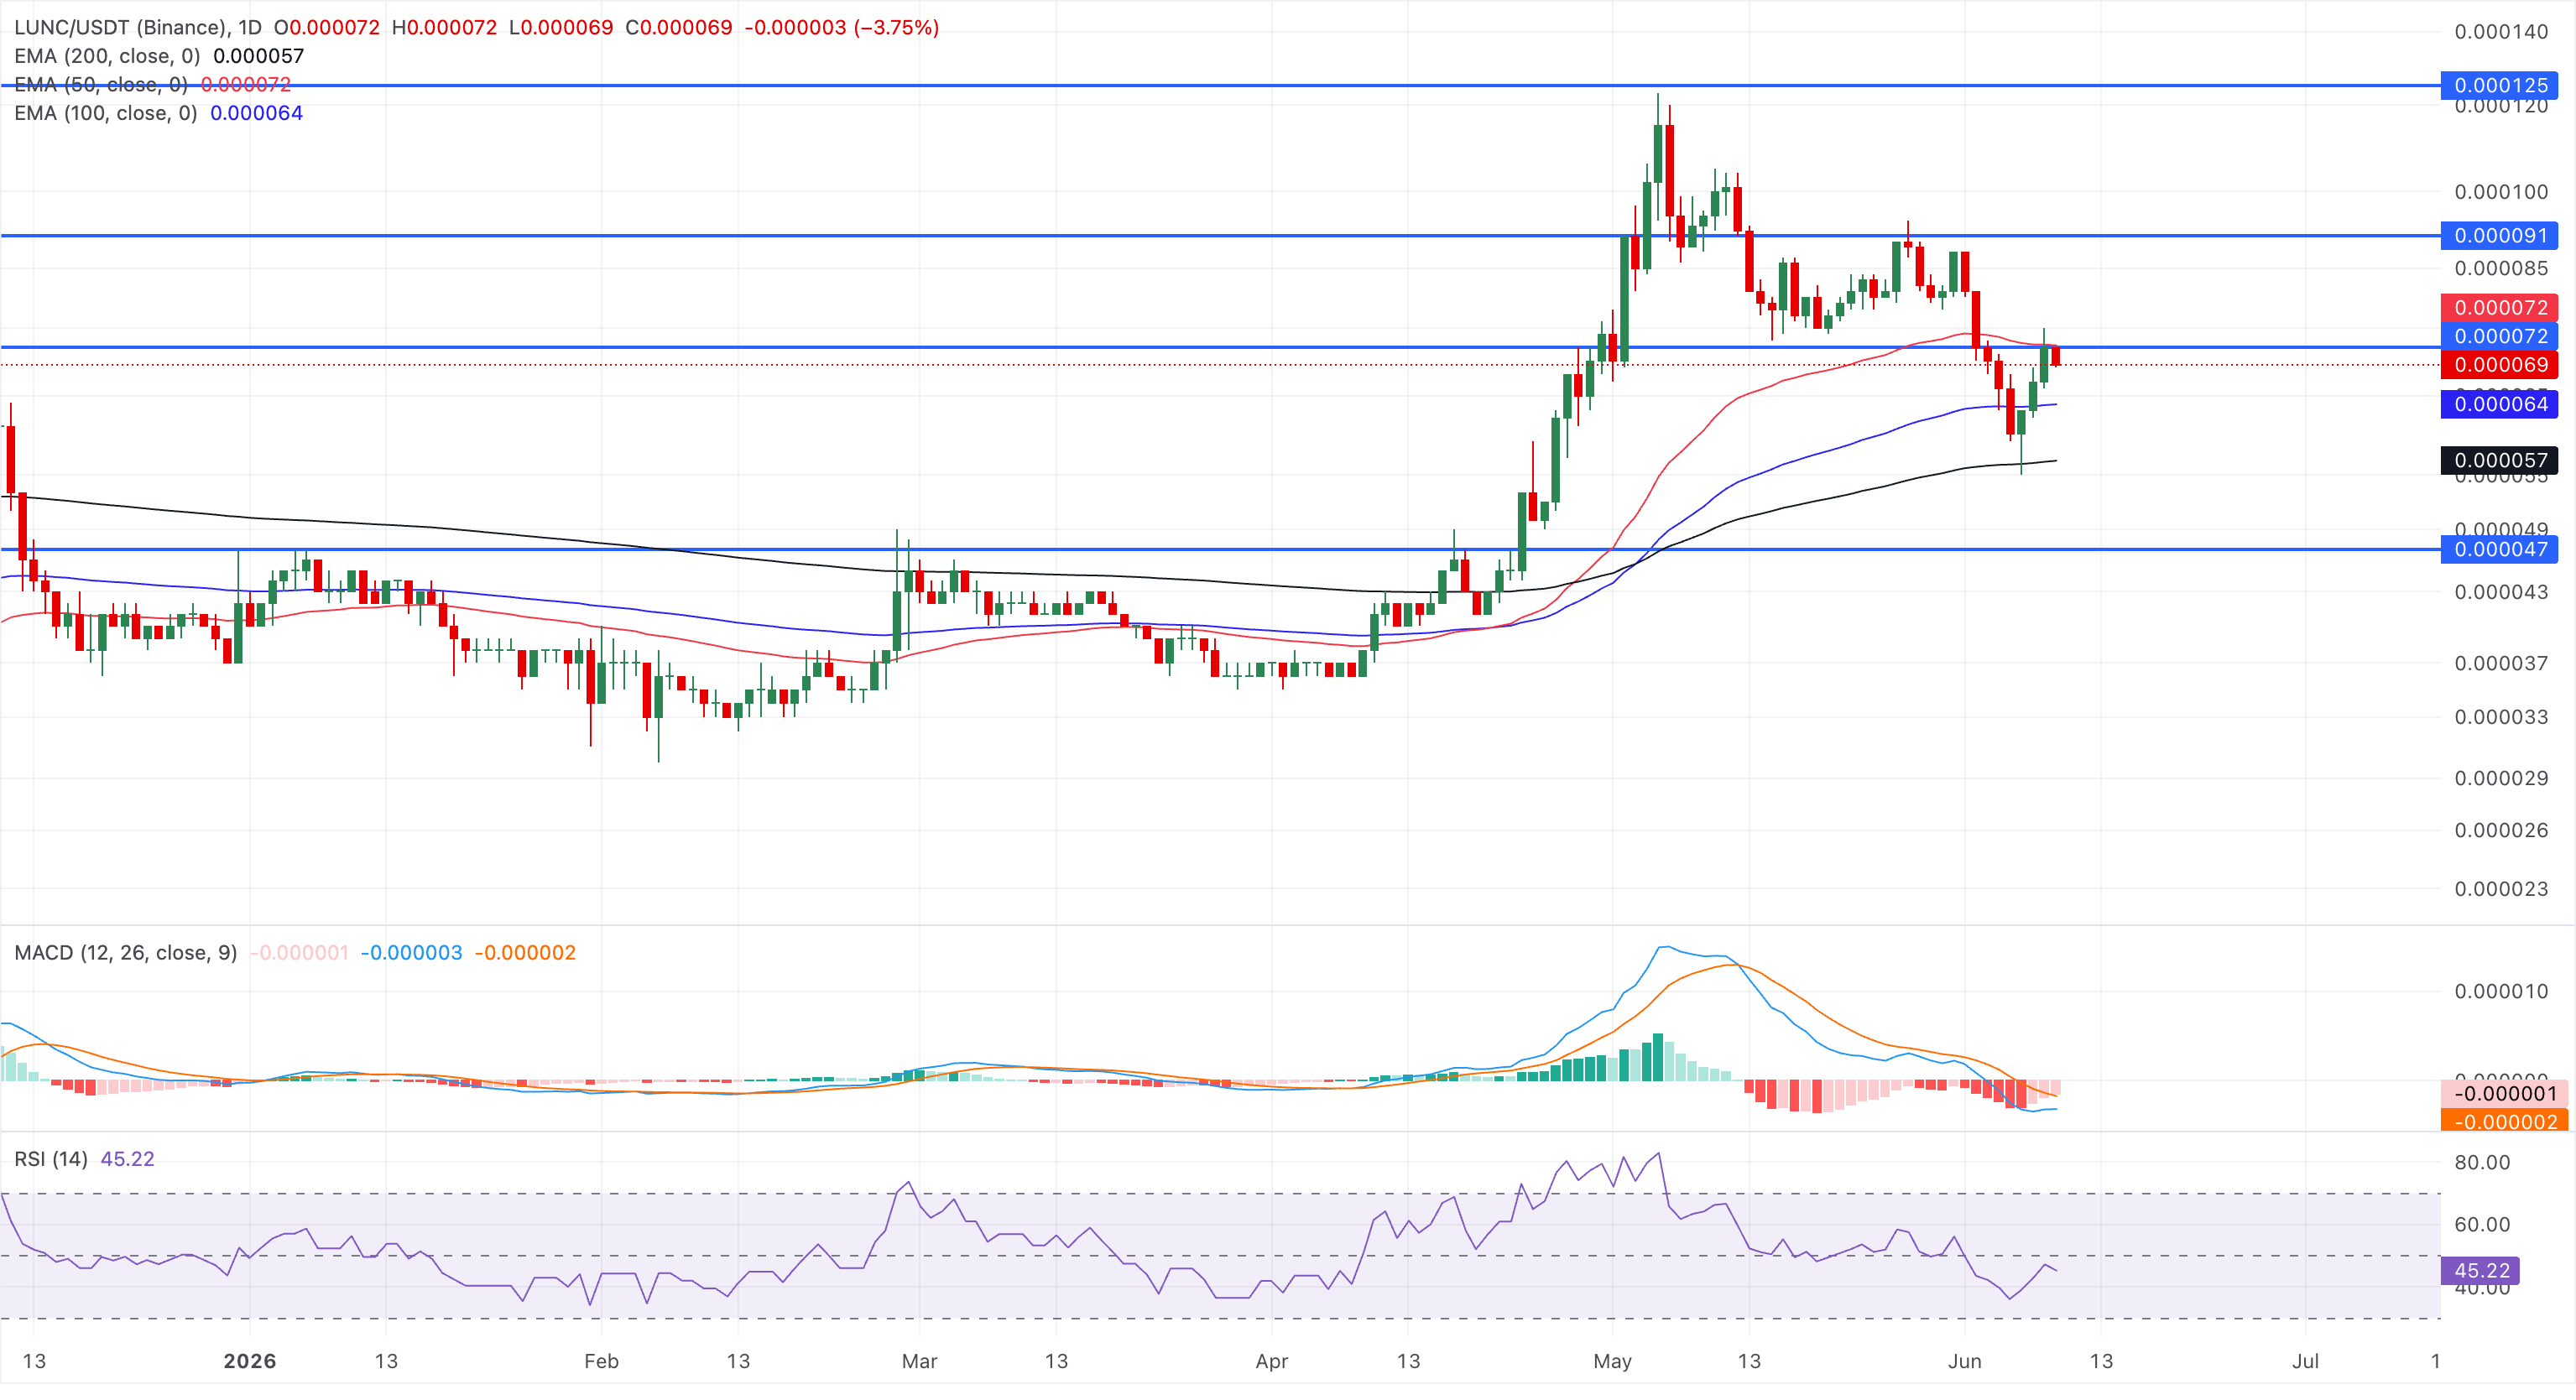
Looking down, the 100-day and 200-day EMA at $0.000064 and $0.000057, respectively, serve as crucial support zone for buyers to regain control.
(The technical analysis of this story was written with the help of an AI tool.)
Bài viết đề xuất


