

Bitcoin Price Forecast: BTC extends consolidation as ETF outflows, defensive perpetual sentiment persist
- Bitcoin continues to trade sideways between $65,729 and $71,746, extending its consolidation since February 7.
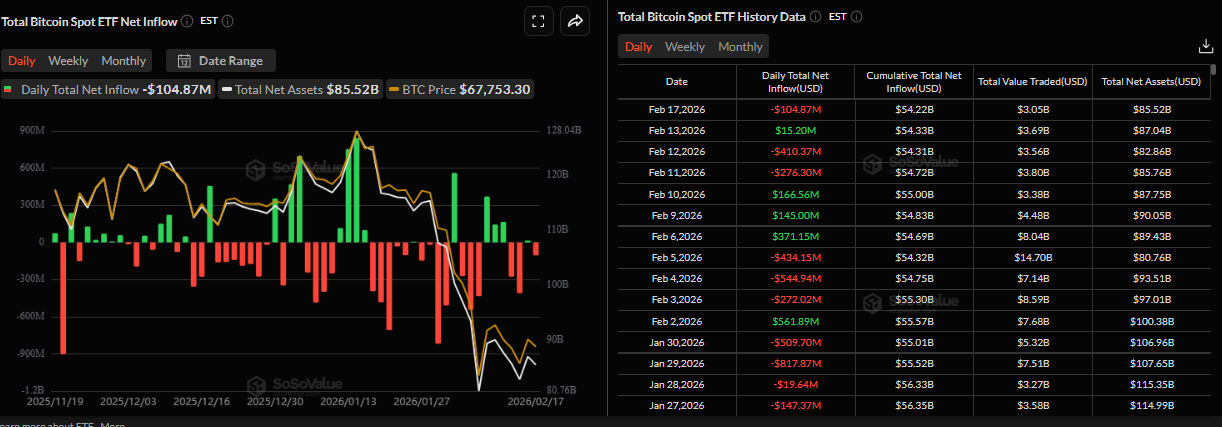
- US-listed spot Bitcoin ETFs recorded a mild outflow of $ 104.87 million on Tuesday, while Strategy added 2,486 BTC.
- Defensive perpetual market sentiment signals long positions steadily exiting during the slow consolidation, suggesting a risk of derivatives-driven squeezes.
Bitcoin (BTC) remains locked in a tight consolidation, trading within a horizontal range around $68,000 at the time of writing on Wednesday, having held within this range since February 7. The ongoing sideways trading in the Crypto King is further supported by mild Exchange Traded Fund (ETF) outflows and defensive positioning in the perpetual futures market. Meanwhile, reports suggest that long positions are steadily exiting during the slow consolidation, signaling a risk of derivatives-driven squeezes unless a fresh catalyst emerges.
Institutional demand cautions stance
Institutional demand for Bitcoin shows cautious institutional positioning, supporting its ongoing price consolidation. SoSoValue data show that spot ETFs recorded a mild outflow of $104.87 on Tuesday, following the fourth consecutive week of withdrawals. If this trend continues and intensifies, BTC could see further correction.
However, on the corporate front, Michael Saylor announced on X on Tuesday that Strategy (MSTR) purchased 2,486 BTC, following the purchase of 1,142 BTC last week. Tuesday’s purchase brings the firm’s total holdings to 717,131 BTC, highlighting its continued aggressive accumulation strategy and long-term conviction in Bitcoin, despite ongoing market weakness, with an average purchase price of $76,027.
Long positions are steadily exiting during the slow consolidation
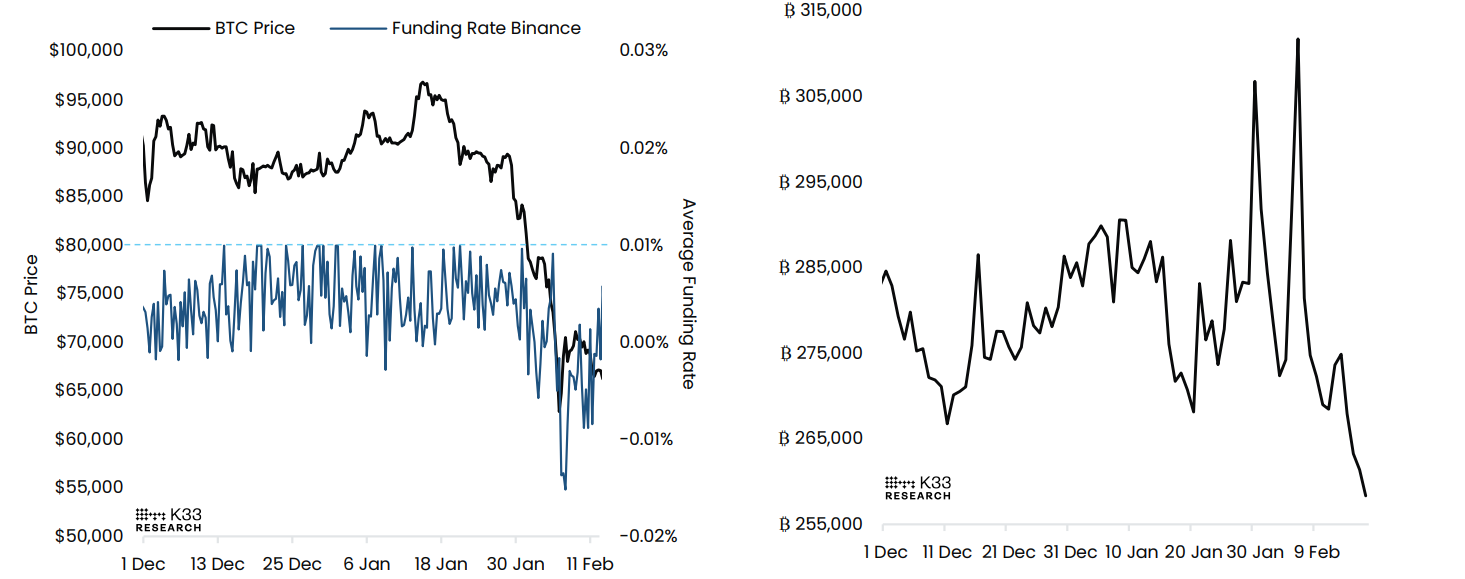
K33 Research’s Tuesday report noted that sentiment remains highly defensive in the perpetual market. The chart below shows that the funding rate averaged -0.64% over the last seven days, marking the eleventh consecutive day of negative weekly funding rates. These negative levels mirror the duration of the negative funding rate cycle between April 28 and May 8 in 2025.
As funding remained muted, notional Open Interest (OI) continued to fall, dropping below 260,000 BTC for the first time since October 12 onTuesday. These developments in the perpetual market signal that longs were steadily exiting during BTC’s slow consolidation, suggesting a low near-term risk of derivatives-driven squeezes.
Bitcoin Price Forecast: BTC could extend the fall if it closes below the lower consolidation boundary
Bitcoin price has been consolidating within a range between $65,729 and $71,746 since February 7. BTC declines 2% so far this week and, as of Wednesday, trading around $68,000 and approaching the lower consolidation boundary.
If BTC closes below the lower consolidation level at $65,729 on a daily basis, it could extend the decline toward the key support level at $60,000.
The Relative Strength Index (RSI) on the daily chart reads 35, below the neutral level of 50 and pointing downward toward the oversold levels, indicating bearish momentum gaining traction. However, the Moving Average Convergence Divergence (MACD) showed a bullish crossover on Sunday, which remains in place, suggesting that upside bias has not been invalidated yet.
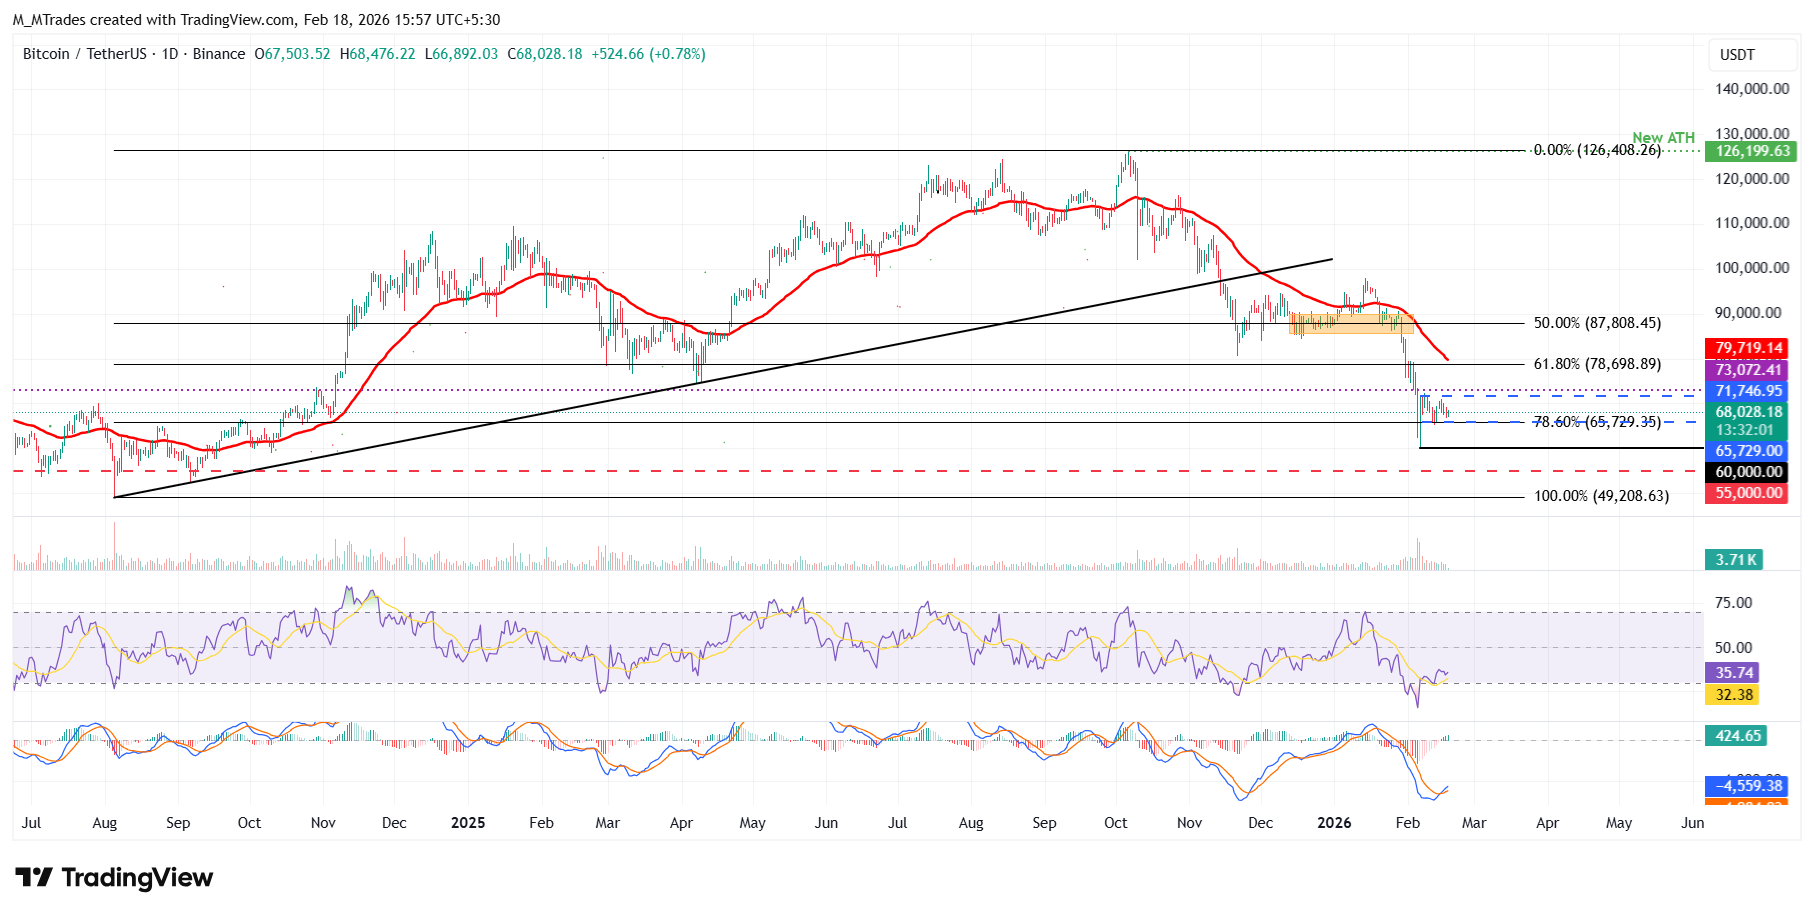
On the other hand, if BTC breaks above the upper consolidation range at $71,746 on a daily basis, it could extend the recovery toward the daily resistance at $73,072.
Bitcoin, altcoins, stablecoins FAQs
Bitcoin is the largest cryptocurrency by market capitalization, a virtual currency designed to serve as money. This form of payment cannot be controlled by any one person, group, or entity, which eliminates the need for third-party participation during financial transactions.
Altcoins are any cryptocurrency apart from Bitcoin, but some also regard Ethereum as a non-altcoin because it is from these two cryptocurrencies that forking happens. If this is true, then Litecoin is the first altcoin, forked from the Bitcoin protocol and, therefore, an “improved” version of it.
Stablecoins are cryptocurrencies designed to have a stable price, with their value backed by a reserve of the asset it represents. To achieve this, the value of any one stablecoin is pegged to a commodity or financial instrument, such as the US Dollar (USD), with its supply regulated by an algorithm or demand. The main goal of stablecoins is to provide an on/off-ramp for investors willing to trade and invest in cryptocurrencies. Stablecoins also allow investors to store value since cryptocurrencies, in general, are subject to volatility.
Bitcoin dominance is the ratio of Bitcoin's market capitalization to the total market capitalization of all cryptocurrencies combined. It provides a clear picture of Bitcoin’s interest among investors. A high BTC dominance typically happens before and during a bull run, in which investors resort to investing in relatively stable and high market capitalization cryptocurrency like Bitcoin. A drop in BTC dominance usually means that investors are moving their capital and/or profits to altcoins in a quest for higher returns, which usually triggers an explosion of altcoin rallies.
Bài viết đề xuất


