AI tokens Price Forecast: ICP tests key support, TAO and RENDER eye comeback

Nguồn Fxstreet
  • Internet Computer is under pressure near the 20-day and 50-day EMAs after a firm rejection at $4.41.
  • Bittensor could test a key descending trendline if it holds the $230 level and climbs above the 50-day EMA.
  • Render could tackle the $2.77 resistance if it flips the 100-day EMA.

Artificial Intelligence (AI) tokens joined Bitcoin (BTC) and the wider crypto market in a downtrend over the past three days amid geopolitical tensions over the US's intentions to acquire Greenland. However, a few of these tokens are looking to establish support and retest key resistance levels.

ICP under pressure near 20-day and 50-day EMAs

Internet Computer (ICP) is struggling to hold the convergence of the 20-day and 50-day Exponential Moving Averages (EMAs) as support. The move comes after seeing a sharp decline following a rejection at the resistance near $4.41, which is strengthened by the 200-day EMA.

ICP could find support near $3 if it fails to hold the 20-day and 50-day EMAs. Further down, the support at $2.70 could provide a cushion if prices decline harder.

ICP/USDT daily chart

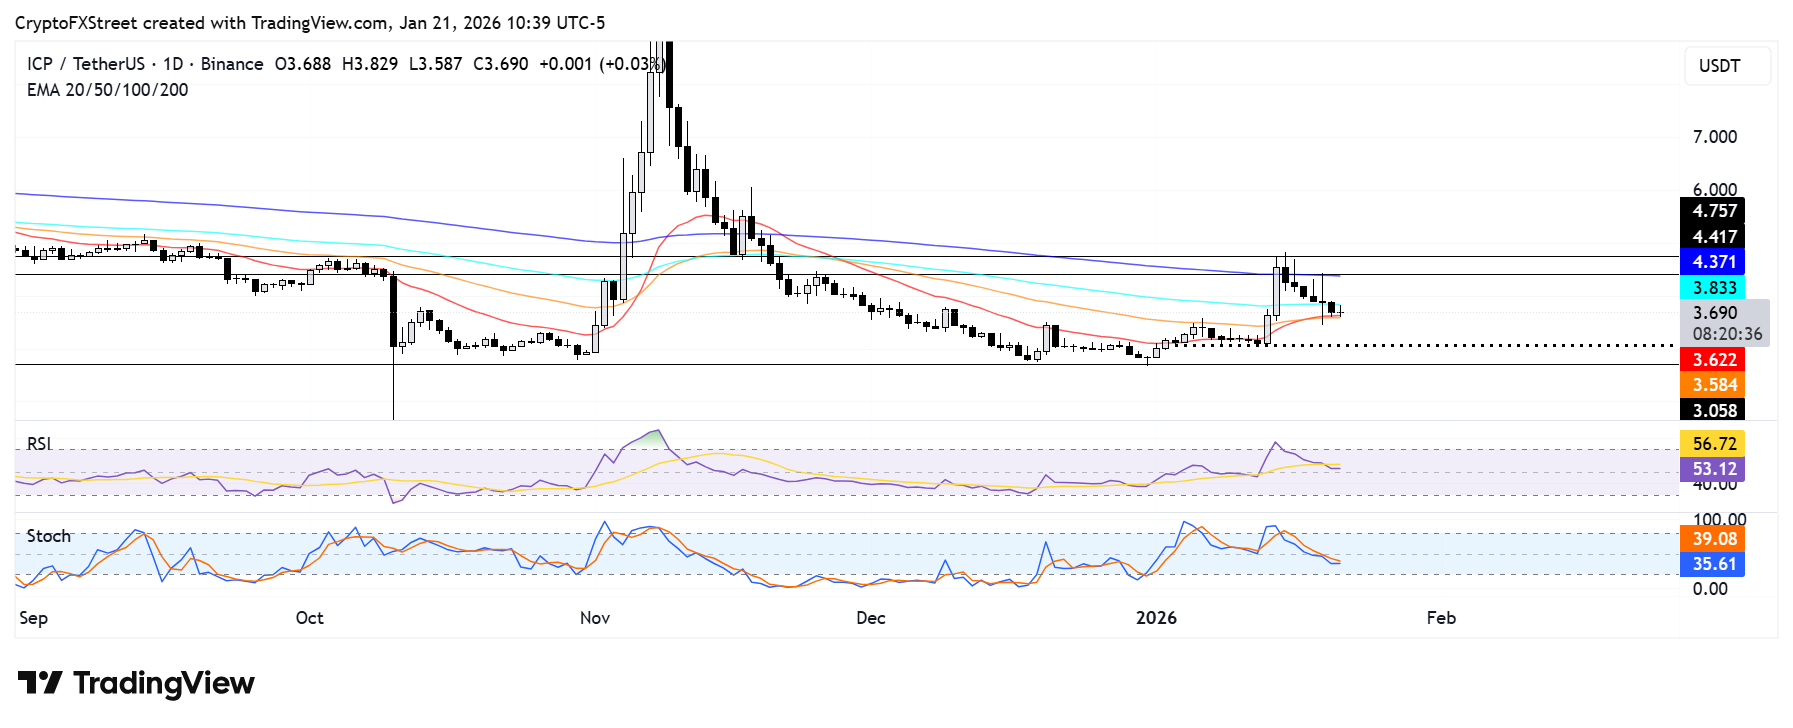
On the upside, ICP could retest $4.41 if it sustains a firm move above the 100-day EMA.

The Relative Strength Index (RSI) is testing its neutral level while the Stochastic Oscillator (Stoch) is below its midline, indicating a weakening bullish momentum.

Bittensor finds support at $230, eyes descending trendline resistance

Bittensor (TAO) is looking to hold $230 as a support level after declining below the 20-day and 50-day EMAs. The AI token has been in a downtrend over the past week, following a rejection at the $305 resistance level near the 100-day EMA.

TAO could test a descending trendline extending from November 8, if it holds the $230 level and climbs above the 50-day EMA. However, a breach of the level could see it decline to find support at $206.

TAO/USDT daily chart

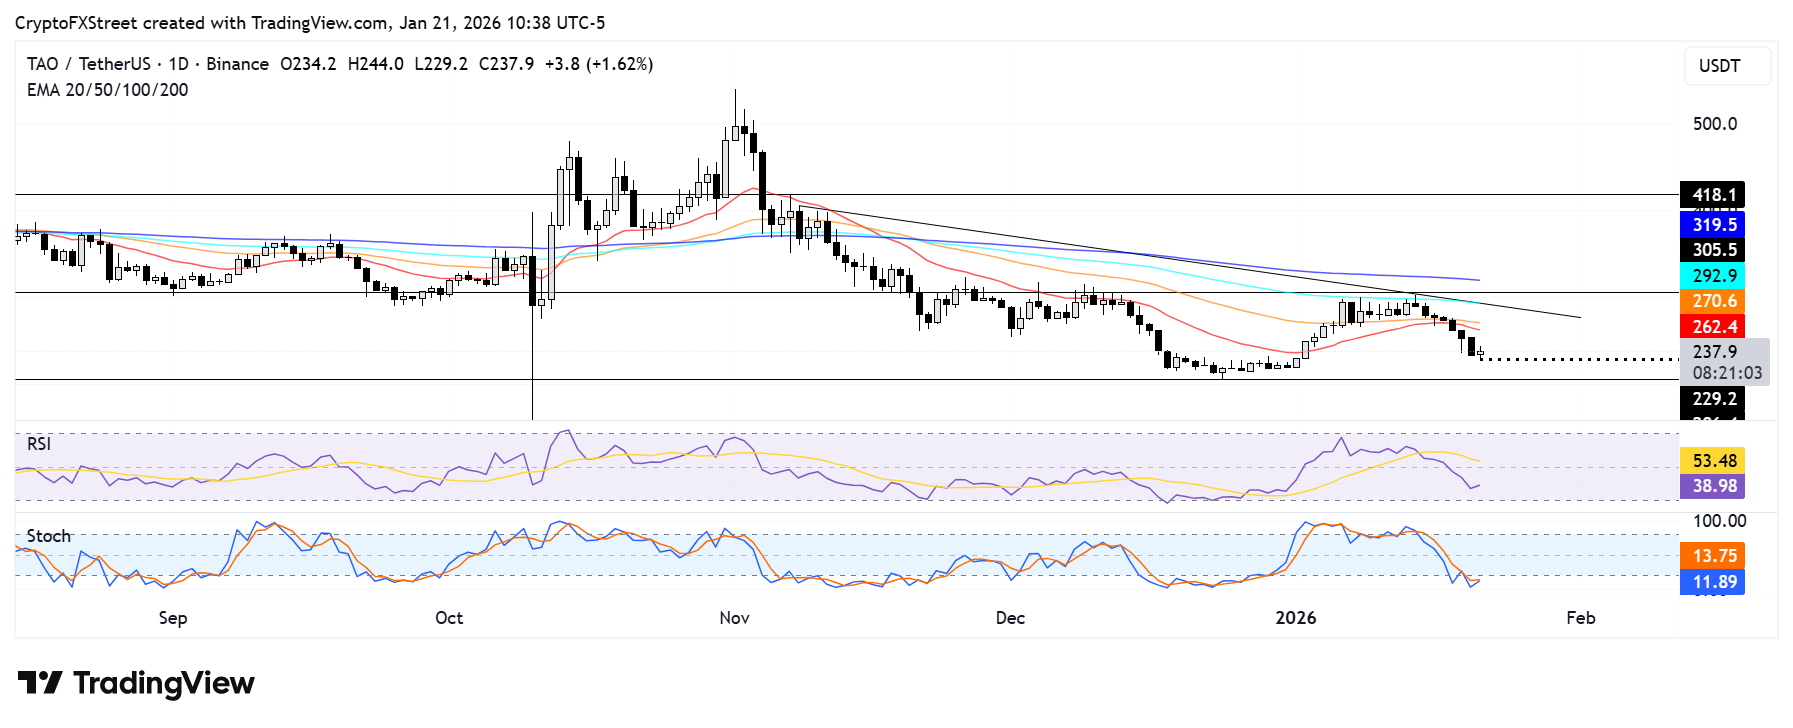
The Relative Strength Index (RSI) is below its neutral level while the Stochastic Oscillator (Stoch) is in oversold territory. Sustained oversold conditions in the Stoch could inspire a short-term recovery.

Render bounces at $1.86, tests 100-day EMA

Render (RENDER) is testing the 100-day EMA after finding support at $1.86 near the 50-day EMA.

A firm rise above the 100-day EMA could push the token to test the $2.77 resistance, just above the 200-day EMA. On the downside, RENDER could decline toward $1.19 if it breaches $1.86.

RENDER/USDT daily chart

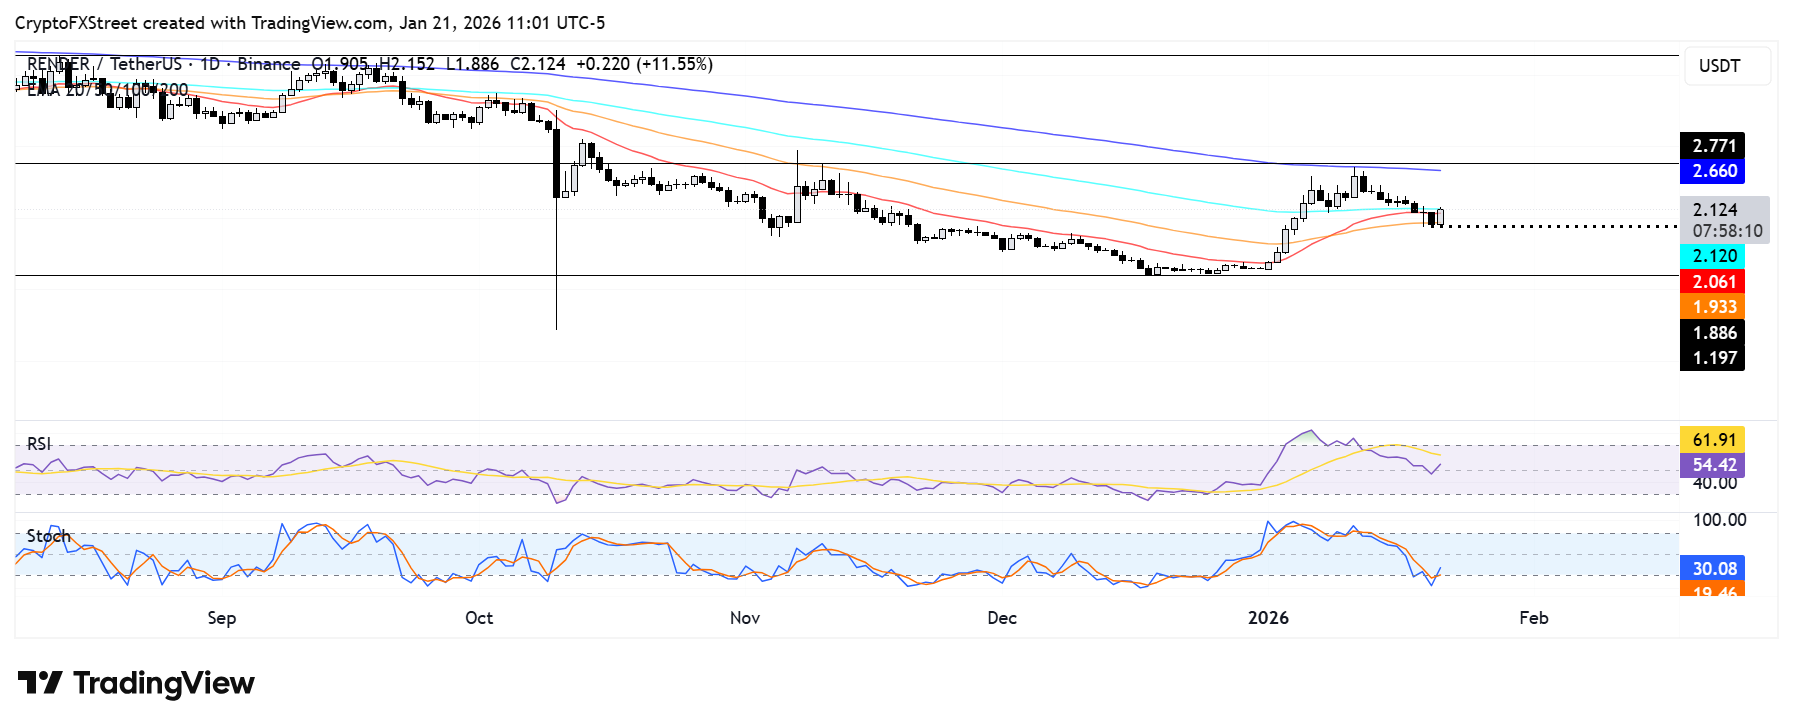
The Relative Strength Index (RSI) bounced off its neutral level, while the Stochastic Oscillator (Stoch) has retreated from oversold territory, indicating a weakening bearish momentum.

Tuyên bố miễn trừ trách nhiệm: Chỉ dành cho mục đích thông tin. Hiệu suất trong quá khứ không đảm bảo cho kết quả trong tương lai.
placeholder
Khi nào bài phát biểu của Tổng thống Mỹ Trump tại WEF ở Davos và nó có thể ảnh hưởng đến EUR/USD như thế nàoTổng thống Hoa Kỳ (Mỹ) Donald Trump dự kiến sẽ có bài phát biểu tại Diễn đàn Kinh tế Thế giới (WEF) ở Davos sau 13:00 GMT. Chuyến đi của Trump đến Davos đã bị hoãn lại sau khi Air Force One buộc phải quay trở lại do một "vấn đề điện nhỏ".
Tác giả  FXStreet
8 giờ trước
Tổng thống Hoa Kỳ (Mỹ) Donald Trump dự kiến sẽ có bài phát biểu tại Diễn đàn Kinh tế Thế giới (WEF) ở Davos sau 13:00 GMT. Chuyến đi của Trump đến Davos đã bị hoãn lại sau khi Air Force One buộc phải quay trở lại do một "vấn đề điện nhỏ".
placeholder
Bão Greenland càn quét. Chứng khoán Mỹ bốc hơi hơn 1 nghìn tỷ USD chỉ trong một ngày, Bitcoin giảm xuống dưới mốc 90.000 USD.Cuộc chiến thuế quan Greenland leo thang, tác động mạnh đến thị trường chứng khoán Mỹ và tiền điện tử, nhưng Fundstrat dự báo sẽ có sự phục hồi vào cuối năm.Vào thứ Tư (ngày 21/1), do chị
Tác giả  TradingKey
8 giờ trước
Cuộc chiến thuế quan Greenland leo thang, tác động mạnh đến thị trường chứng khoán Mỹ và tiền điện tử, nhưng Fundstrat dự báo sẽ có sự phục hồi vào cuối năm.Vào thứ Tư (ngày 21/1), do chị
placeholder
Dự báo giá bạc: XAG/USD giảm xuống mức gần 93,50$ do chốt lời sau mức cao kỷ lụcGiá bạc (XAG/USD) thu hút một số người bán quanh mức 93,60$ trong giờ giao dịch châu Á vào thứ Ba. Kim loại trắng giảm nhẹ trong bối cảnh chốt lãi sau khi đạt mức cao kỷ lục mới trong phiên giao dịch trước đó. Nhu cầu trú ẩn an toàn có thể giúp hạn chế tổn thất của bạc trong ngắn hạn
Tác giả  FXStreet
Hôm qua 02: 33
Giá bạc (XAG/USD) thu hút một số người bán quanh mức 93,60$ trong giờ giao dịch châu Á vào thứ Ba. Kim loại trắng giảm nhẹ trong bối cảnh chốt lãi sau khi đạt mức cao kỷ lục mới trong phiên giao dịch trước đó. Nhu cầu trú ẩn an toàn có thể giúp hạn chế tổn thất của bạc trong ngắn hạn
placeholder
Dự báo giá bạc: XAG/USD ghi nhận mức đỉnh mới trên 94,00$Giá bạc (XAG/USD) tăng trở lại sau hai ngày giảm, đạt mức cao kỷ lục mới 94,15$ trong những giờ đầu. Hiện tại, giá bạc đang giao dịch quanh mức 93,70$ mỗi troy ounce trong giờ giao dịch đầu tiên ở châu Âu vào thứ Hai
Tác giả  FXStreet
1 tháng 19 ngày Thứ Hai
Giá bạc (XAG/USD) tăng trở lại sau hai ngày giảm, đạt mức cao kỷ lục mới 94,15$ trong những giờ đầu. Hiện tại, giá bạc đang giao dịch quanh mức 93,70$ mỗi troy ounce trong giờ giao dịch đầu tiên ở châu Âu vào thứ Hai
placeholder
Dự báo giá vàng: XAU/USD tăng vọt lên mức cao nhất lịch sử trên 4.650$ do các mối đe dọa về thuế quan từ GreenlandGiá vàng (XAU/USD) tăng lên mức cao kỷ lục mới gần 4.675$ trong phiên giao dịch đầu ngày thứ Hai ở châu Á. Kim loại quý này tăng đà sau khi Tổng thống Mỹ Donald Trump cho biết ông sẽ áp thuế đối với tám quốc gia châu Âu đã phản đối kế hoạch của ông về việc chiếm Greenland.
Tác giả  FXStreet
1 tháng 19 ngày Thứ Hai
Giá vàng (XAU/USD) tăng lên mức cao kỷ lục mới gần 4.675$ trong phiên giao dịch đầu ngày thứ Hai ở châu Á. Kim loại quý này tăng đà sau khi Tổng thống Mỹ Donald Trump cho biết ông sẽ áp thuế đối với tám quốc gia châu Âu đã phản đối kế hoạch của ông về việc chiếm Greenland.
goTop
quote