


Ripple Price Forecast: XRP clings to $1.30 support as downside risks intensify
- XRP’s technical outlook gradually shifts from neutral to bearish, falling near $1.30 on Thursday.
- Inflation concerns in the US weigh on the broader crypto market amid very mild inflows into XRP spot ETFs.
- XRP risks deeper losses if the SuperTrend support at $1.30 breaks, as momentum indicators weigh on the technical structure.
Ripple (XRP) is stuck in a bearish trend, trading near $1.30 on Thursday. The remittance token’s bearish shift reflects the broader cryptocurrency market, which remains under heavy selling amid concerns about accelerating inflation in the United States (US).
A daily close above the key $1.30 demand area could lead to stability and range consolidation, prompting dip buyers to take on more risk. However, an extended correction will likely bring lower psychological levels within reach, including $1.12 and $1.00, respectively.
US CPI weighs on market sentiment
The US Bureau of Labor Statistics (BLS) released the Consumer Price Index (CPI) report on Wednesday, showing that headline inflation accelerated to 3.7% in September, above forecasts of 3.6%. The current figure sits above August’s 3.4%.
The Core CPI, which excludes volatile food and energy prices, rose to 2.6% annually, up from 2.4% in August. Meanwhile, headline CPI advanced to 0.6% monthly in September, compared to 0.4% in August, while core CPI posted a consistent 0.3% monthly gain for the second straight month.
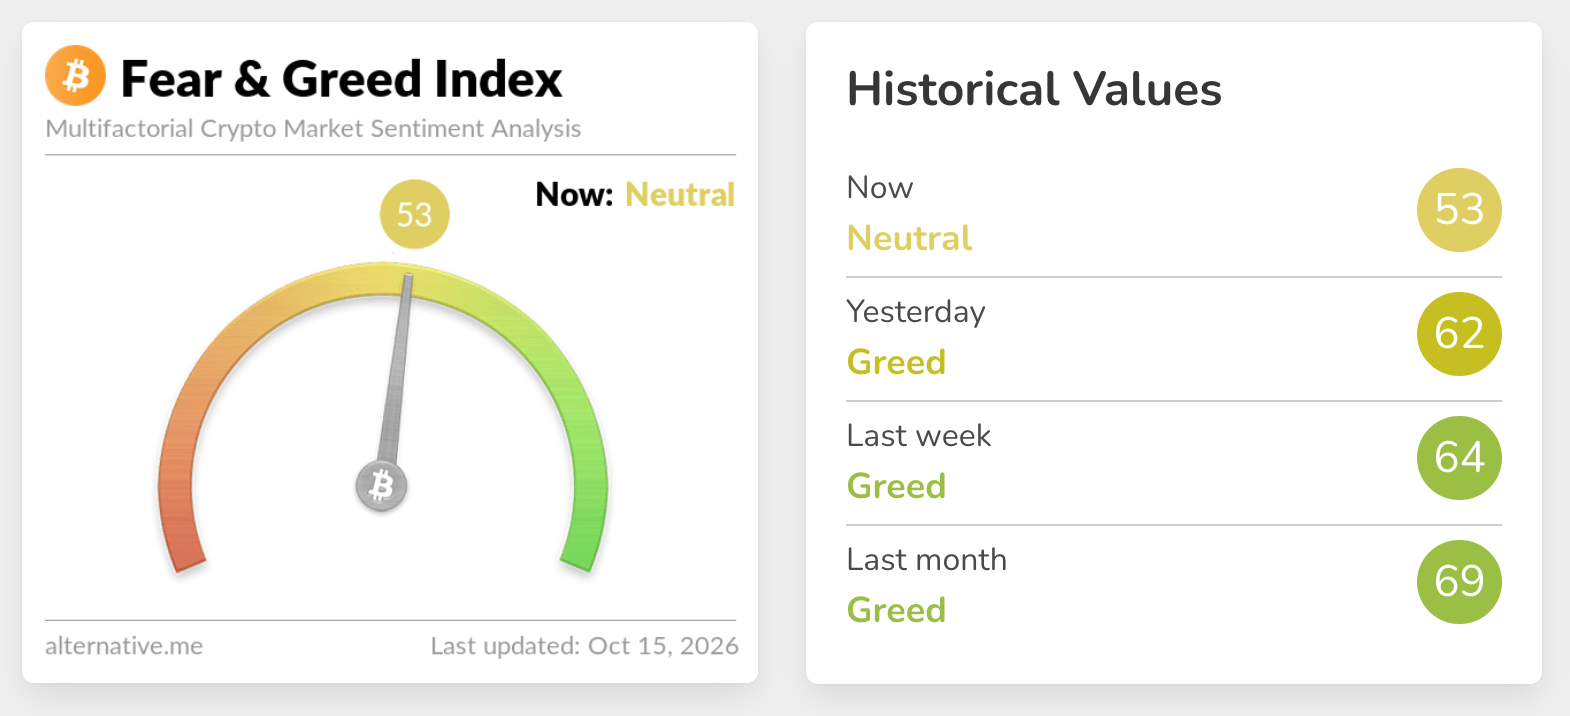
XRP fell to $1.30, mirroring a broader crypto sell-off after CPI data. Appetite for digital assets also took a hit, with the Fear & Greed Index falling to 53 in Neutral territory on Thursday, from 62 in the Greed range the day before. A sustained correction in market sentiment would dampen XRP’s short-term outlook, leaving the token largely vulnerable to sell-side pressure.
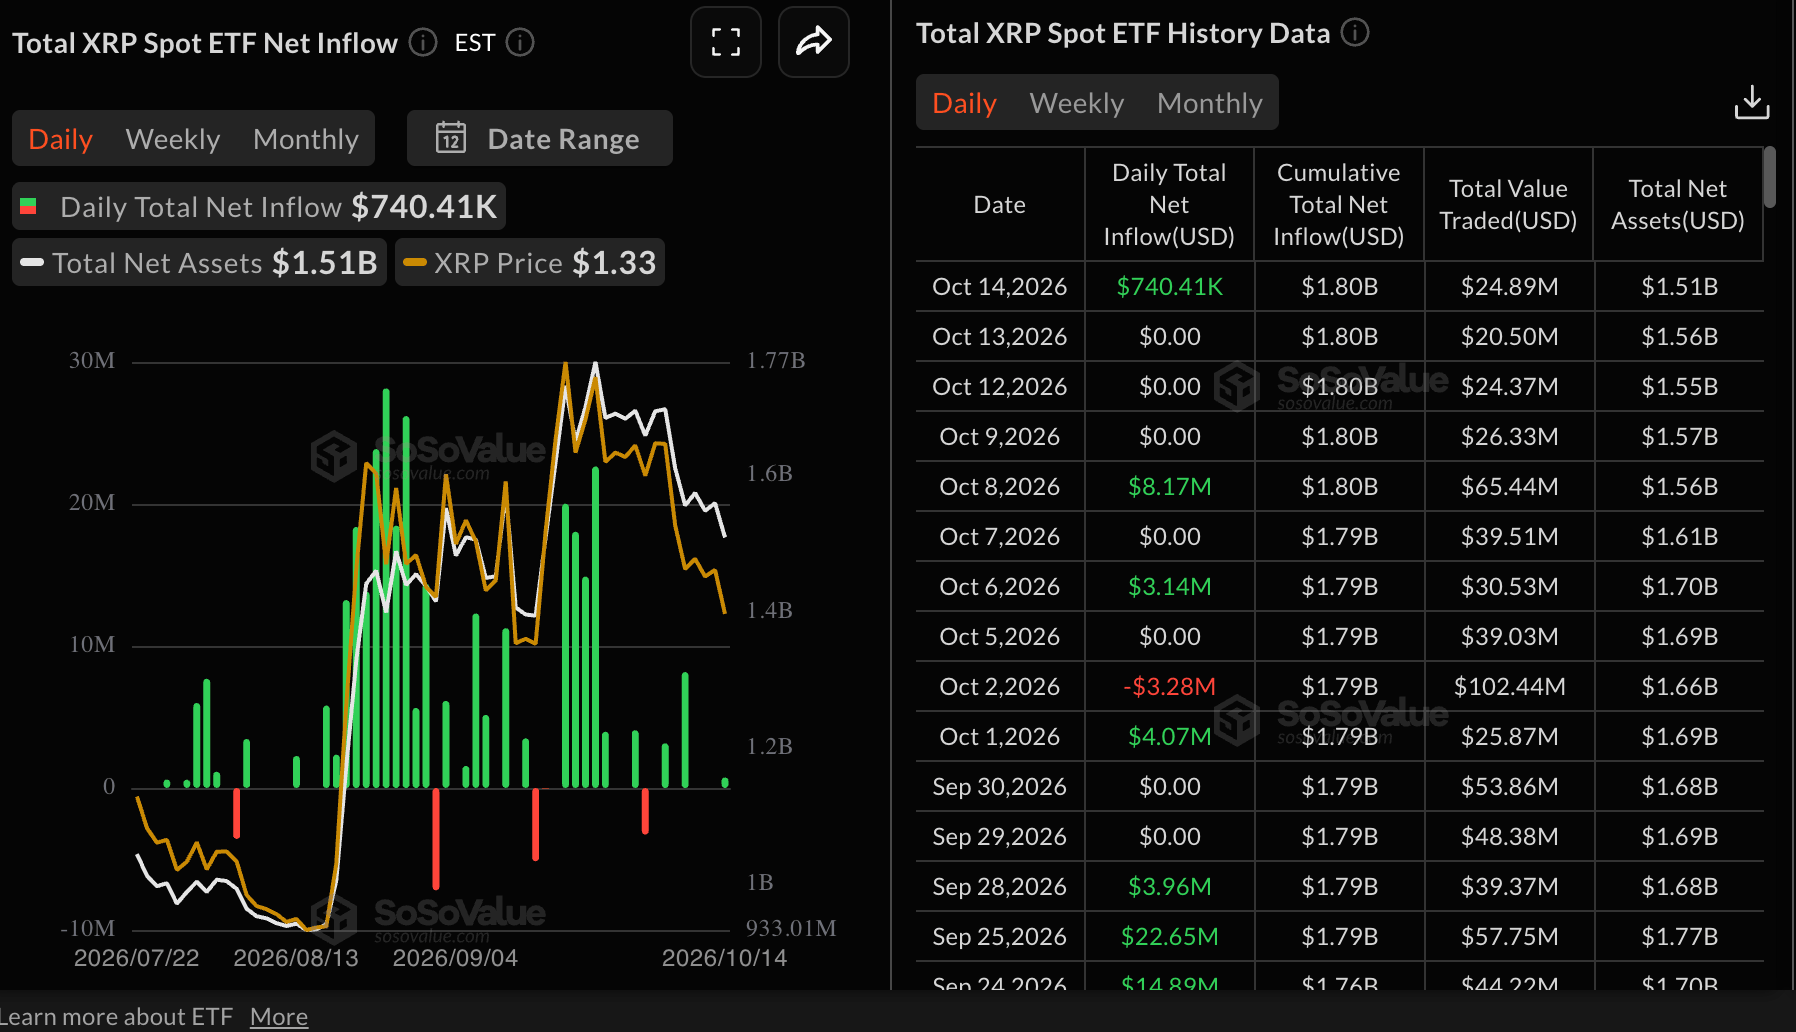
Mild inflows into spot XRP Exchange-Traded Funds (ETFs) totaling $740,000 on Wednesday align with the broader risk-averse market sentiment, suggesting that investors are reassessing their positioning amid growing inflation concerns. Moreover, ETF activity has remained muted since last Friday.
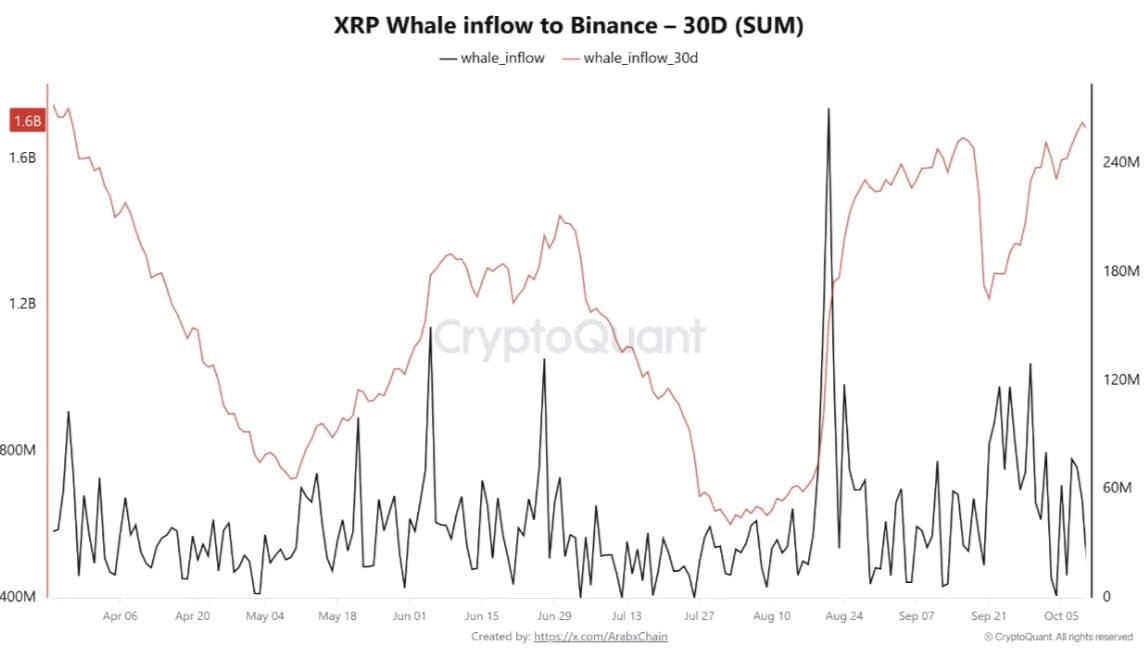
On-chain data, on the other hand, shows that whale inflows to Binance have increased, hitting a seven-month high. CryptoQuant said on X that “increased whale inflows to centralized exchanges can increase the amount of XRP available for trading, potentially raising the risk of selling pressure.”
Technical Analysis: XRP bulls fight to take back control
XRP trades around $1.30, extending a corrective bias as price holds just above the SuperTrend support at $1.30 but remains well under the key Exponential Moving Averages (EMAs). The 100-day EMA at $1.34, the 200-day EMA at $1.38 and the 50-day EMA near $1.39 all sit overhead, suggesting the pair is capped by a dense resistance band.
Momentum reinforces this bearish tone, with the Moving Average Convergence Divergence (MACD) below zero and its signal line, while the Relative Strength Index (RSI) at 36 hovers near oversold territory, hinting at waning but still dominant downside pressure.
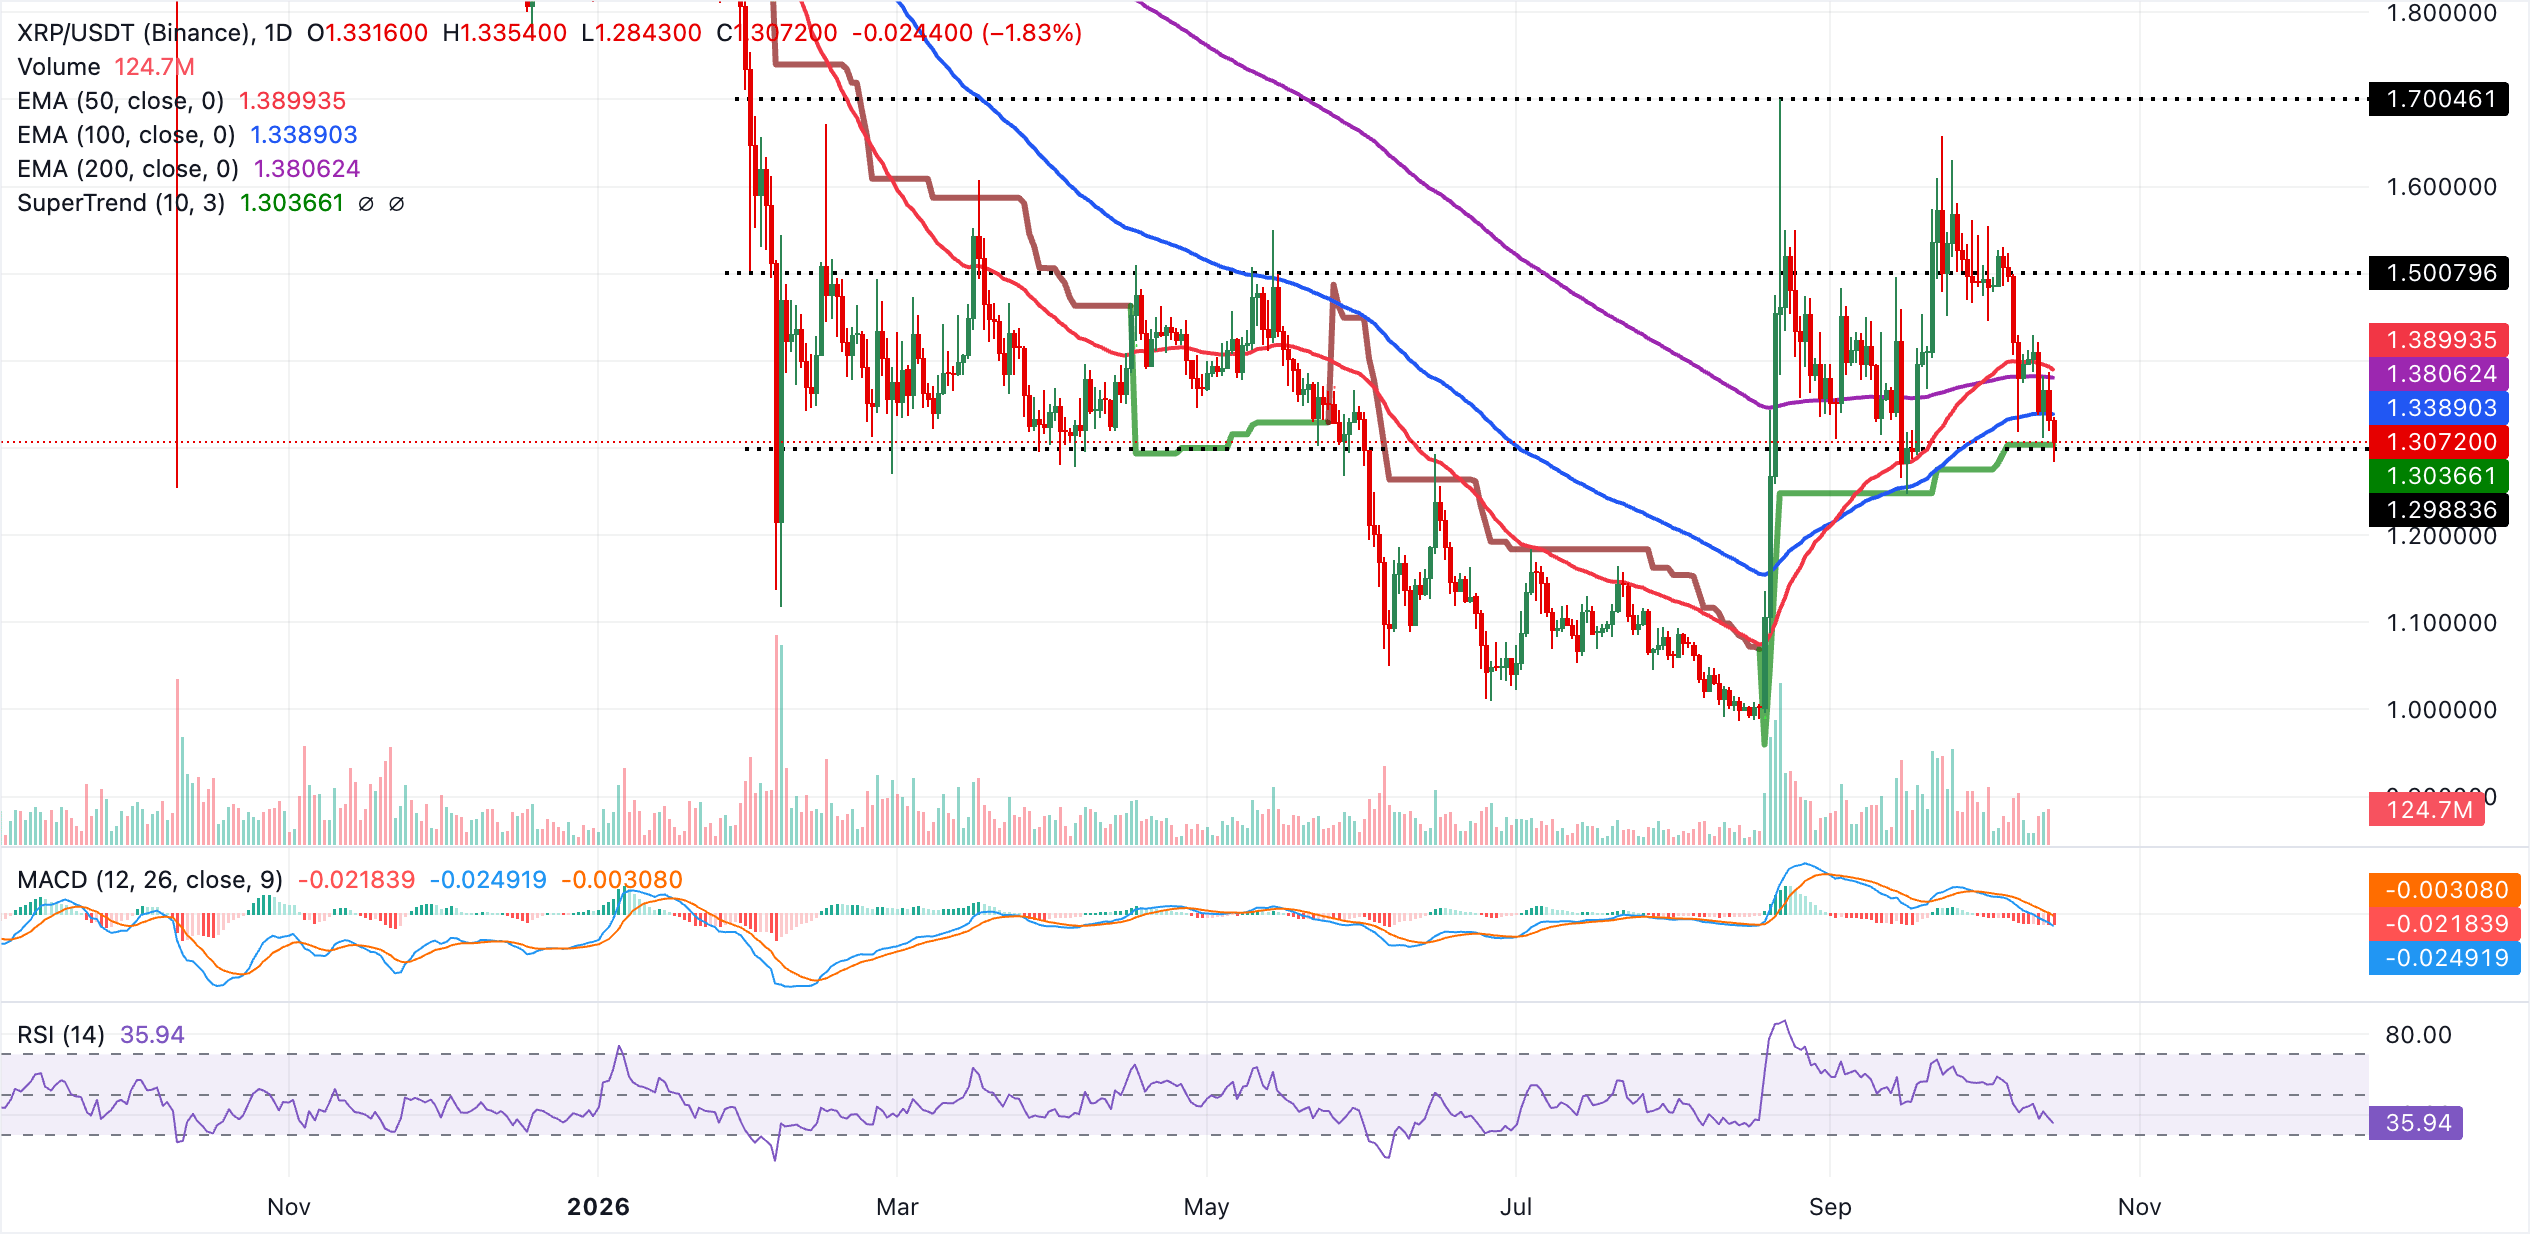
Initial resistance is at the 100-day EMA around $1.34, which would need to be reclaimed to ease immediate selling pressure, ahead of the 200-day EMA at $1.38 and the 50-day EMA at $1.39 as a broader supply zone. On the downside, near-term support is defined by the SuperTrend line at $1.30. A decisive break below this floor would expose further weakness, while holding above it keeps the door open for a corrective bounce toward the clustered moving-average resistance overhead.
(The technical analysis of this story was written with the help of an AI tool. Know more.)
Crypto ETF FAQs
An Exchange-Traded Fund (ETF) is an investment vehicle or an index that tracks the price of an underlying asset. ETFs can not only track a single asset, but a group of assets and sectors. For example, a Bitcoin ETF tracks Bitcoin’s price. ETF is a tool used by investors to gain exposure to a certain asset.
Yes. The first Bitcoin futures ETF in the US was approved by the US Securities & Exchange Commission in October 2021. A total of seven Bitcoin futures ETFs have been approved, with more than 20 still waiting for the regulator’s permission. The SEC says that the cryptocurrency industry is new and subject to manipulation, which is why it has been delaying crypto-related futures ETFs for the last few years.
Yes. The SEC approved in January 2024 the listing and trading of several Bitcoin spot Exchange-Traded Funds, opening the door to institutional capital and mainstream investors to trade the main crypto currency. The decision was hailed by the industry as a game changer.
The main advantage of crypto ETFs is the possibility of gaining exposure to a cryptocurrency without ownership, reducing the risk and cost of holding the asset. Other pros are a lower learning curve and higher security for investors since ETFs take charge of securing the underlying asset holdings. As for the main drawbacks, the main one is that as an investor you can’t have direct ownership of the asset, or, as they say in crypto, “not your keys, not your coins.” Other disadvantages are higher costs associated with holding crypto since ETFs charge fees for active management. Finally, even though investing in ETFs reduces the risk of holding an asset, price swings in the underlying cryptocurrency are likely to be reflected in the investment vehicle too.
Bài viết đề xuất


