


Bitcoin Price Forecast: BTC slips below $81,000 amid inflation fears, ETF outflows
- Bitcoin slips below $81,000 on Thursday as hotter-than-expected US CPI data weighs on the market.
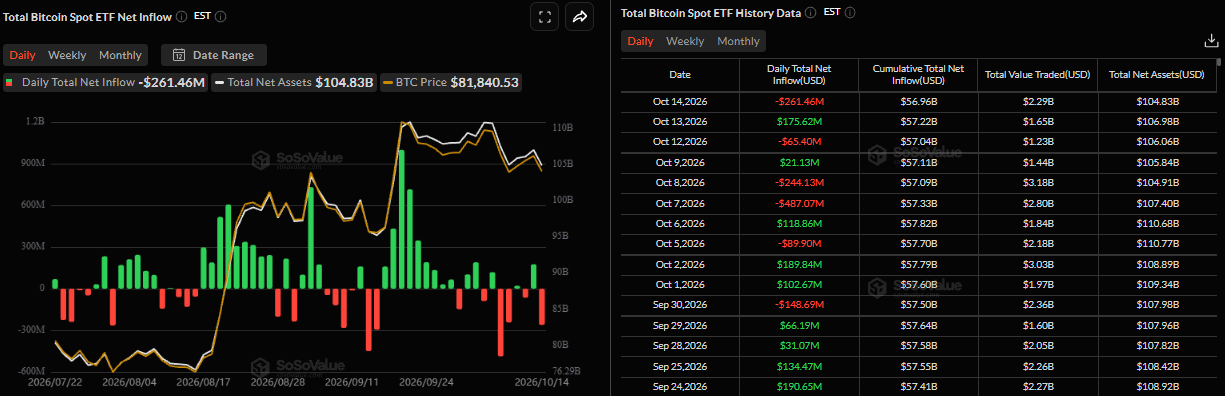
- US-listed spot ETFs recorded $261.46 million in outflows on Wednesday, signaling institutional demand weakness.
- Market participants now look to US PPI for some impetus ahead of Fed Chair Warsh’s speech on Friday.
Bitcoin (BTC) extends losses, slipping below $81,000 on Thursday as hotter-than-expected US inflation data weigh on market sentiment. Institutional demand weakens as BTC spot Exchange-Traded Funds (ETFs) recorded an outflow of over $261 million on Wednesday. Meanwhile, investors will look to Thursday's US Producer Price Index (PPI) report and Friday's Federal Reserve (Fed) Chair Kevin Warsh’s speech for fresh clues on the monetary policy outlook, which could provide the next directional bias for the Crypto King.
Sticky inflation caps risky assets
US Consumer Price Index (CPI) data released on Wednesday showed the annual rate at 3.7% in September, hotter than expected and up from August’s 3.4%. Moreover, core CPI, excluding volatile food and energy prices, increased 2.6% YoY in the same month, up from August’s 2.4%. Meanwhile, headline and core CPI rose 0.6% and 0.3% month-over-month, respectively.
These hotter figures pointed to broader inflation pressures, reaffirming market bets on further Fed tightening.
According to the CME FedWatch Tool, traders are pricing in a 27% probability of a 25-basis-point (bps) rate hike at the October policy meeting, up from 17% last Friday. Rising expectations of tighter monetary policy are pressuring risk-sensitive assets.
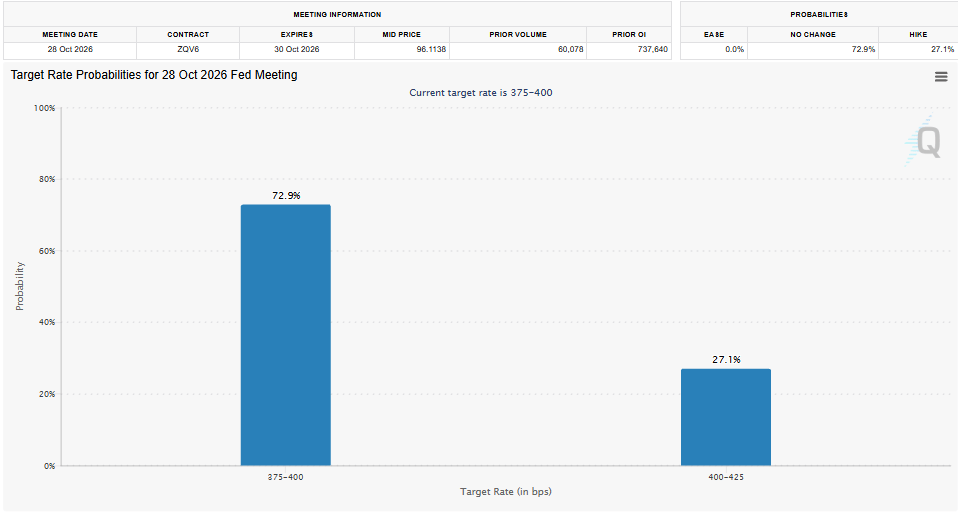
Traders now look forward to the US Producer Price Index (PPI) release on Thursday. In addition, Fed Chair Kevin Warsh’s speech on Friday will be watched for more cues on the future policy path, which will play a key role in near-term US Dollar (USD) price dynamics and provide meaningful impetus to risky assets such as BTC.
Cooling institutional demand
Institutional demand remains mixed with a slight bearish tilt so far this week. SoSoValue data show BTC spot ETFs recorded an outflow of $261.46 million on Wednesday after an inflow of $175.62 million on Tuesday and a mild outflow of $65.40 million on Monday. If these withdrawals continue and intensify through the week, BTC could dip further.
Bitcoin technical outlook: Momentum shows cooling signs
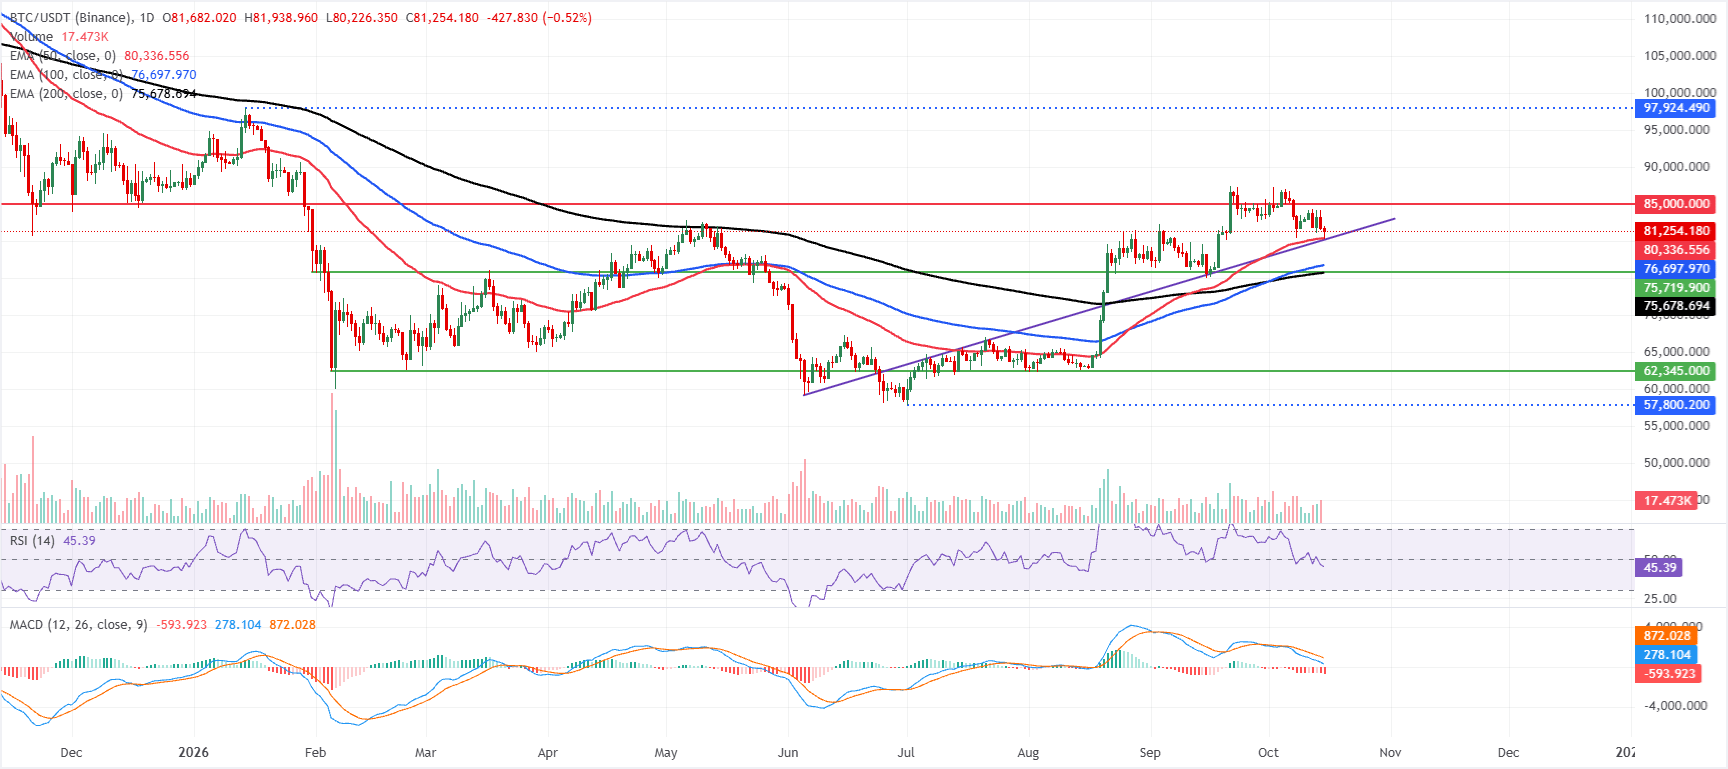
Bitcoin price trades at $81,254 at the time of writing on Thursday, after correcting more than 2.8% so far this week. Despite the pullback, BTC is holding above the 50-day Exponential Moving Average (EMA) at $80,336, the 100-day EMA at $76,697, and the 200-day EMA at $75,678, which collectively underpin a constructive near-term bias.
However, momentum has cooled on the daily chart, with the Relative Strength Index (RSI) slipping below the neutral 50 level to 45. The Moving Average Convergence Divergence (MACD) histogram remains negative, hinting that the latest advance is consolidating rather than accelerating.
On the topside, the next notable obstacle is horizontal resistance near $85,000, where previous supply may re-emerge if buyers extend the move.
On the downside, initial support is the 50-day EMA at $80,336. A deeper pullback would expose the 100-day EMA at $76,697, then the 200-day EMA at $75,678 as broader trend-defining floors.
(The technical analysis of this story was written with the help of an AI tool. Know more.)
Bitcoin, altcoins, stablecoins FAQs
Bitcoin is the largest cryptocurrency by market capitalization, a virtual currency designed to serve as money. This form of payment cannot be controlled by any one person, group, or entity, which eliminates the need for third-party participation during financial transactions.
Altcoins are any cryptocurrency apart from Bitcoin, but some also regard Ethereum as a non-altcoin because it is from these two cryptocurrencies that forking happens. If this is true, then Litecoin is the first altcoin, forked from the Bitcoin protocol and, therefore, an “improved” version of it.
Stablecoins are cryptocurrencies designed to have a stable price, with their value backed by a reserve of the asset it represents. To achieve this, the value of any one stablecoin is pegged to a commodity or financial instrument, such as the US Dollar (USD), with its supply regulated by an algorithm or demand. The main goal of stablecoins is to provide an on/off-ramp for investors willing to trade and invest in cryptocurrencies. Stablecoins also allow investors to store value since cryptocurrencies, in general, are subject to volatility.
Bitcoin dominance is the ratio of Bitcoin's market capitalization to the total market capitalization of all cryptocurrencies combined. It provides a clear picture of Bitcoin’s interest among investors. A high BTC dominance typically happens before and during a bull run, in which investors resort to investing in relatively stable and high market capitalization cryptocurrency like Bitcoin. A drop in BTC dominance usually means that investors are moving their capital and/or profits to altcoins in a quest for higher returns, which usually triggers an explosion of altcoin rallies.
Bài viết đề xuất


