

Zcash Price Forecast: ZEC declines as US inflation surprise offsets fresh ETF inflows

Nguồn Fxstreet
  • Zcash extends losses on Thursday after declining nearly 6% the previous day.
  • Hotter-than-expected US CPI data print of 3.7% annual increase in headline inflation raises inflation and rate hike concerns.
  • Grayscale’s Zcash ETF recorded over $3 million in inflows on Wednesday, marking a positive turnaround after two consecutive weeks of outflows.

Zcash (ZEC) is trading in the red on Friday, extending its previous day’s roughly 6% losses as the broader cryptocurrency market falls on rising US inflation. The US Consumer Price Index (CPI) print came in higher than expected, at an annual increase of 3.7% versus the expected 3.6%, raising concerns about inflation and rate hikes. The macroeconomic concerns offset the renewed positive inflows in Grayscale’s ZEC-focused Exchange Traded Fund (ETF), with over $3 million in inflows on Wednesday. 

Zcash risks a four-hour close below last week’s low of $1,115, which could extend the decline toward the $1,000 psychological support level.

Macro pressure offsets institutional demand

The US inflation surprise with the annual CPI print at 3.7%, above forecasts of 3.6%, fuels a near-term sell-off in the broader crypto market. The Crypto King, Bitcoin (BTC), faces a downside risk below $80,000, as previously reported by FXStreet, which could further boost selling pressure across altcoins. 

On the other hand, Grayscale’s Zcash ETF (ZCSH) recorded $3.68 million in inflows after two consecutive days of outflows, which followed two consecutive weekly outflows, signaling a mild improvement in institutional confidence. The signs of renewed buying pressure in the ZCSH ETF fail to offset the macroeconomic headwinds, extending the privacy coin’s pullback in the spot market.
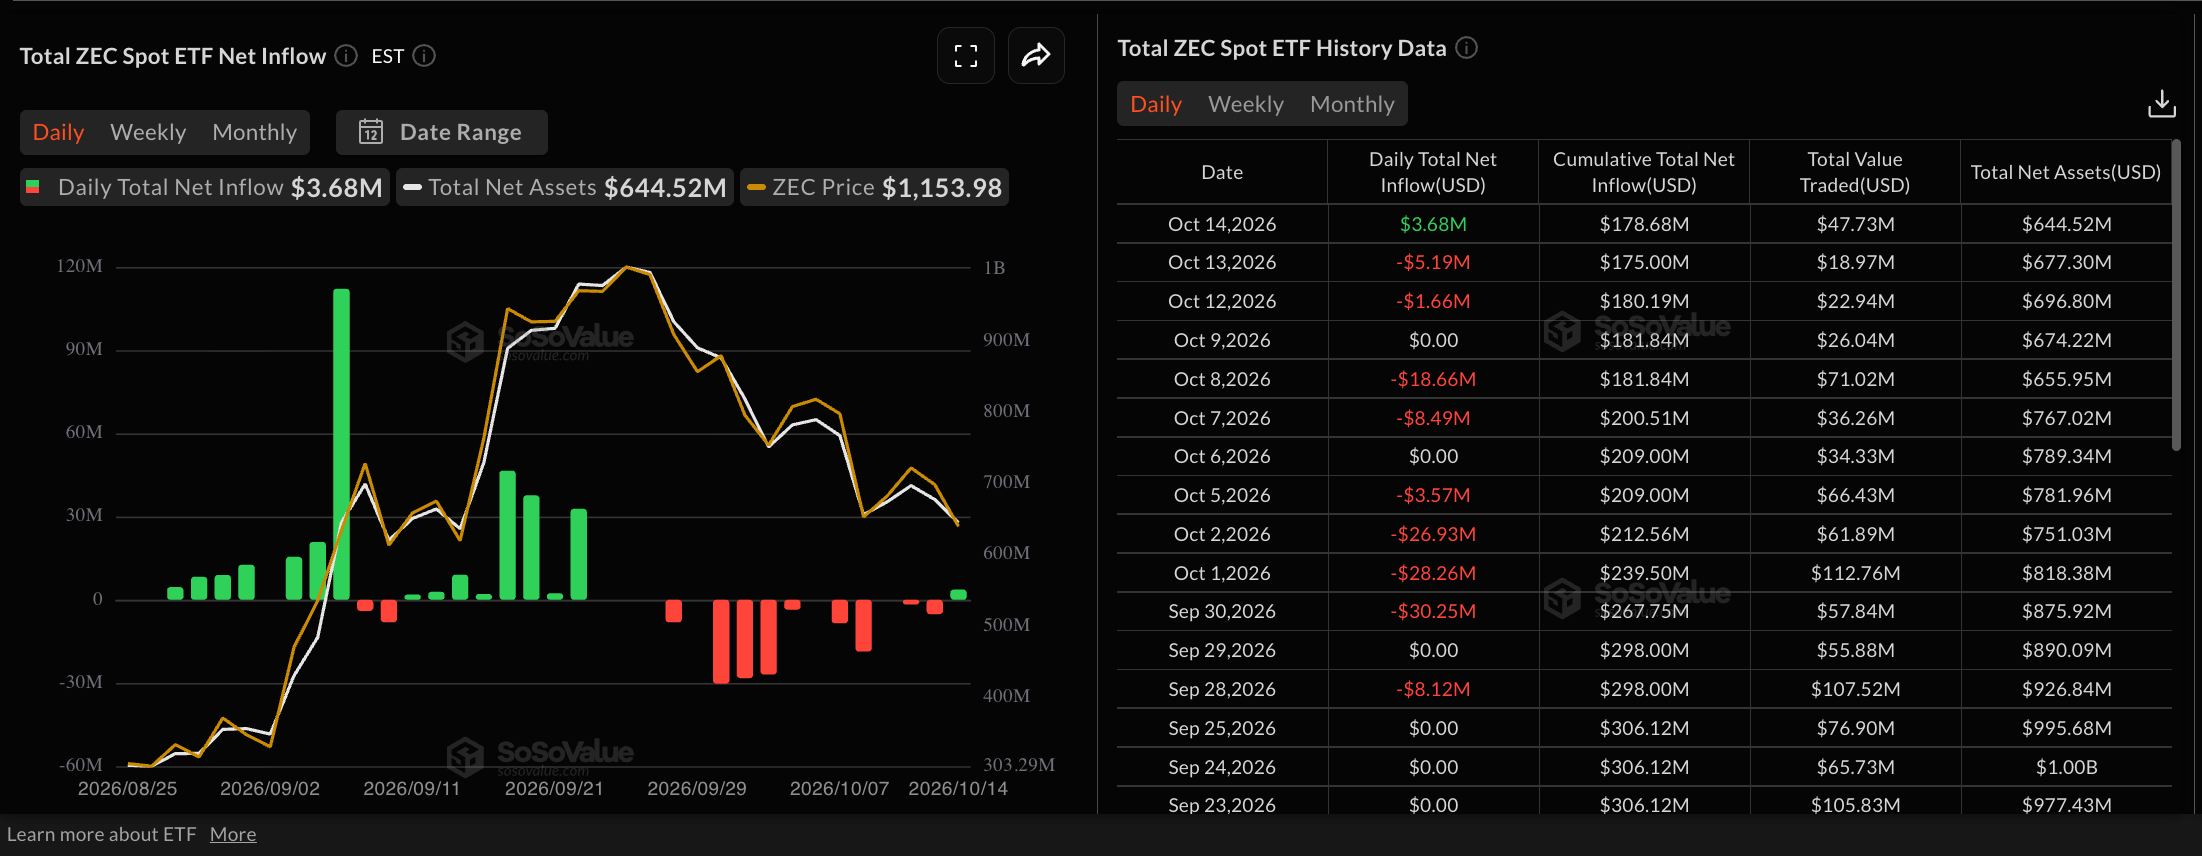
Zcash ETFs data. Source: Sosovalue

Technical outlook: Could Zcash price fall below $1,000?

Zcash trades around $1,111 at press time on Thursday, extending a corrective phase after forming the $1,698 peak in late September. The privacy coin sits well beneath the 50-period Exponential Moving Average (EMA) on the four-hour chart at $1,242 and the 200-period EMA at $1,264, keeping the pair firmly capped in the near term.

Momentum reinforces this negative tone, with the Moving Average Convergence Divergence (MACD) and its signal line extending below zero and showing deeply negative histogram bars, while the Relative Strength Index (RSI) hovers just above oversold territory at 34, hinting that sellers remain in control.

From a technical perspective, Zcash is testing the bearish breakout below last week's low at $1,115 on the four-hour chart. A sustained close could extend the decline toward the September 4 high of $1,050, with the $1,000 psychological threshold providing strong support. Any deeper pullbacks show an extended 15% downside risk, potentially targeting the August 23 high at $888.

Chart Analysis ZEC/USDT (Binance)
ZEC/USDT four-hour price chart.

On the topside, initial resistance is located at the 50-period EMA around $1,242, followed by the 200-period EMA at $1,264, which together define a dense supply zone that Zcash would need to reclaim to ease downside pressure.

(The technical analysis of this story was written with the help of an AI tool. Know more.)

Tuyên bố miễn trừ trách nhiệm: Chỉ dành cho mục đích thông tin. Hiệu suất trong quá khứ không đảm bảo cho kết quả trong tương lai.
placeholder
Dự đoán tỷ giá Yên Nhật 2024: Đã đến lúc giao dịch USD/JPY? Bắt đầu tư đầu tháng 3/2022 giá đồng Yên Nhật bắt đầu suy giảm nhanh chóng so với đồng đô la Mỹ. Ngày 20/4/2022 tỷ giá USD/JPY thậm chí chạm mốc 129, tỷ giá cao nhất trong vòng 20 năm trở lại đây, khiến cho cả nhà đầu tư lẫn các nhà chính sách tiền tệ của hai nước phải quan ngại.
Tác giả  Nhóm Traderins
ngày22 tháng 3 năm 2024
Bắt đầu tư đầu tháng 3/2022 giá đồng Yên Nhật bắt đầu suy giảm nhanh chóng so với đồng đô la Mỹ. Ngày 20/4/2022 tỷ giá USD/JPY thậm chí chạm mốc 129, tỷ giá cao nhất trong vòng 20 năm trở lại đây, khiến cho cả nhà đầu tư lẫn các nhà chính sách tiền tệ của hai nước phải quan ngại.
placeholder
Nhìn lại lịch sử giá vàng trong 50 năm qua. Liệu vàng còn tiếp tục thời kỳ hoàng kim thêm 50 năm nữa? Trong 50 năm qua, vàng vẫn luôn giữ được vị thế là tài sản được ưa chuộng và phổ biến nhất thế giới. Giao dịch vàng luôn được các nhà đầu tư quan tâm do mức độ thanh khoản cao và tầm ảnh hưởng lớn đến toàn bộ thị trường tài chính. Vậy, lịch sử giá vàng như thế nào và cách đầu tư vàng ra sao? Chúng ta sẽ cùng tìm hiểu qua bài viết dưới đây.
Tác giả  Nhóm Traderins
ngày11 tháng 12 năm 2023
Trong 50 năm qua, vàng vẫn luôn giữ được vị thế là tài sản được ưa chuộng và phổ biến nhất thế giới. Giao dịch vàng luôn được các nhà đầu tư quan tâm do mức độ thanh khoản cao và tầm ảnh hưởng lớn đến toàn bộ thị trường tài chính. Vậy, lịch sử giá vàng như thế nào và cách đầu tư vàng ra sao? Chúng ta sẽ cùng tìm hiểu qua bài viết dưới đây.
placeholder
WTI giữ vững trên mức 84,50$ khi lo ngại gia tăng về các lệnh trừng phạt của Mỹ đối với IranGiá dầu West Texas Intermediate (WTI) tăng sau khi ghi nhận mức giảm hơn 2% trong ngày trước đó, giao dịch quanh mức 84,70$/thùng trong giờ châu Á vào thứ Ba.
Tác giả  FXStreet
8 tháng 25 ngày Thứ Ba
Giá dầu West Texas Intermediate (WTI) tăng sau khi ghi nhận mức giảm hơn 2% trong ngày trước đó, giao dịch quanh mức 84,70$/thùng trong giờ châu Á vào thứ Ba.
placeholder
WTI đạt mức tăng khiêm tốn trên mức 88,50$ nhờ mức giảm bất ngờ của EIA, xung đột ở Trung Đông được chú ýWest Texas Intermediate (WTI), chuẩn dầu thô của Mỹ, đang giao dịch quanh mức 88,55$ trong đầu phiên giao dịch châu Á vào thứ Năm. WTI ghi nhận mức tăng khiêm tốn khi tồn kho dầu thô Mỹ bất ngờ giảm vào tuần trước
Tác giả  FXStreet
10 tháng 08 ngày Thứ Năm
West Texas Intermediate (WTI), chuẩn dầu thô của Mỹ, đang giao dịch quanh mức 88,55$ trong đầu phiên giao dịch châu Á vào thứ Năm. WTI ghi nhận mức tăng khiêm tốn khi tồn kho dầu thô Mỹ bất ngờ giảm vào tuần trước
placeholder
Yên Nhật tăng lên mức cao nhất trong một tuần khi lợi suất trái phiếu Mỹ giảm gây áp lực lên USDCặp USD/JPY kéo dài đà giảm do bị từ chối của ngày hôm trước từ khu vực 159,00, hay đỉnh ba tuần, thu hút một số lực bán tiếp diễn trong phiên giao dịch châu Á vào thứ Năm.
Tác giả  FXStreet
3 giờ trước
Cặp USD/JPY kéo dài đà giảm do bị từ chối của ngày hôm trước từ khu vực 159,00, hay đỉnh ba tuần, thu hút một số lực bán tiếp diễn trong phiên giao dịch châu Á vào thứ Năm.
goTop
quote