


Ethereum Price Forecast: ETH holds $2,500 as open interest drops to lowest level since February
Ethereum price today: $2,510
- Ethereum open interest and leverage ratio have declined to their lowest levels in months amid recent liquidations.
- US sentiment continues to plunge as ETH ETFs record their longest outflow streak since June.
- ETH faces resistance at $2,548.
Ethereum (ETH) quickly bounced back above $2,500 on Tuesday after sharp Asian equity selloffs briefly spilled into the crypto market.
South Korea's KOSPI declined 5.4% while Japan's Nikkei 225 dropped by 1.8%. The volatility spike bled into cryptocurrencies, triggering a cascade of forced liquidations. Over $700 million was liquidated within the 24-hour window, with Ethereum futures accounting for nearly $170 million.
However, the market quickly recovered in a V-shaped rebound despite weakness in derivatives.
Weak derivatives weigh on Ethereum
Open interest (OI), which measures the total value of outstanding contracts in a derivatives market, dropped to $12.26 million ETH, marking its lowest level since February.
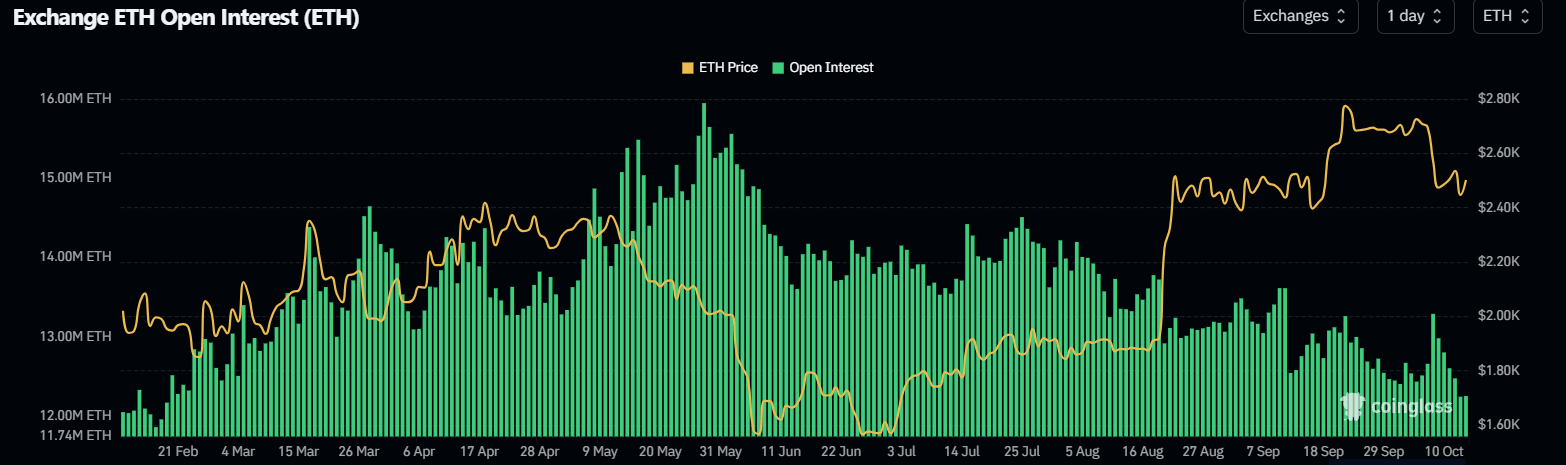
The Estimated Leverage Ratio (ELR) also paints a similar picture. The metric measures the ratio of an asset's open interest to its spot exchange reserve, indicating how much leverage traders are employing across active derivatives positions.
ETH's ELR has fallen to nearly a one-year low at 0.62, its lowest since November 2025. The decline is notable as the top altcoin's Exchange Reserve is also on a downtrend. Combined with the drop in open interest, this suggests leveraged capital is lacking in recent upward price moves.
-1791925194979.png)
Despite that, most recent ETH perpetuals volume remains dominated by short positioning. The Net Taker Volume, which tracks the difference between buying and selling volume of traders using market orders, has continued to post rising negative values.
-1791925168815.png)
While this suggests continued caution among traders, it also reduces the risk of an extended long squeeze.
Meanwhile, ETH US sentiment continues its downward trajectory. The Coinbase Premium Index, which is a measure of US traders' interest, dropped to -0.117, its lowest since August 10.
-1791925121914.png)
In addition, US spot ETH exchange-traded funds (ETFs) recorded $85.4 million in outflows on Monday, per SoSoValue data. The products have now posted ten consecutive days of outflows, their largest streak since the May 11 to June 3 period.
Ethereum technical outlook: ETH faces resistance at $2,548
On the daily chart, ETH holds a mildly bullish near-term bias as it looks to firmly reclaim the 50-day Exponential Moving Average (EMA) at $2,501, but is capped by the $2,548 resistance. Momentum indicators show only modest downside pressure, with the 14-day Relative Strength Index (RSI) at 43 and the Stochastic Oscillator (Stoch) slipping into oversold territory near 27.
On the topside, initial resistance is seen at the horizontal barrier near $2,548, followed by the 20-day EMA hurdle at $2,578. A break would open the way toward higher targets at $2,636 and $2,781 before the more distant levels at $3,075 and $3,253.
-1791925381715.png)
On the downside, immediate support is at $2,413 and then the $2,355 and 100-day EMA confluence, ahead of more substantial cushions at $2,204 and $1,971.
(The technical analysis of this story was written with the help of an AI tool. Know more.)
Bài viết đề xuất


