


Bitcoin price forecast: BTC dips as ETF inflows meet Fed headwinds
- Bitcoin edges lower, trading below $82,800 on Monday after gaining over 4% the previous week.
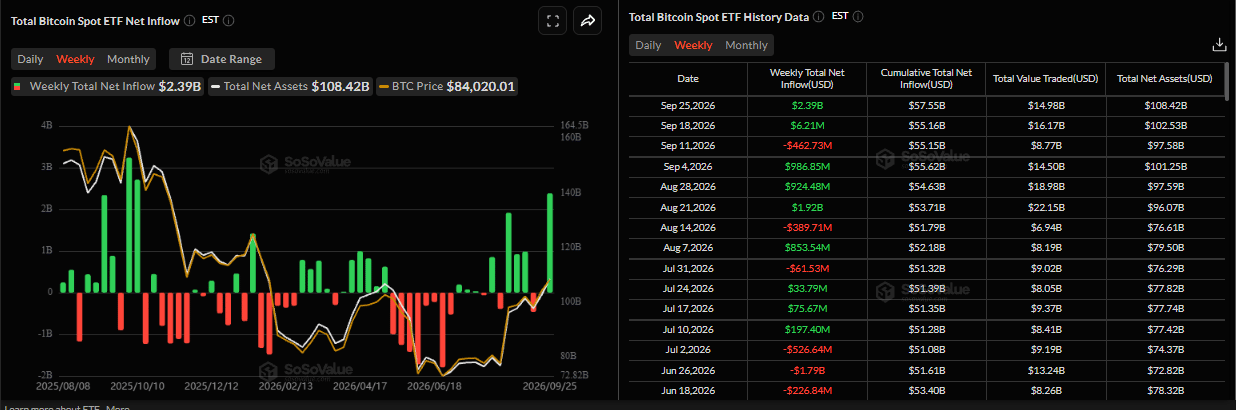
- US-listed spot ETFs recorded $2.39 billion in inflows last week, the highest weekly inflow since October 2025.
- Rising US Treasury yields and expectations of further Fed tightening could limit Crypto King’s near-term upside.
Bitcoin (BTC) trades below $82,800 at the time of writing on Monday after gaining over 4% last week, with the rally losing momentum near recent highs. Strong institutional demand, supported by spot Bitcoin Exchange Traded Fund (ETF) inflows, continues to drive demand. However, elevated US Treasury yields and expectations of further Federal Reserve (Fed) tightening could weigh on the Crypto King’s upside.
Robust institutional demand
Bitcoin’s institutional demand supported its price last week. SoSoValue data showed that spot ETFs recorded a net inflow of $2.39 billion last week, the highest weekly inflow since October 2025. If these inflows continue and intensify throughout the week, BTC could extend the ongoing rally.
Rising yields challenge BTC’s rally
In an exclusive interview, Simon-Peter Massabni, Head of Business Development at XS.com, told FXStreet that Bitcoin’s retreat from its recent peak shows that upward momentum is weakening as US Treasury yields remain elevated. Investors are turning cautious ahead of several key economic releases.
He noted that this performance suggests BTC continues to behave primarily as a risk asset, highly sensitive to liquidity conditions. When Treasury yields decline and technology stocks advance, capital tends to flow back into the cryptocurrency market. Conversely, when yields rise above 5%, and expectations of further rate hikes strengthen, the opportunity cost of holding Bitcoin increases, making investors more inclined to take profits following rapid rallies.
Massabni expects ETF inflows to continue supporting Bitcoin, although slowing demand could limit further gains. Bitcoin’s outlook this week will depend heavily on the US JOLTS report, the US Personal Consumption Expenditures (PCE) and the Nonfarm Payrolls report, the three of them due on Tuesday, Wednesday and Friday, respectively.
“If economic data cools and ETF inflows accelerate, Bitcoin could retest $87,000–$90,000. Conversely, persistent inflation and weaker ETF inflows could push Bitcoin below $80,000,” he added.
Bitcoin technical outlook: Upside pressure slows
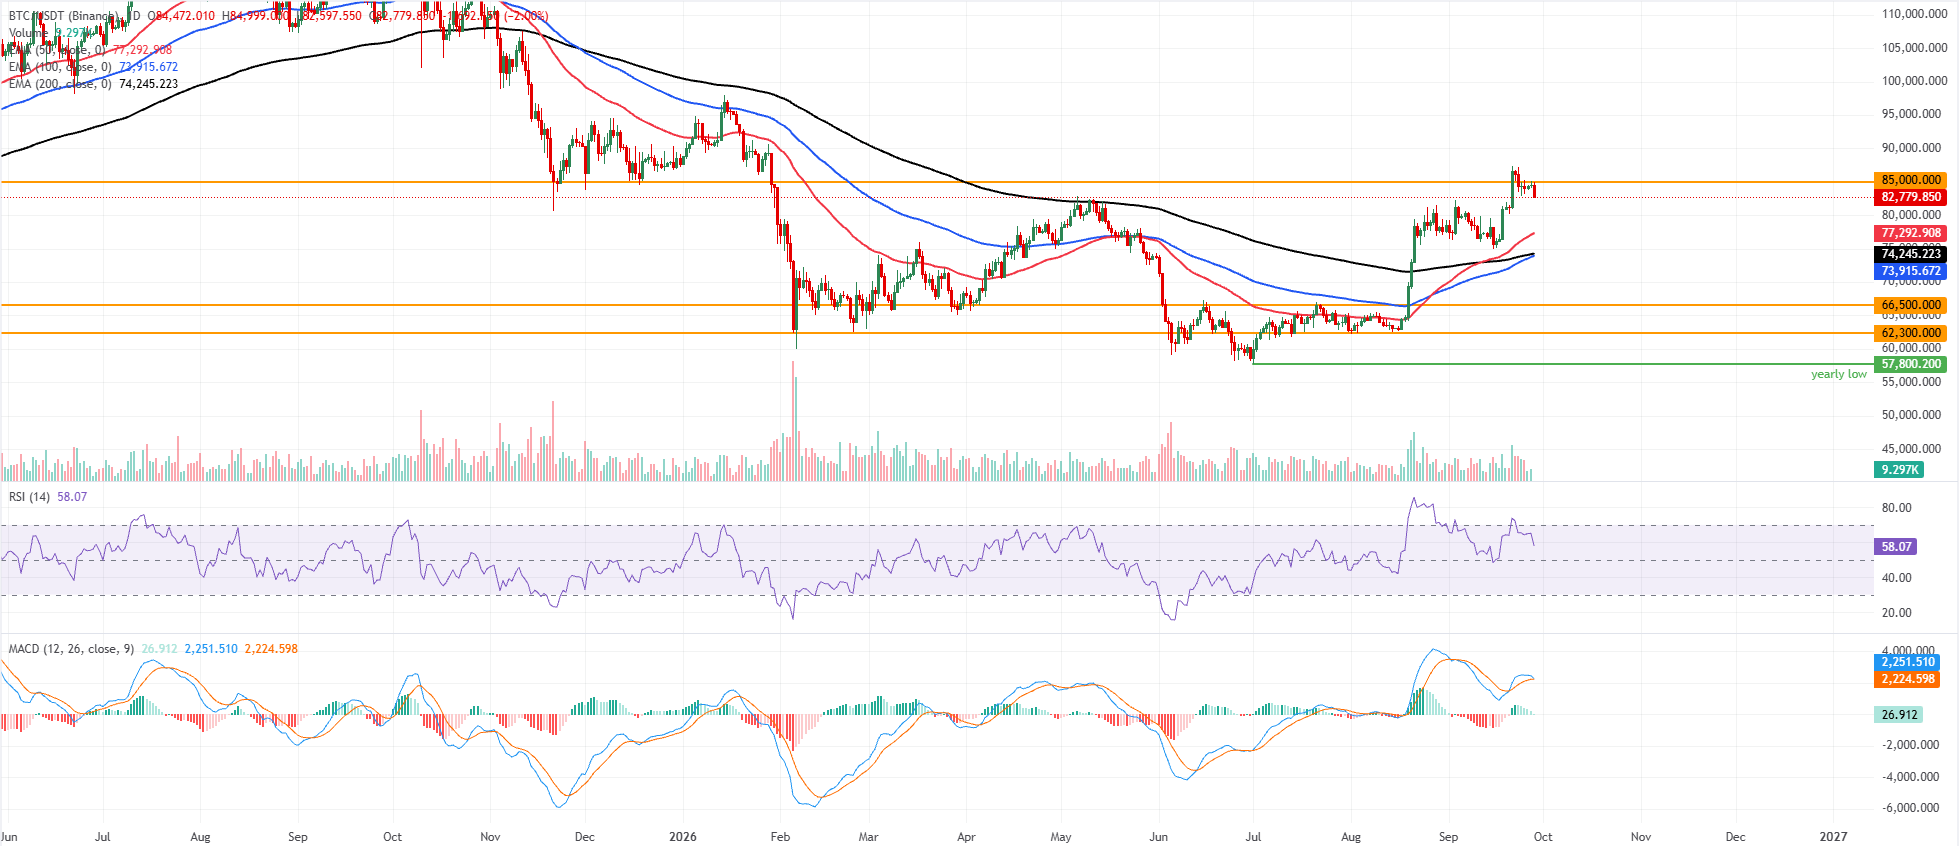
Bitcoin price trades around $82,779 on Monday, facing a slight pullback after rallying over 4% last week. Despite the correction, BTC maintains a bullish near-term bias as it holds well above the 50-day, 100-day, and 200-day Exponential Moving Averages (EMAs), clustered between roughly $73,900 and $77,300.
The Relative Strength Index (RSI) around 58 suggests constructive but non-overbought momentum. At the same time, the Moving Average Convergence Divergence (MACD) has cooled to marginally positive territory, hinting that upside pressure is slowing rather than reversing decisively.
On the topside, initial resistance sits at the horizontal barrier near $85,000, where a break would reopen the path to fresh highs.
On the downside, immediate support is the current area around the 50-day EMA at $77,292, with the 100-day and 200-day EMAs at $73,915 and $74,245, respectively, reinforcing a broader demand zone. Deeper pullbacks would likely find buyers around the previously established horizontal supports at $66,500 and $62,300, which mark the lower structural floor of the broader uptrend.
(The technical analysis of this story was written with the help of an AI tool. Know more.)
Bitcoin, altcoins, stablecoins FAQs
Bitcoin is the largest cryptocurrency by market capitalization, a virtual currency designed to serve as money. This form of payment cannot be controlled by any one person, group, or entity, which eliminates the need for third-party participation during financial transactions.
Altcoins are any cryptocurrency apart from Bitcoin, but some also regard Ethereum as a non-altcoin because it is from these two cryptocurrencies that forking happens. If this is true, then Litecoin is the first altcoin, forked from the Bitcoin protocol and, therefore, an “improved” version of it.
Stablecoins are cryptocurrencies designed to have a stable price, with their value backed by a reserve of the asset it represents. To achieve this, the value of any one stablecoin is pegged to a commodity or financial instrument, such as the US Dollar (USD), with its supply regulated by an algorithm or demand. The main goal of stablecoins is to provide an on/off-ramp for investors willing to trade and invest in cryptocurrencies. Stablecoins also allow investors to store value since cryptocurrencies, in general, are subject to volatility.
Bitcoin dominance is the ratio of Bitcoin's market capitalization to the total market capitalization of all cryptocurrencies combined. It provides a clear picture of Bitcoin’s interest among investors. A high BTC dominance typically happens before and during a bull run, in which investors resort to investing in relatively stable and high market capitalization cryptocurrency like Bitcoin. A drop in BTC dominance usually means that investors are moving their capital and/or profits to altcoins in a quest for higher returns, which usually triggers an explosion of altcoin rallies.
Bài viết đề xuất


