


Crypto Today: Bitcoin, Ethereum, XRP broadly consolidate amid renewed US-Iran strikes
- Bitcoin stabilizes above $78,000 as bulls defend near-term support, while the US and Iran exchange attacks for the first time in weeks.
- Ethereum retains a bullish structure as $2,400 support holds, backed by key moving averages.
- XRP rebounds above the 200-day EMA while upside remains capped by $1.40 resistance.
The cryptocurrency market is broadly consolidating on Monday, with select assets posting modest gains. Bitcoin (BTC) remains resilient above $78,000 as investors anticipate a renewed push toward $80,000.
Ethereum (ETH) continues to demonstrate a constructive technical setup, holding above $2,400. Ripple (XRP) is exhibiting early signs of recovery near $1.37, though persistent resistance at $1.40 may cap further upside in the near term.
US-Iran tensions reescalate, raising risk of deeper sell-off
The United States (US) and Iran exchanged military strikes for the first time in weeks over the weekend, renewing geopolitical tensions in the Middle East. US Central Command announced strikes targeting what it described as Iranian rocket launchers on Larak Island, in the Strait of Hormuz.
Iran’s Revolutionary Guard Corps (IRGC) reported strikes on US military bases in Jordan and the United Arab Emirates (UAE) on Sunday in retaliation for the American attacks.
The renewed fighting in the six-month war comes after US President Donald Trump announced a shift in strategy last week to "economic warfare," heaping pressure on Iran with new sanctions in an attempt to break the stalemate in the conflict.
Although market sentiment remains relatively stable, continued tensions could weigh on risk appetite and trigger a deeper sell-off. Bitcoin’s position below $80,000 could lead to buyer exhaustion amid profit-taking.
Technical Analysis: Bitcoin upholds key support
Bitcoin trades at $78,389, well above the key 200-day Exponential Moving Average (EMA) at $72,197, reinforcing a bullish near-term bias. The pair is also holding above the shorter-term 100-day and 50-day EMAs clustered in the upper-$68,000 to upper-$69,000 area, suggesting the broader trend remains supported despite the latest consolidation.
Momentum stays constructive as the Moving Average Convergence Divergence (MACD) indicator remains in positive territory on the daily chart, while the Relative Strength Index (RSI) hovers just above the 70 threshold, hinting at overbought conditions that could slow additional upside rather than immediately reverse it.
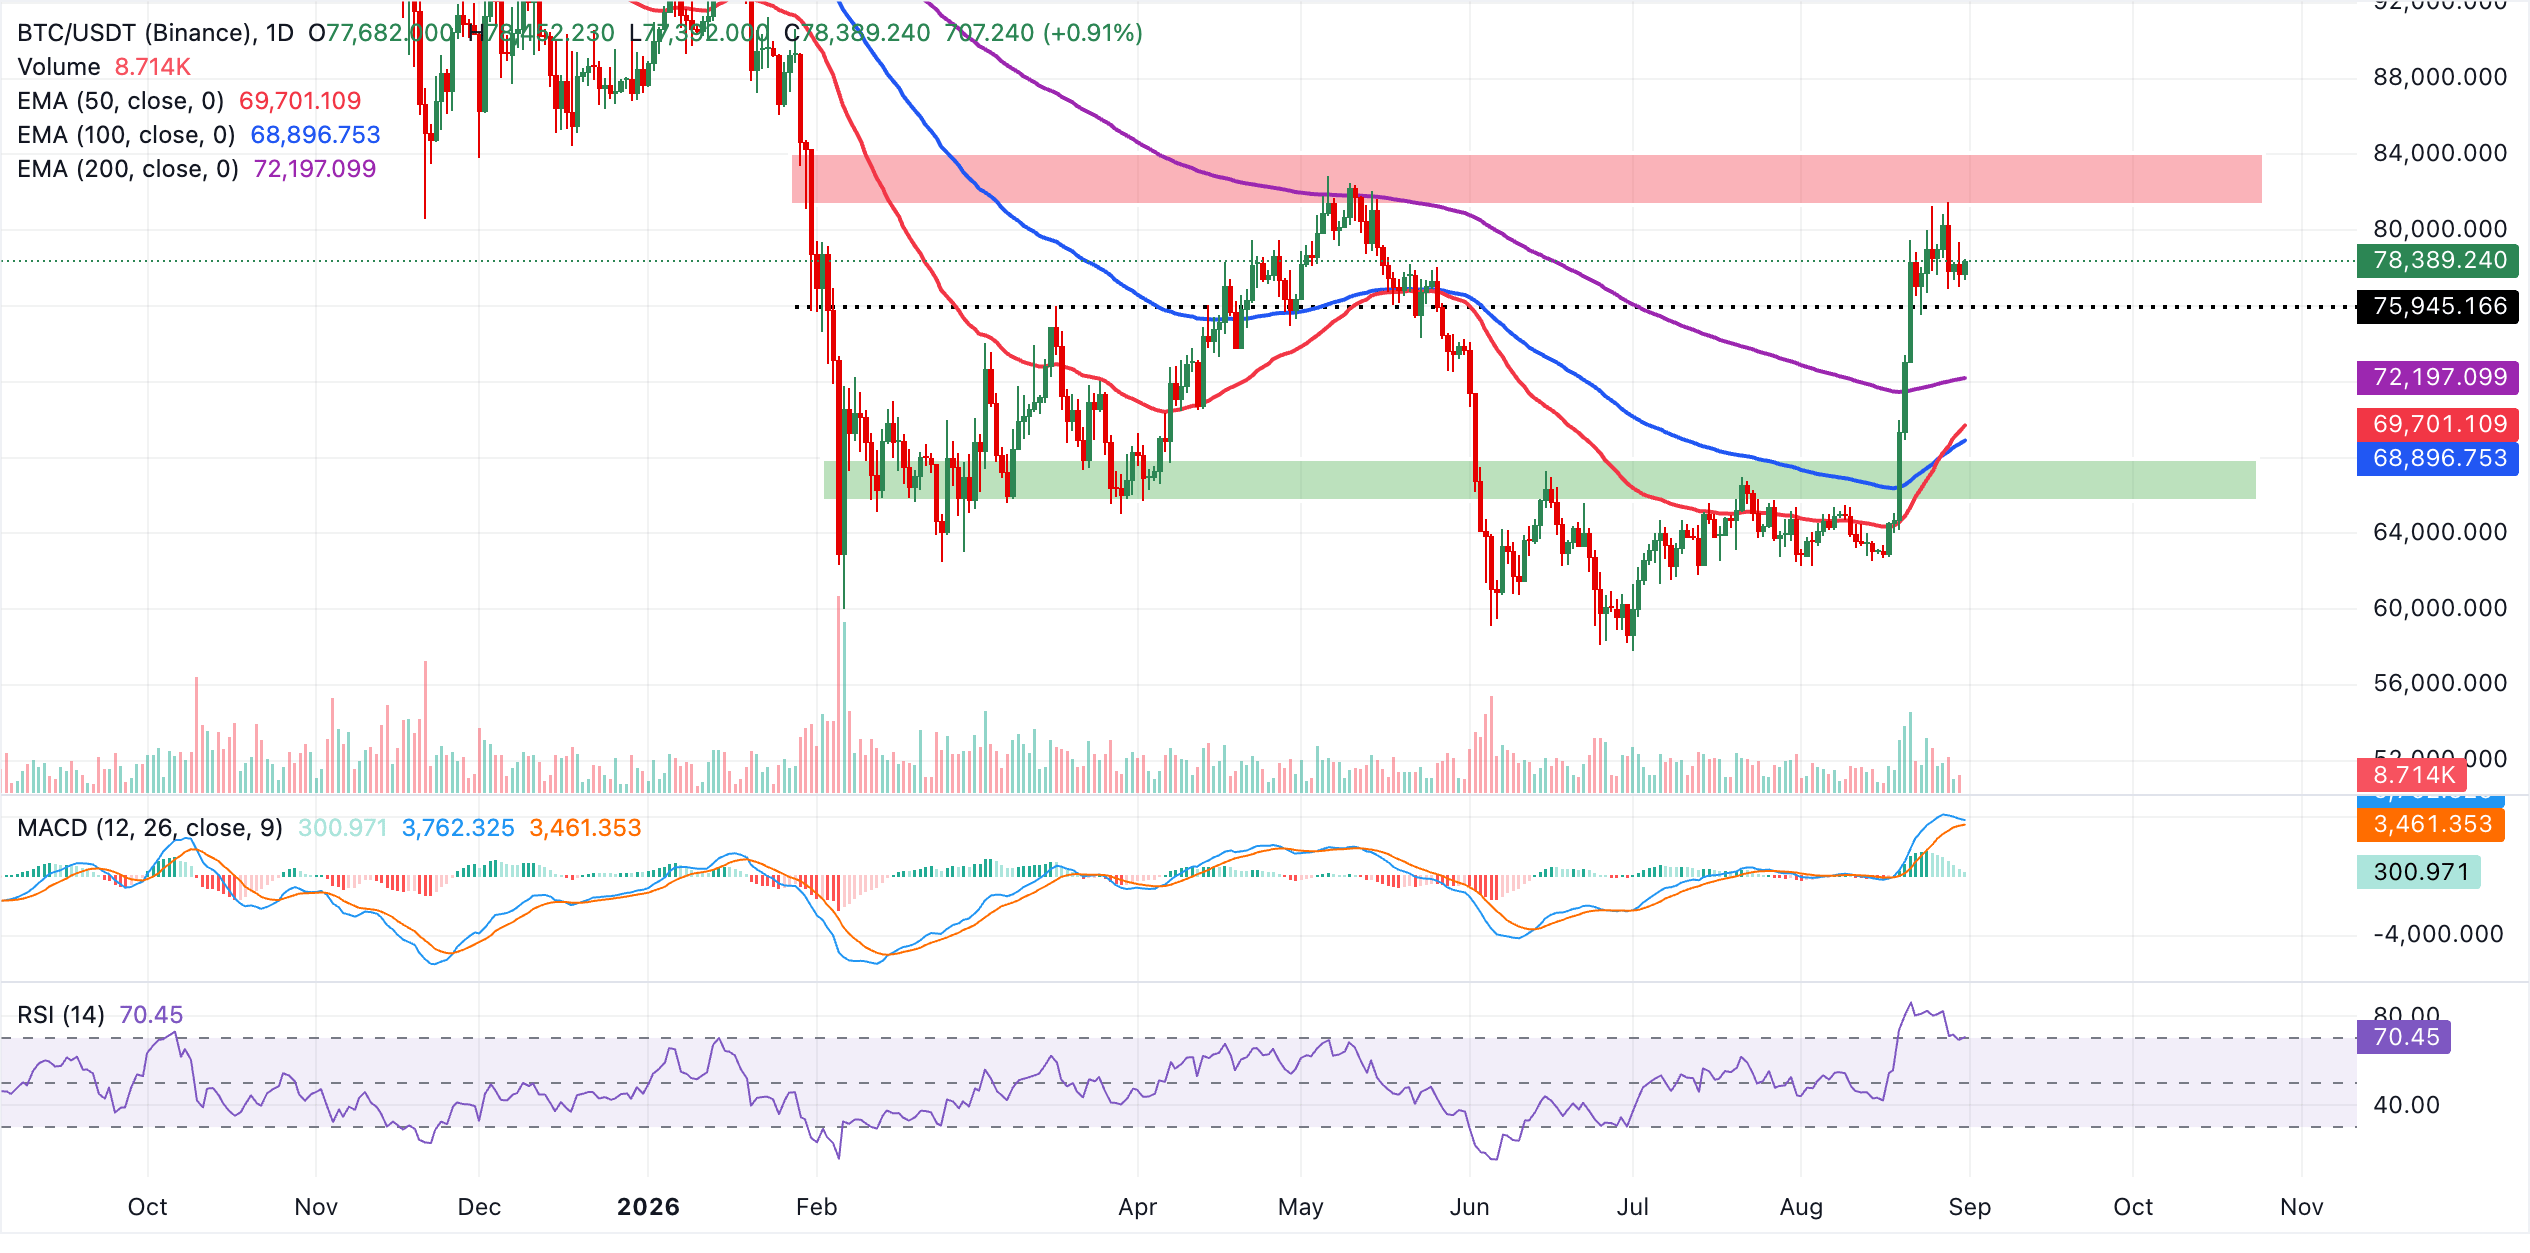
On the topside, initial resistance lies at the 100-day EMA around $68,897, followed by the 50-day EMA near $69,701, which together define a prior congestion zone that may attract dip buyers if revisited. On the downside, the primary structural support aligns with the 200-day EMA at $72,197, and a sustained hold above this level would keep the broader bullish structure intact. A daily close back below it would hint at a deeper corrective phase toward lower levels.
Altcoins technical outlook: Ethereum and XRP retain bullish bias despite capped upside
Ethereum trades at $2,446, maintaining a constructive bullish bias as price holds well above the 50-day, 100-day, and 200-day EMAs, which trail between roughly $2,040 and $2,160 and reinforce the underlying uptrend.
The MACD indicator remains positive, with the latest reading hinting at fading but still supportive upside momentum, while the RSI near 68 reflects strong buying pressure edging toward overbought territory, suggesting that while the advance persists, upside may become more gradual.
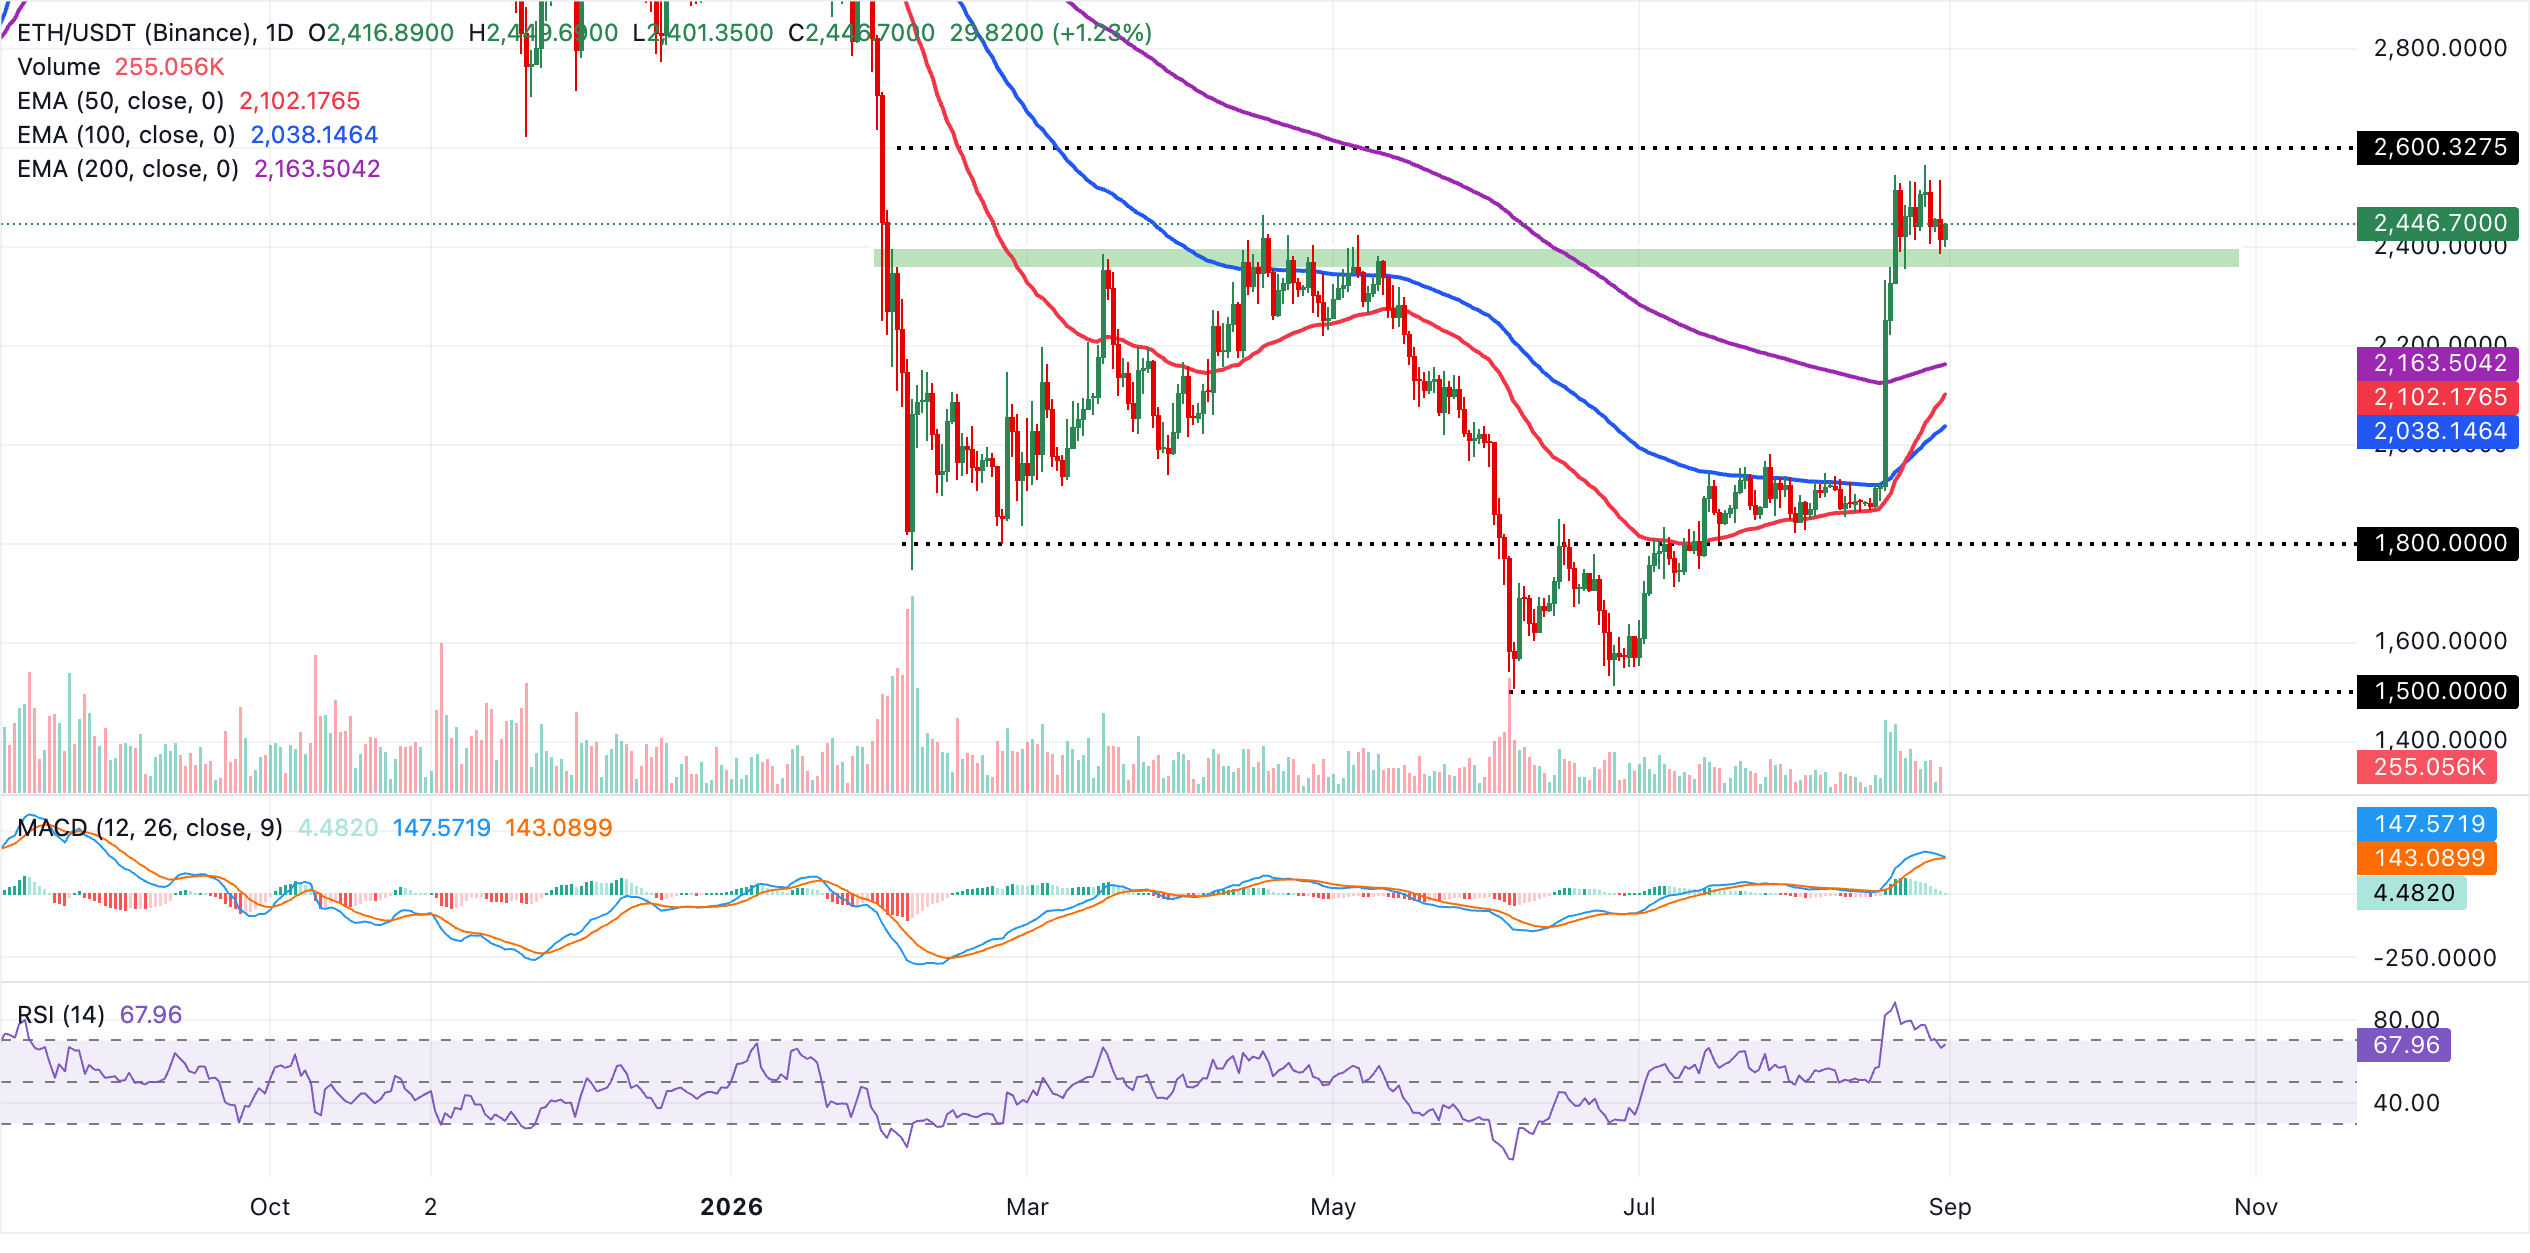
On the downside, immediate support lies at the current pivot area around $2,446, with deeper demand expected at the clustered EMA zone where the 50-day EMA at $2,102, the 100-day EMA at $2,038 and the 200-day EMA at $2,164 collectively mark a broad technical floor for corrective pullbacks. With no clearly defined resistance levels on the daily chart, the focus remains on whether bulls can sustain price above this moving-average base. A daily close back below the $2,160–2,040 band would weaken the present bullish structure and hint at a broader consolidation phase.
As for XRP, the price trades at $1.37, keeping a bullish near-term tone as it holds above the major EMAs. The 200-day EMA at $1.35 underpins the advance, with the 100-day EMA at $1.21 and the 50-day EMA at $1.21 reinforcing the broader upward structure.
Momentum aligns with this constructive backdrop, as the RSI at 62 stays comfortably above the midline while avoiding overbought extremes, and the MACD remains marginally positive, suggesting buying pressure is still present, though less aggressive than during the recent spike.
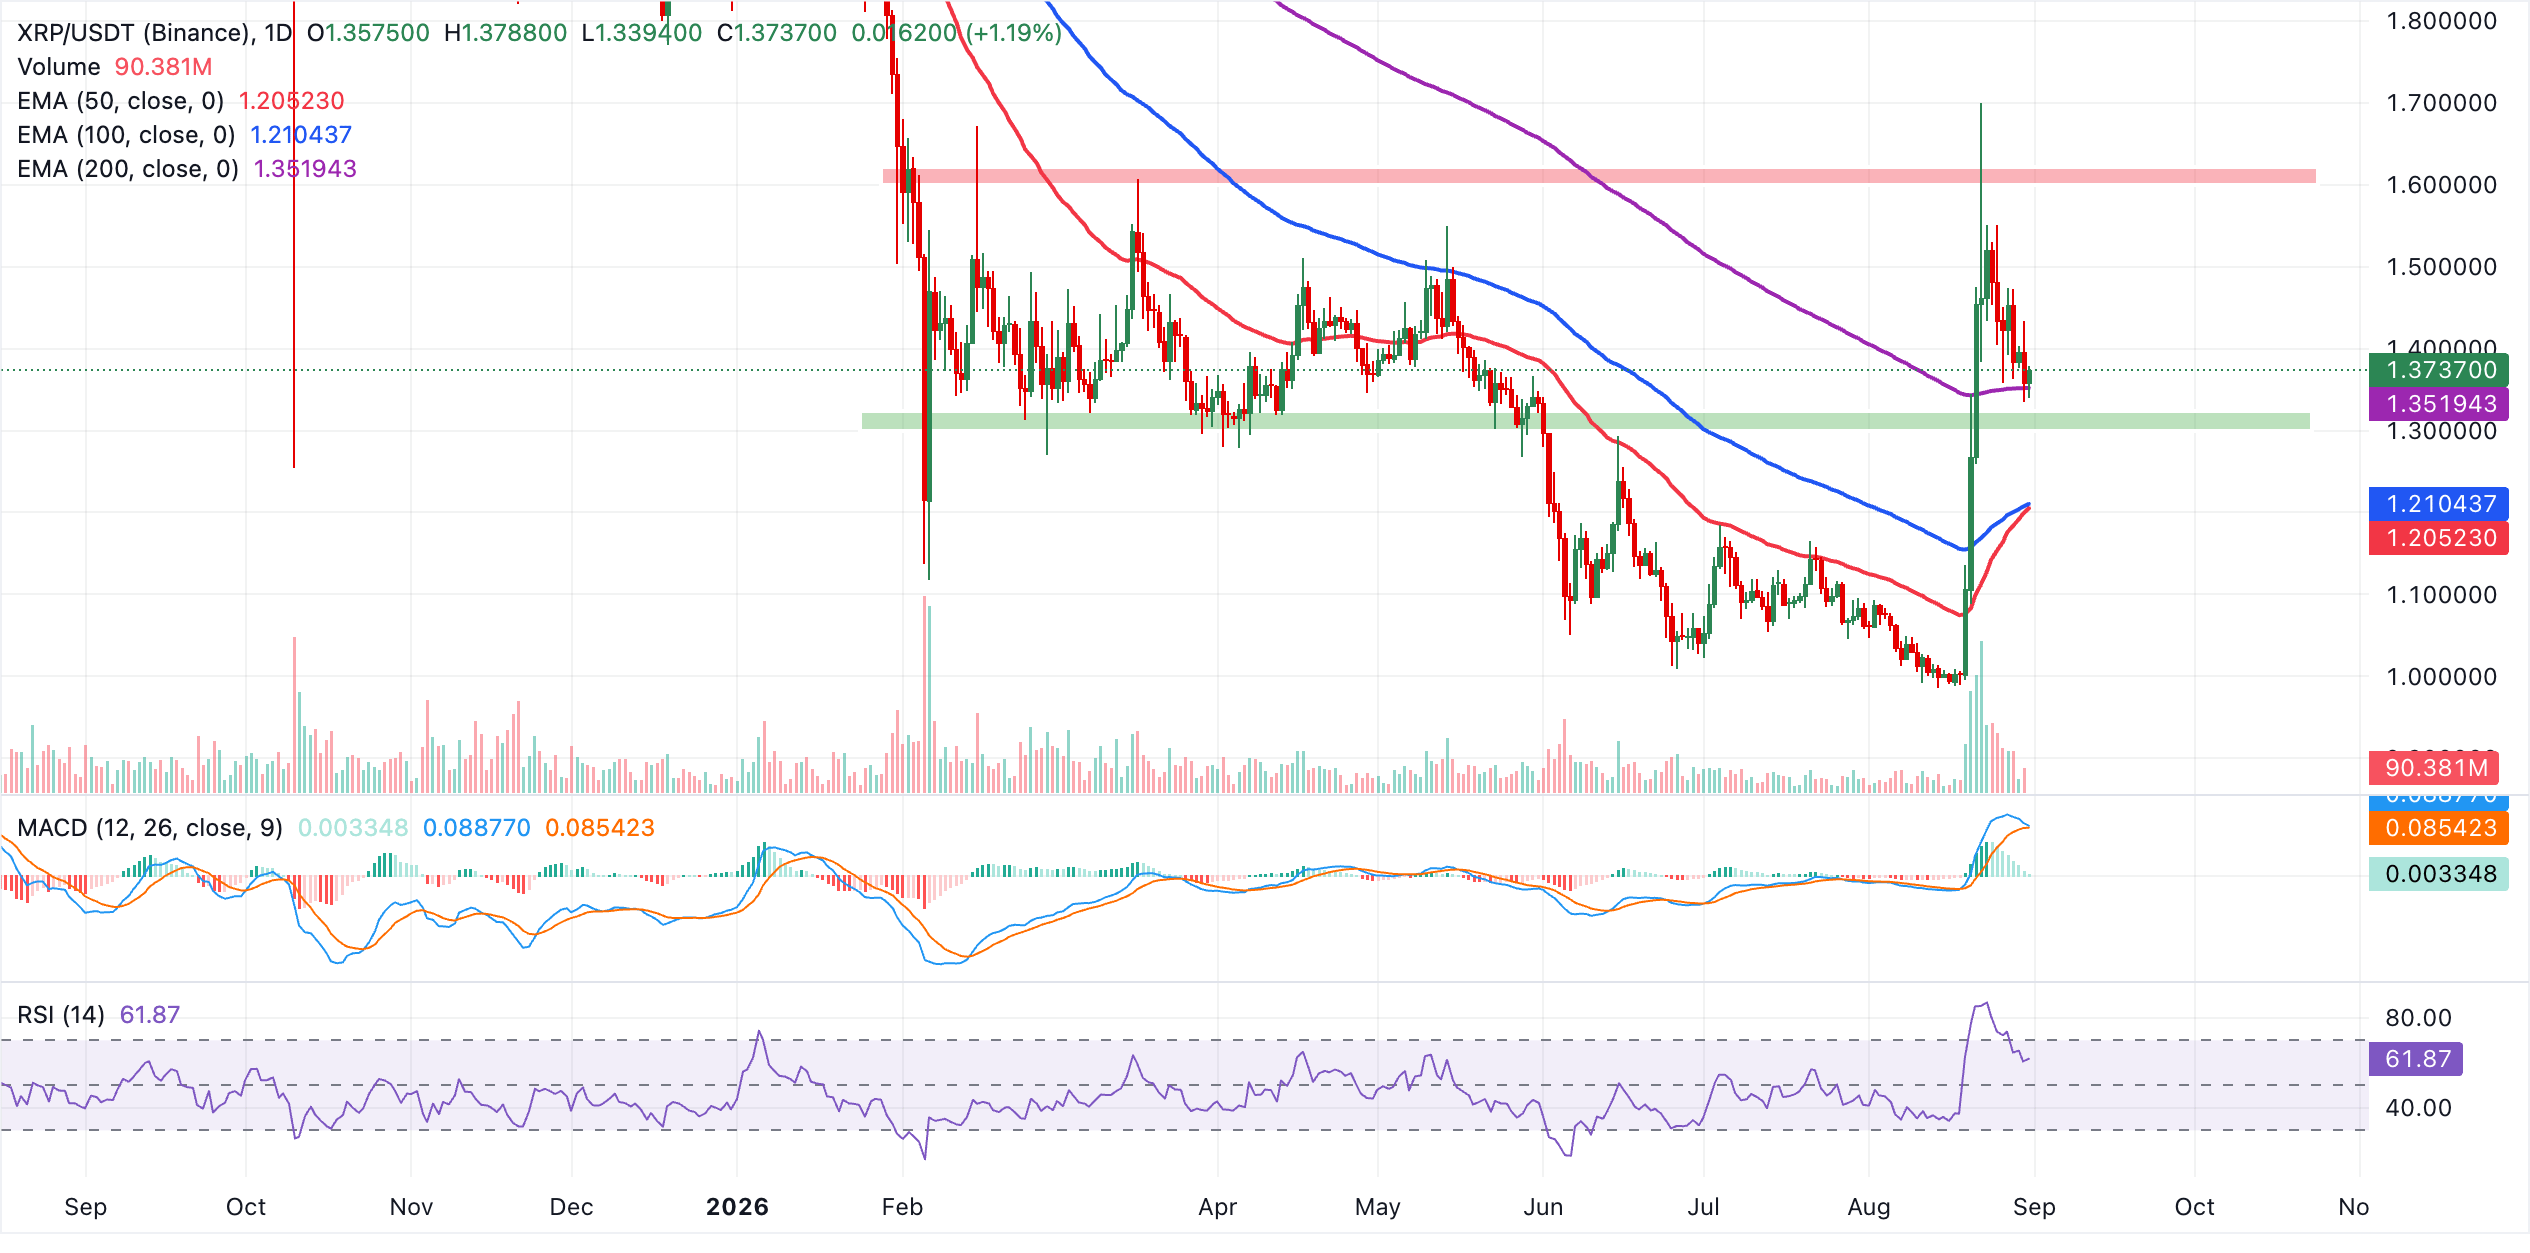
Immediate support emerges around the current area, with the 200-day EMA at $1.35 serving as the first meaningful technical floor if the pair corrects lower. A deeper pullback would likely target the 100-day EMA at $1.21, then the 50-day EMA at $1.21 as more distant, medium-term demand zones. The pair’s topside remains open from a structural perspective, suggesting that as long as XRP holds above the 200-day EMA, the bias would stay tilted to the upside, even if short-term volatility leads to interim pauses or minor retracements.
(The technical analysis of this story was written with the help of an AI tool. Know more.)
Bitcoin, altcoins, stablecoins FAQs
Bitcoin is the largest cryptocurrency by market capitalization, a virtual currency designed to serve as money. This form of payment cannot be controlled by any one person, group, or entity, which eliminates the need for third-party participation during financial transactions.
Altcoins are any cryptocurrency apart from Bitcoin, but some also regard Ethereum as a non-altcoin because it is from these two cryptocurrencies that forking happens. If this is true, then Litecoin is the first altcoin, forked from the Bitcoin protocol and, therefore, an “improved” version of it.
Stablecoins are cryptocurrencies designed to have a stable price, with their value backed by a reserve of the asset it represents. To achieve this, the value of any one stablecoin is pegged to a commodity or financial instrument, such as the US Dollar (USD), with its supply regulated by an algorithm or demand. The main goal of stablecoins is to provide an on/off-ramp for investors willing to trade and invest in cryptocurrencies. Stablecoins also allow investors to store value since cryptocurrencies, in general, are subject to volatility.
Bitcoin dominance is the ratio of Bitcoin's market capitalization to the total market capitalization of all cryptocurrencies combined. It provides a clear picture of Bitcoin’s interest among investors. A high BTC dominance typically happens before and during a bull run, in which investors resort to investing in relatively stable and high market capitalization cryptocurrency like Bitcoin. A drop in BTC dominance usually means that investors are moving their capital and/or profits to altcoins in a quest for higher returns, which usually triggers an explosion of altcoin rallies.
Bài viết đề xuất


