


Top 3 Crypto Price Prediction: Bitcoin, Ethereum, Ripple – BTC pauses near $80,000, ETH at $2,500, XRP below $1.50
- Bitcoin hovers around $78,000 on Wednesday, capped below $80,000 as bulls take a breather.
- Ethereum holds above $2,400, as buyers struggle to extend the rally above the $2,500 mark.
- Ripple steadies near $1.44, approaching its 200-day EMA at $1.3822 after two consecutive days of losses around 5%.
Bitcoin (BTC), Ethereum (ETH), and Ripple (XRP) are facing downside pressure near key psychological thresholds as last week's double-digit rally loses momentum. The pullback reflects near-term corrective measures as traders book profits.
Bitcoin is stuck below $80,000 amid overbought conditions
Bitcoin trades near $78,760 at press time on Wednesday, maintaining its bullish bias after last week's 23% rally. BTC price hovers above the 78.6% Fibonacci retracement level at $77,489 measured over the downswing from $82,850 to $57,800.
Bitcoin is facing headwinds near the $80,000 psychological threshold, guarding the upside to the $82,850 swing high. A confirmed breakout of these resistance zones could open the path toward the 127.2% Fibonacci extension level at $89,663, close to the $90,000 threshold.
Momentum cools down on the daily chart as the Relative Strength Index (14) near 80 suggests overbought conditions and a stretched advance. Meanwhile, the Moving Average Convergence Divergence (MACD) and signal line maintain an upward slope amid a waning histogram, suggesting that upside momentum is cooling.
On the downside, immediate support is seen at the 78.6% retracement at $77,489, and the cluster of medium-term supports is the 200-day Exponential Moving Average (EMA) at $72,797 and the 50% retracement at $70,325.
Ethereum consolidates below $2,500 as buyers hit pause
Ethereum hovers above $2,400 at press time on Wednesday, sustaining a bullish bias as price holds above both the 50-day EMA at $2,022 and the 200-day EMA at $2,146. The major altcoin tests the 50% retracement level at $2,476, measured from $3,447 to $1,505.
From a technical perspective, the $2,500 psychological threshold reinforces the $2,476 resistance level. A confirmed breakout above $2,500 could extend the ETH rally toward the 78.6% Fibonacci retracement level at $3,031.
Momentum remains strong, with the RSI at 75, hovering in overbought territory while the MACD stays positive, hinting that buyers still control the near-term trend.
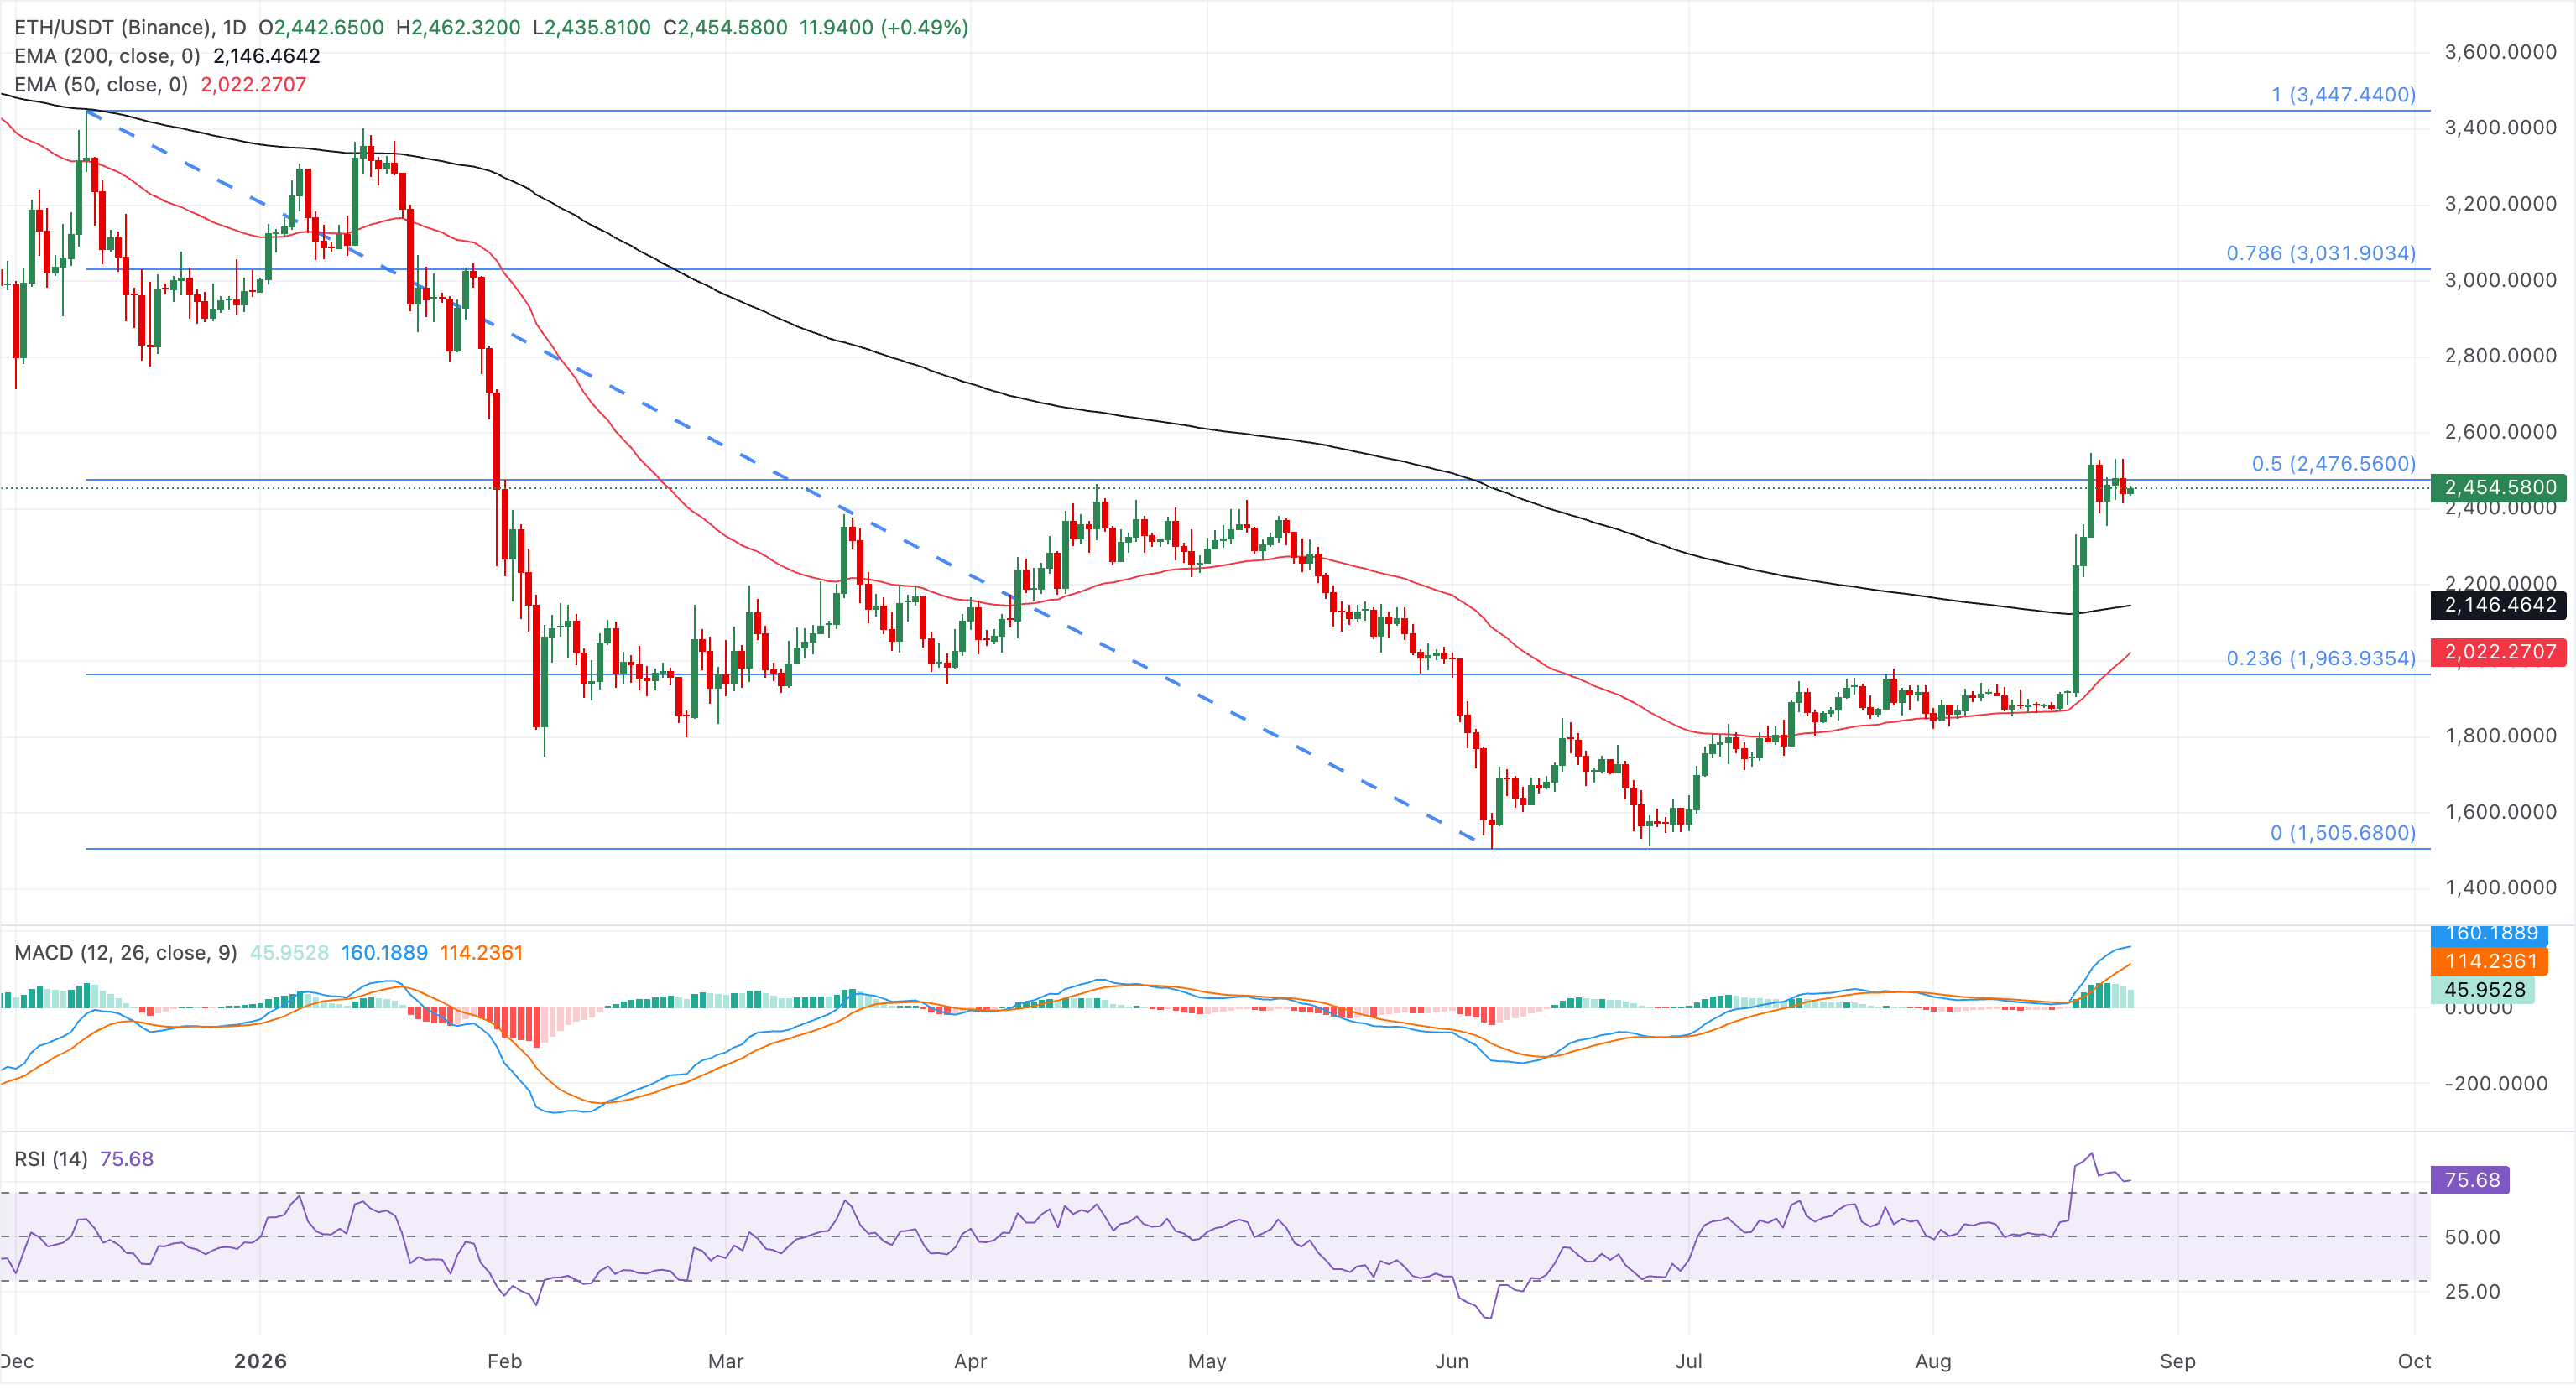
On the downside, initial support is seen at the 200-day EMA at $2,146, ahead of the 50-day EMA at $2,022. A deeper pullback would expose the 23.6% retracement at $1,963.94, while the $1,505.68 swing low remains a distant structural floor.
Ripple faces downside pressure
Ripple trades around $1.4397 at press time on Wednesday, holding firmly above both the 50‑day EMA at $1.1646 and the 200‑day EMA at $1.3822, keeping the near‑term bias bullish. XRP is down 5% so far this week, implying a near-term profit-booking phase near the $1.50 psychological mark.
The immediate support for XRP aligns with the 200-day EMA at $1.3822, guarding the downside to the $1.2700 support zone.
The RSI at 74 remains in overbought territory, hinting at strong but stretched upside momentum, while the MACD and signal line remain positive, suggesting that buying pressure is still dominant.
XRP must confirm the $1.50 breakout with a decisive daily close to reinstate the rally, which could target the November 21 low at $1.8209.
(The technical analysis of this story was written with the help of an AI tool. Know more.)
Bài viết đề xuất


