

Solana Price Forecast: SOL holds above $75 as ETF inflows lift bulls

Nguồn Fxstreet
  • Solana price trades above $75 on Monday after correcting 2.18% last week and finding support at the ascending trendline.
  • US-listed spot ETFs recorded $10.26 million in inflows last week, marking seven straight weeks of positive inflows.
  • The technical outlook remains constructive, with a sustained break above the $78 resistance suggesting further gains.

Solana (SOL) price trades above $75 at the time of writing on Monday after declining 2.18% last week and finding support at an ascending trendline. Continued inflows into spot SOL Exchange Traded Funds (ETFs) suggest sustained investor demand. Meanwhile, the technical outlook remains constructive, with a decisive break above the key $78 mark indicating further gains.

Institutional demand strengthens

Institutional demand for Solana has remained robust. SoSoValue data showed that SOL ETFs recorded an inflow of $10.26 million last week, the highest weekly inflow since May 22 and marking the seventh straight week of positive inflows. If these inflows continue and intensify throughout the week, SOL could extend gains.
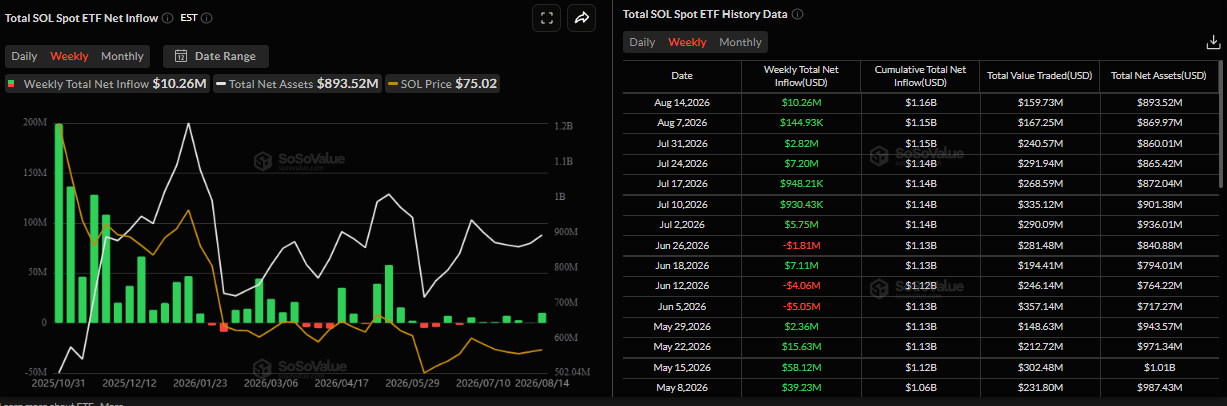
Solana spot ETF net inflow weekly chart. Source: SoSoValue

CryptoQuant’s summary data also shows a mild bullish tilt. SOL’s spot markets show large whale orders and futures markets show cooling conditions, while other metrics remain neutral, supporting a potential recovery.
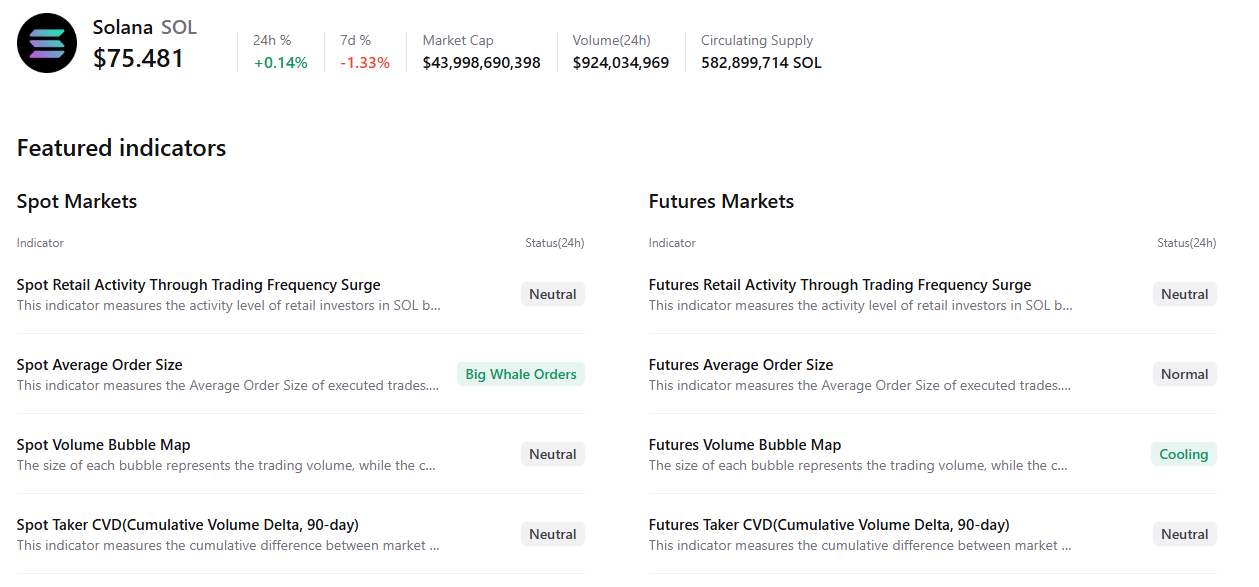
Solana summary data chart. Source: CryptoQuant

Solana Price Forecast: Finds support at the ascending trendline

Solana price trades at $75.53 on Monday, holding marginally above the 50-day Exponential Moving Average (EMA) at $75.48, but remains capped beneath the 100-day EMA at $78.10 and the much higher 200-day EMA at $88.69, keeping the broader tone constrained despite a short-term bounce. 

Momentum is mildly constructive, with the Relative Strength Index (RSI) near a neutral 52 and the Moving Average Convergence Divergence (MACD) holding in positive territory, which hints at stabilizing demand. At the same time, the larger trend structure still argues against a clean bullish breakout.

On the topside, initial resistance is seen at the recent horizontal barrier near $77.07, followed by the 100-day EMA at $78.10; a sustained move above these levels would be needed to ease the current cap and open the way toward the 200-day EMA at $88.69 and the higher resistance zone around $96.19. 

On the downside, immediate support is the 50-day EMA at $75.49, with the rising trendline break area near $73.64 as the next line of defense; a daily close below this level would expose a deeper corrective phase within the prevailing range-bound structure.
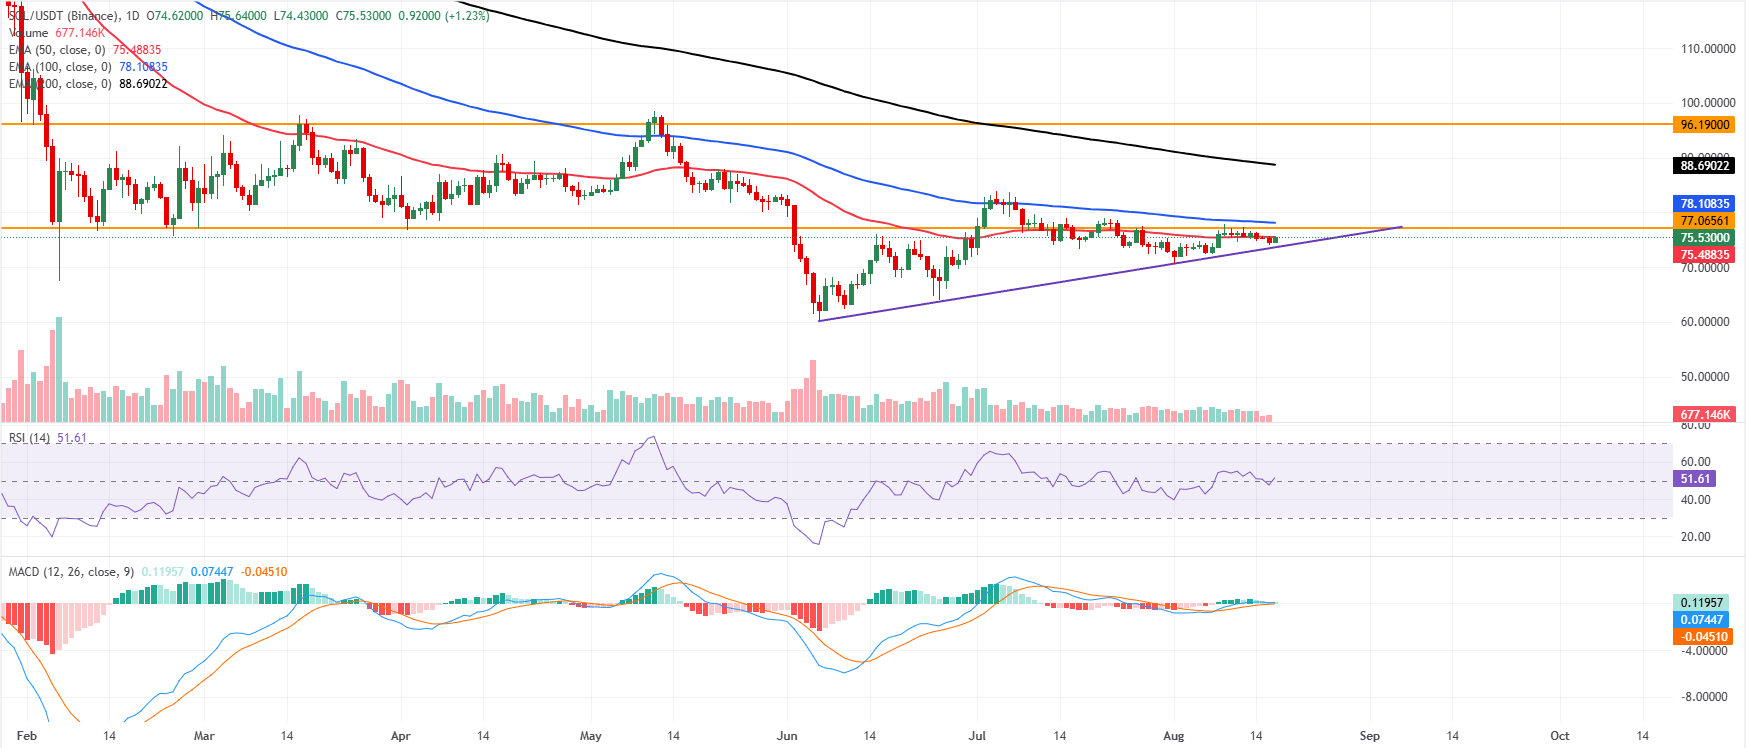
SOL/USDT daily chart

(The technical analysis of this story was written with the help of an AI tool. Know more.)

Tuyên bố miễn trừ trách nhiệm: Chỉ dành cho mục đích thông tin. Hiệu suất trong quá khứ không đảm bảo cho kết quả trong tương lai.
placeholder
Đợt tăng giá Ông già Noel tháng 12: Cổ phiếu Mỹ và châu Âu có đạt đỉnh mới?Dữ liệu lịch sử cho thấy cổ phiếu Mỹ và châu Âu thường ghi nhận xu hướng tăng trong tháng 12. Nếu đà tăng đủ mạnh, các nhà quản lý quỹ có thể ồ ạt mua vào.
Tác giả  Mitrade
ngày17 tháng 12 năm 2025
Dữ liệu lịch sử cho thấy cổ phiếu Mỹ và châu Âu thường ghi nhận xu hướng tăng trong tháng 12. Nếu đà tăng đủ mạnh, các nhà quản lý quỹ có thể ồ ạt mua vào.
placeholder
WTI giữ mức giảm quanh 82,50$ trong bối cảnh hy vọng ngoại giao Mỹ-Iran được khơi lạiGiá dầu West Texas Intermediate (WTI) vẫn ở trong vùng tiêu cực sang ngày thứ hai liên tiếp, giao dịch quanh mức 82,60$/thùng trong giờ châu Á vào thứ Sáu. Giá dầu thô đã mất đà sau khi hy vọng về một giải pháp ngoại giao cho cuộc xung đột Mỹ-Iran được khơi lại.
Tác giả  FXStreet
7 tháng 31 ngày Thứ Sáu
Giá dầu West Texas Intermediate (WTI) vẫn ở trong vùng tiêu cực sang ngày thứ hai liên tiếp, giao dịch quanh mức 82,60$/thùng trong giờ châu Á vào thứ Sáu. Giá dầu thô đã mất đà sau khi hy vọng về một giải pháp ngoại giao cho cuộc xung đột Mỹ-Iran được khơi lại.
placeholder
Forex Today: Đồng yên Nhật lùi bước sau khi tăng mạnh nhờ nghi ngờ can thiệp, BoJ giữ nguyên chính sáchĐây là những gì bạn cần biết vào thứ Sáu, ngày 31 tháng 7:
Tác giả  FXStreet
7 tháng 31 ngày Thứ Sáu
Đây là những gì bạn cần biết vào thứ Sáu, ngày 31 tháng 7:
placeholder
Vàng giao dịch với xu hướng tích cực dưới 4.400$; kỳ vọng Fed tăng lãi suất kìm hãm đà tăng trước thềm CPI của MỹVàng (XAU/USD) thu hút một số người mua khi giá giảm trong phiên giao dịch châu Á vào thứ Tư, làm chững lại đợt trượt giá điều chỉnh của ngày hôm trước từ vùng 4.435$, hay mức cao nhất kể từ ngày 5 tháng 6.
Tác giả  FXStreet
8 tháng 12 ngày Thứ Tư
Vàng (XAU/USD) thu hút một số người mua khi giá giảm trong phiên giao dịch châu Á vào thứ Tư, làm chững lại đợt trượt giá điều chỉnh của ngày hôm trước từ vùng 4.435$, hay mức cao nhất kể từ ngày 5 tháng 6.
placeholder
Vàng tăng đà lên gần 4.400$ khi kỳ vọng Fed tăng lãi suất giảm bất chấp căng thẳng Mỹ-IranGiá vàng (XAU/USD) tăng đà lên quanh mức 4.395$ trong đầu phiên giao dịch châu Á vào thứ Hai. Kim loại quý kéo dài đà tăng khi dữ liệu lạm phát Mỹ hạ nhiệt đã làm giảm kỳ vọng về việc Cục Dự trữ Liên bang Mỹ (Fed) tăng lãi suất.
Tác giả  FXStreet
4 giờ trước
Giá vàng (XAU/USD) tăng đà lên quanh mức 4.395$ trong đầu phiên giao dịch châu Á vào thứ Hai. Kim loại quý kéo dài đà tăng khi dữ liệu lạm phát Mỹ hạ nhiệt đã làm giảm kỳ vọng về việc Cục Dự trữ Liên bang Mỹ (Fed) tăng lãi suất.
sản phẩm liên quan
goTop
quote