


Crypto Today: Bitcoin, Ethereum, XRP remain under pressure as risk-off sentiment persists
- Bitcoin edges lower toward the $63,000 short-term support, pressured by continued ETF outflows.
- Ethereum extends its decline below $1,900 as focus shifts to Wednesday’s Fed interest rate decision.
- XRP risks extending its sell-off below the critical $1.00 support despite mild ETF inflows.
Bitcoin (BTC) is falling toward the immediate $63,000 support at the time of writing on Tuesday, weighed down by continued risk-off sentiment. Altcoins, including Ethereum (ETH) and Ripple (XRP), remain under pressure, trading below $1,900 and $1.10, respectively.
Crypto sentiment stays fragile ahead of Fed rate decision
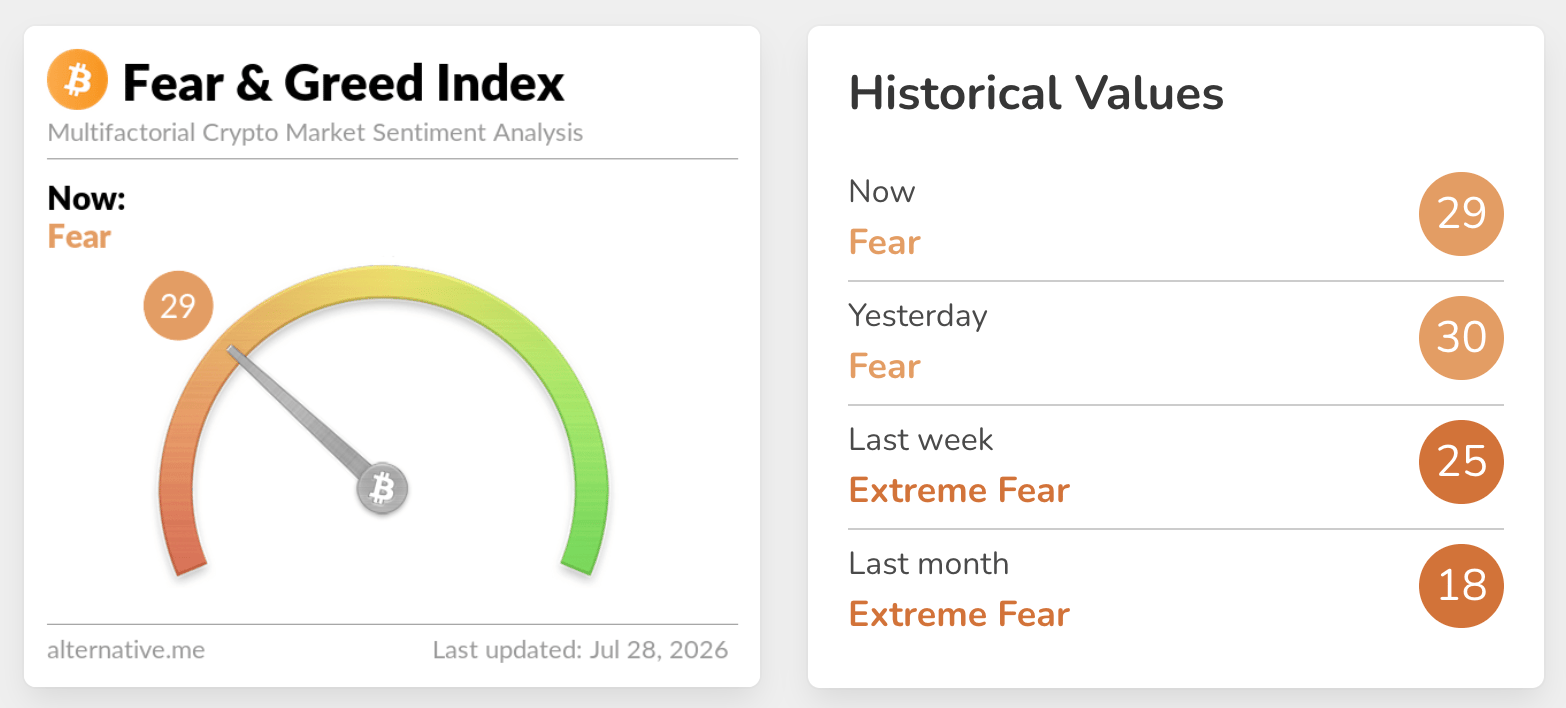
Crypto market sentiment remains largely unresponsive and in the Fear territory, as reflected in the Fear & Greed Index. The index, which broadly tracks investor behavior, holds at 29 on Monday, down only marginally from 30 the day before. This prevailing market condition indicates that risk-off sentiment remains weak, aligning with the ongoing correction.
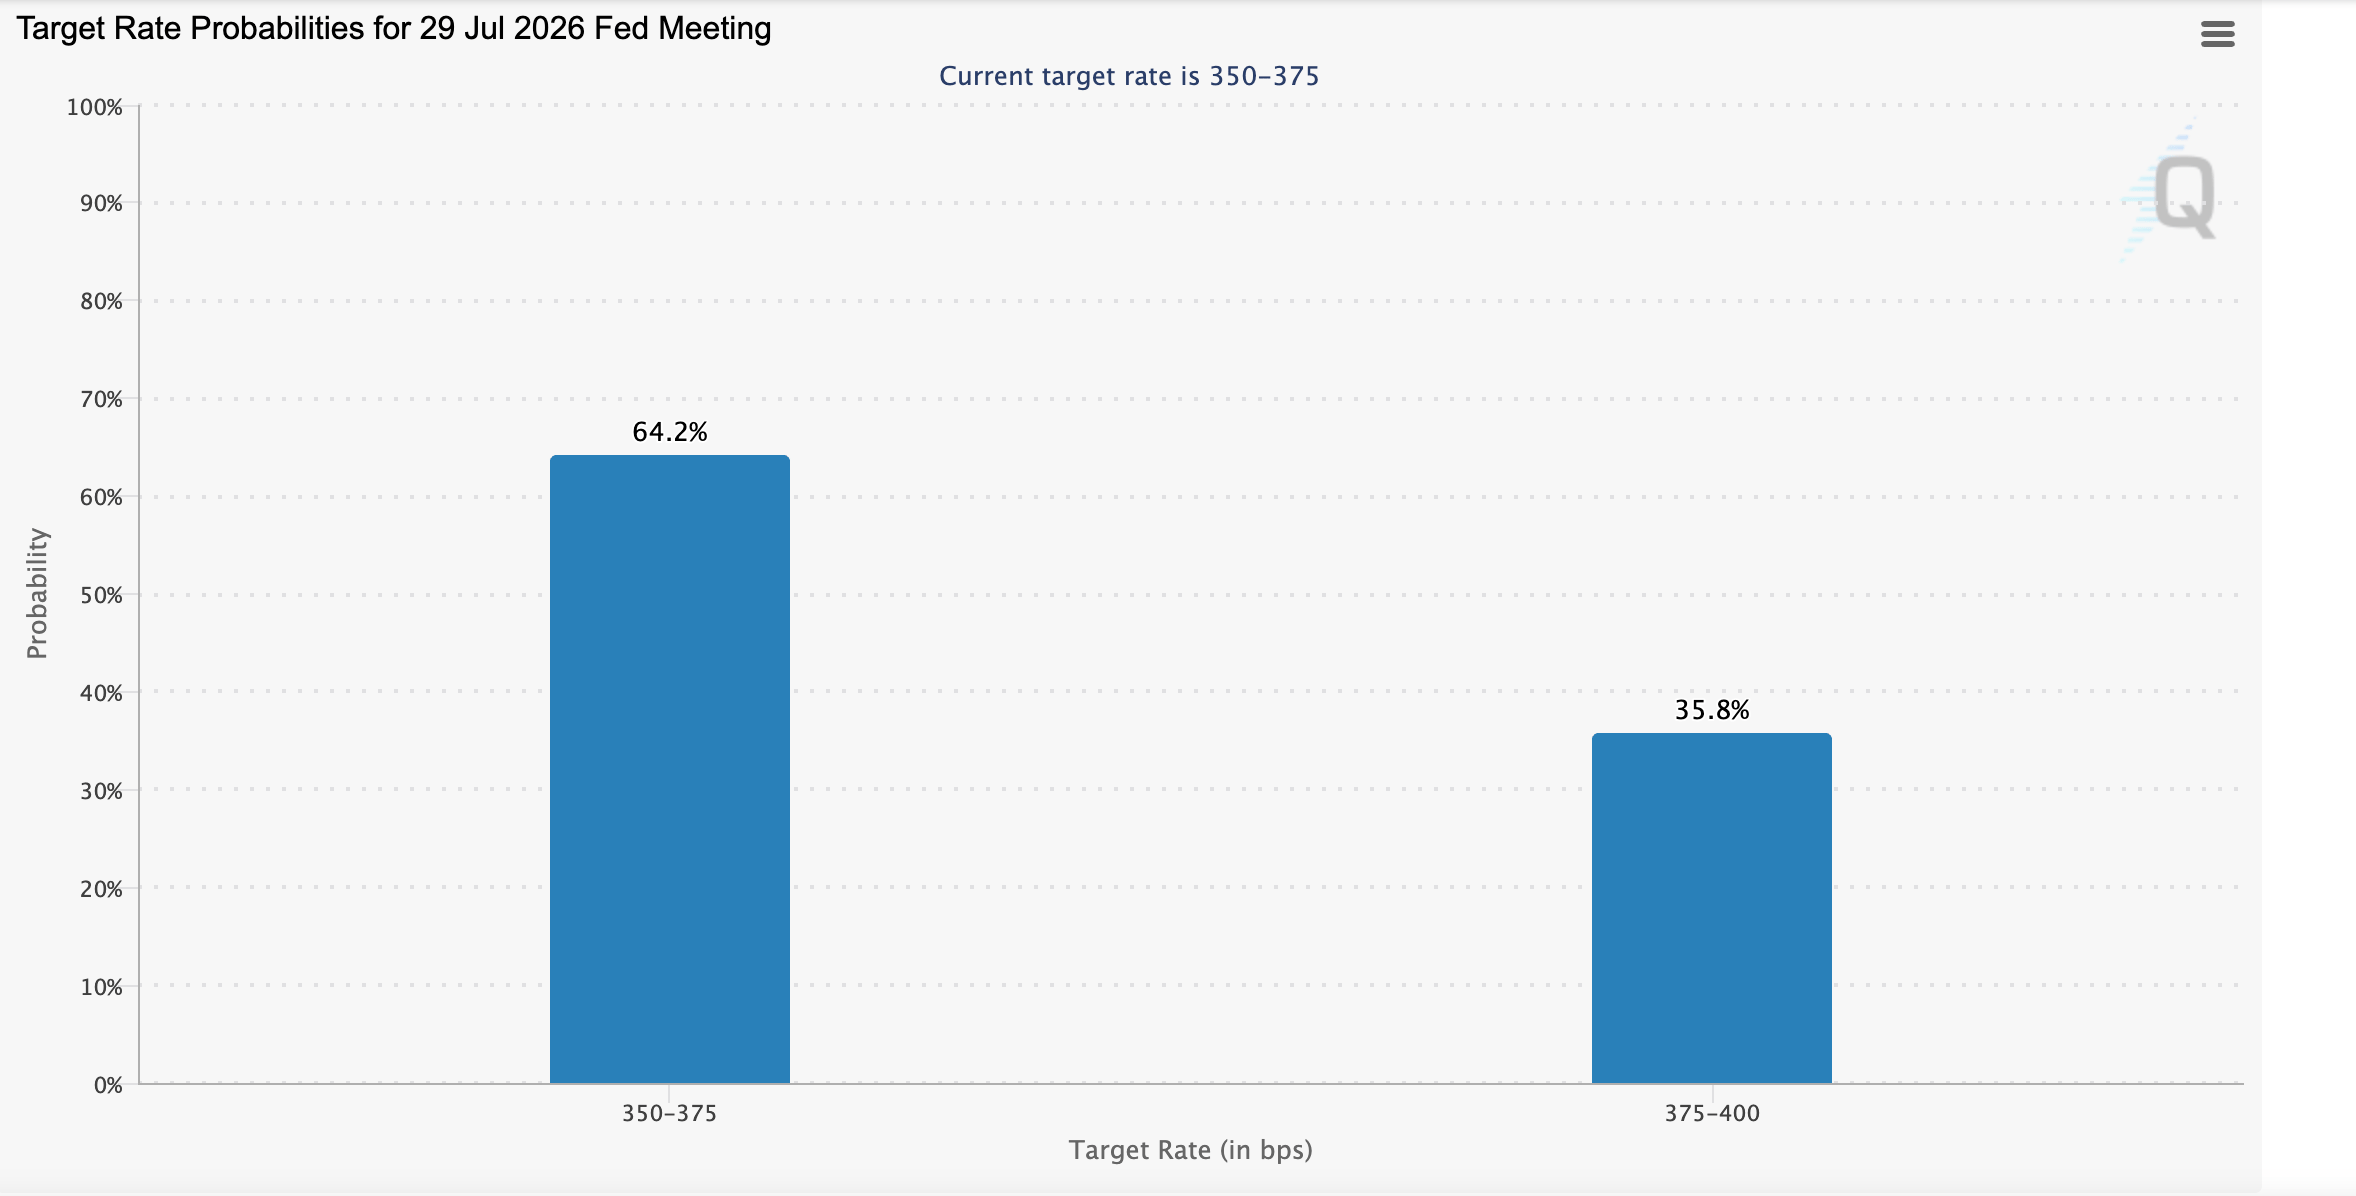
Meanwhile, investors are pricing in a 64% probability that the Federal Reserve (Fed) will hold interest rates steady in the 3.50%- 3.75% range on Wednesday.
At the same time, the market is pricing in a 36% chance of a hike to the 3.75%-4.00% range. Although recent data, including the Consumer Price Index (CPI), signaled that inflation eased in the United States (US) in June, fears of a regional escalation of the war in the Middle East could push the Fed toward a stricter monetary policy.
Loretta Mester, former Cleveland Fed President, said in an interview that the central bank officials “are going to have to ask themselves whether policy is at the right level to get inflation moving back down to 2%. Chair Warsh has been pretty vocal on saying that they’re not going to tolerate inflation.”
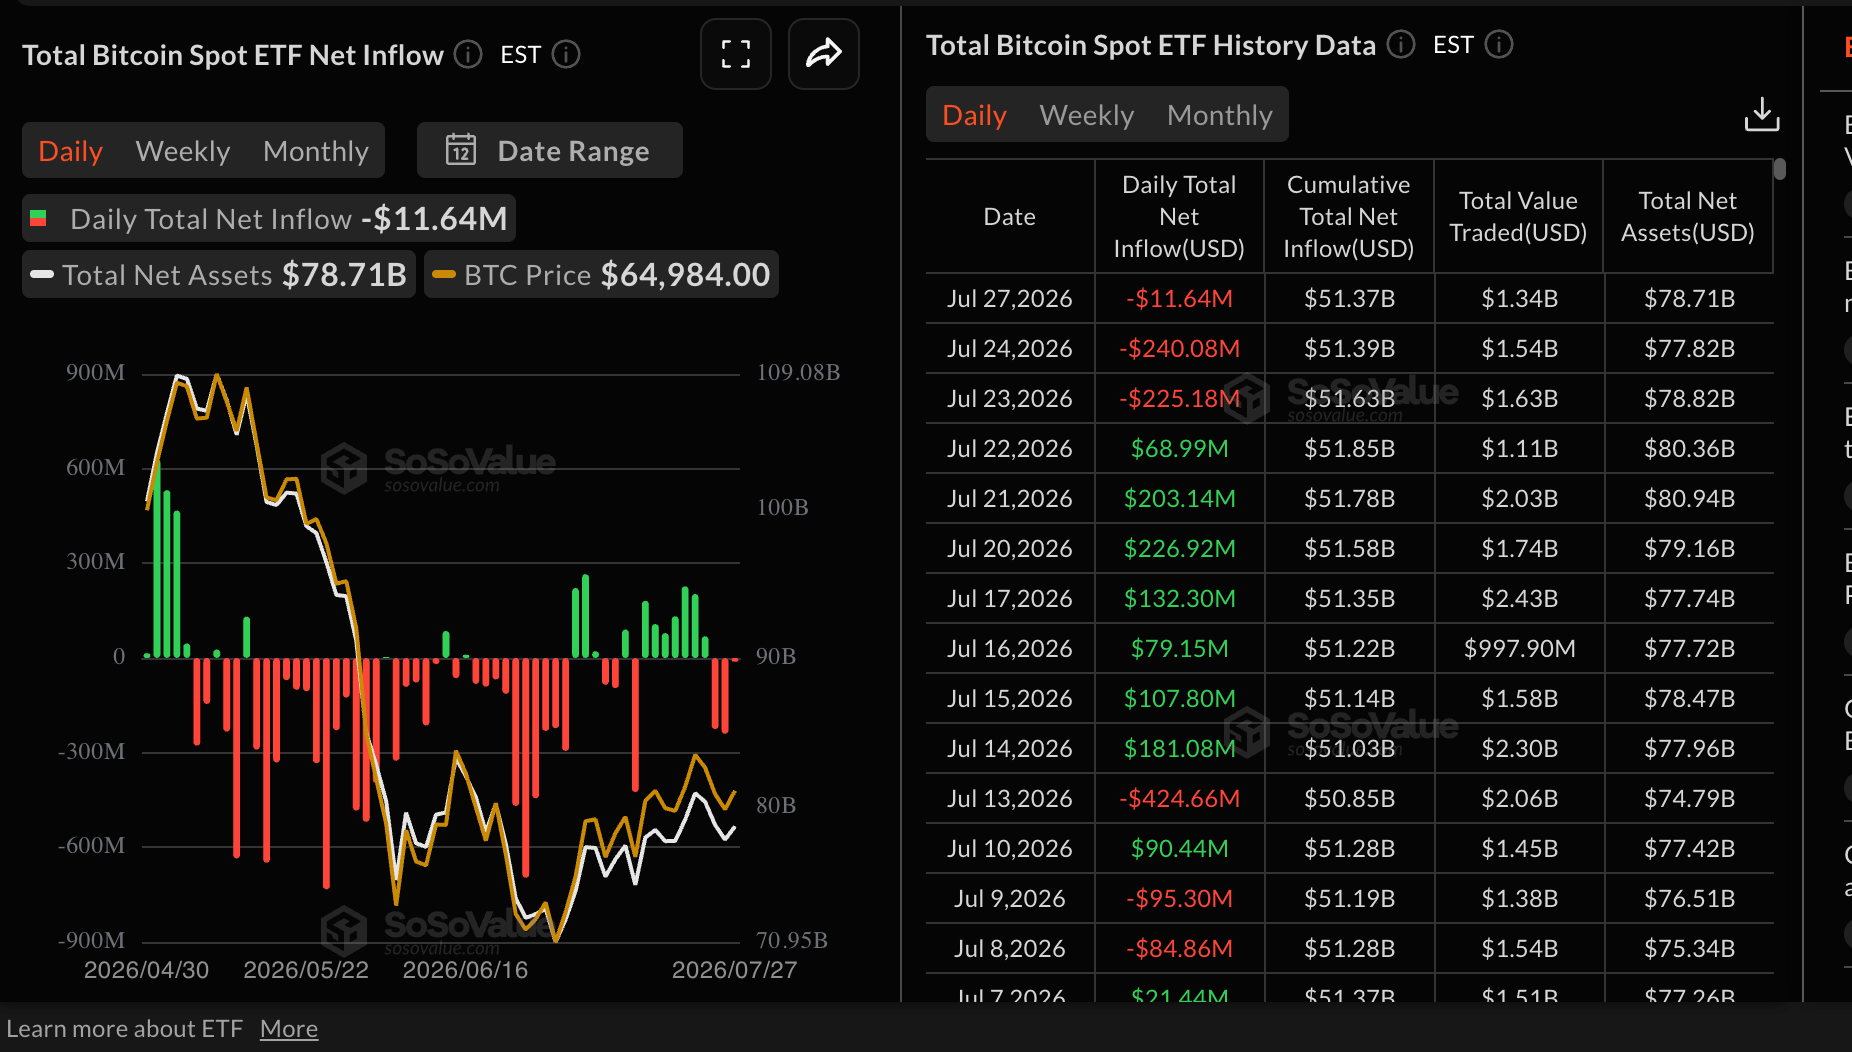
Bitcoin spot Exchange-Traded Funds (ETFs) extended the bearish streak for a third consecutive day, with outflows approaching $12 million on Monday. According to SoSoValue data, institutional withdrawals totaled $225 million on Thursday and $240 million on Friday, undermining risk exposure.
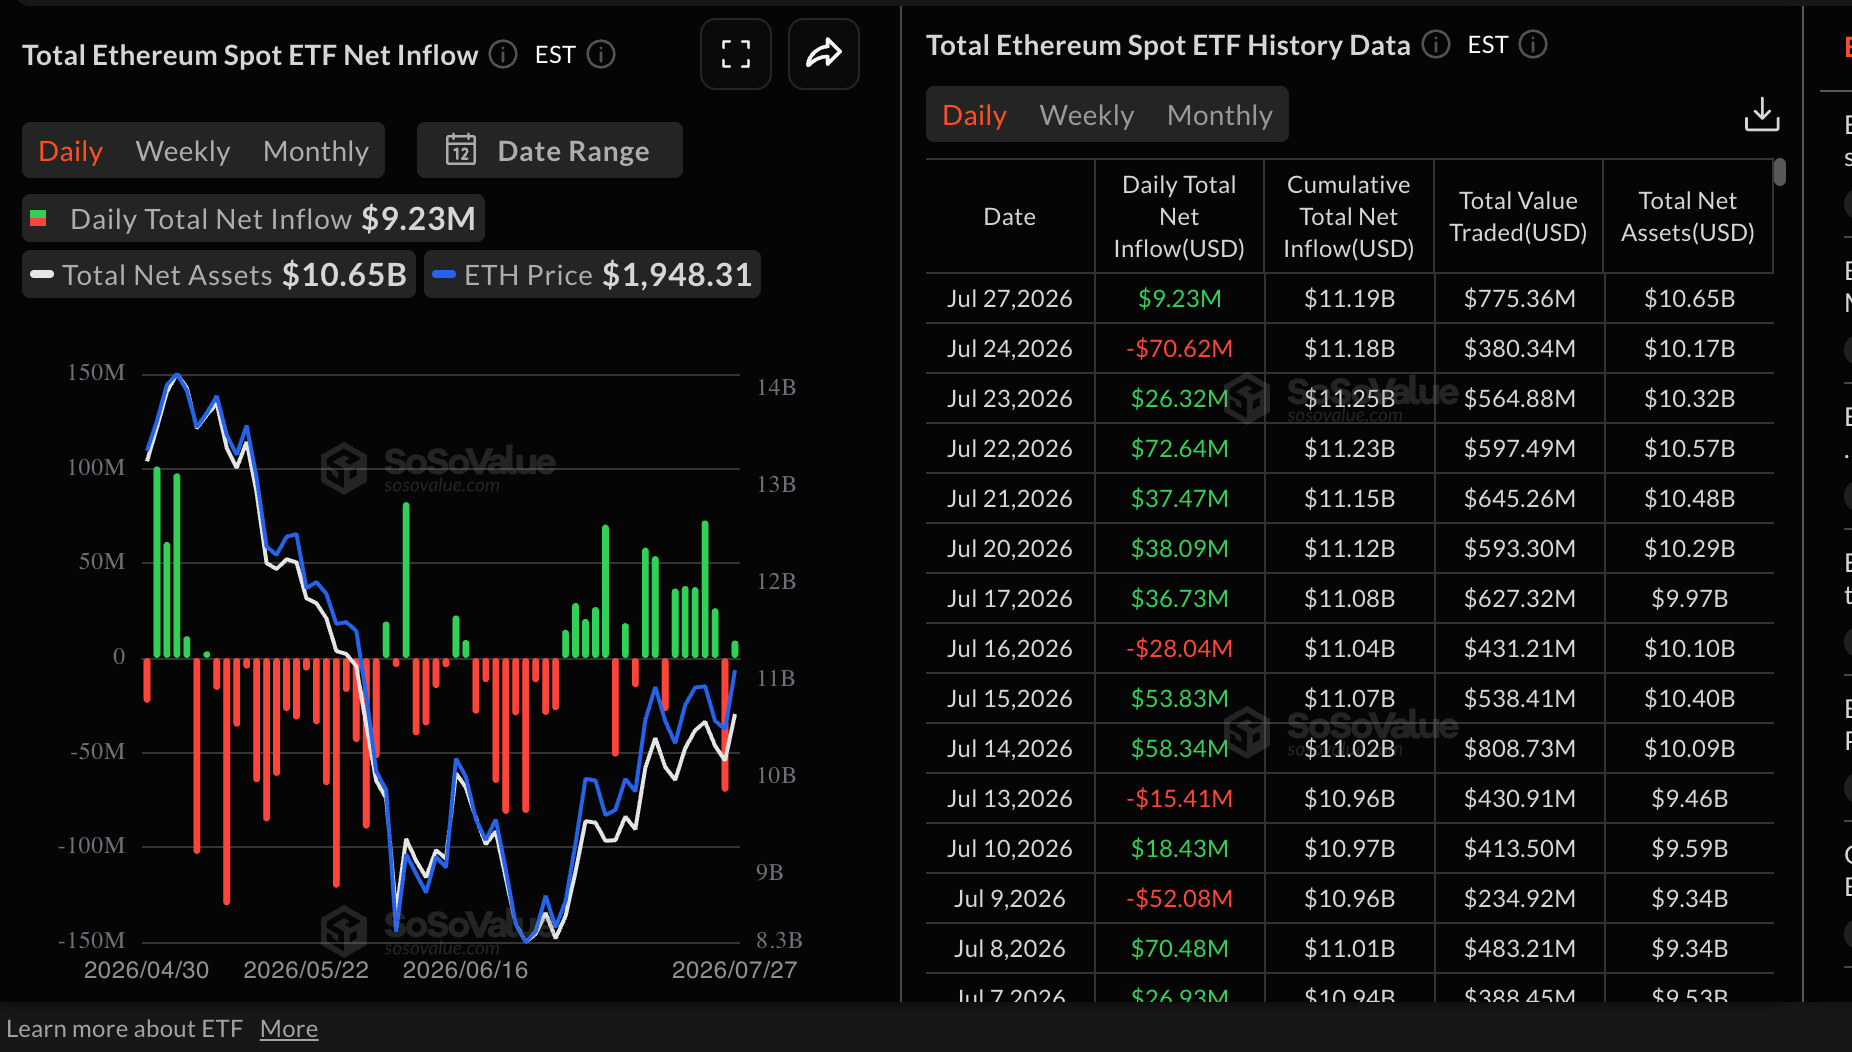
Ethereum spot ETFs outpaced Bitcoin, as inflows returned, reaching roughly $9 million on Monday. This followed Friday’s $71 million in outflows, which snipped five days of inflows.
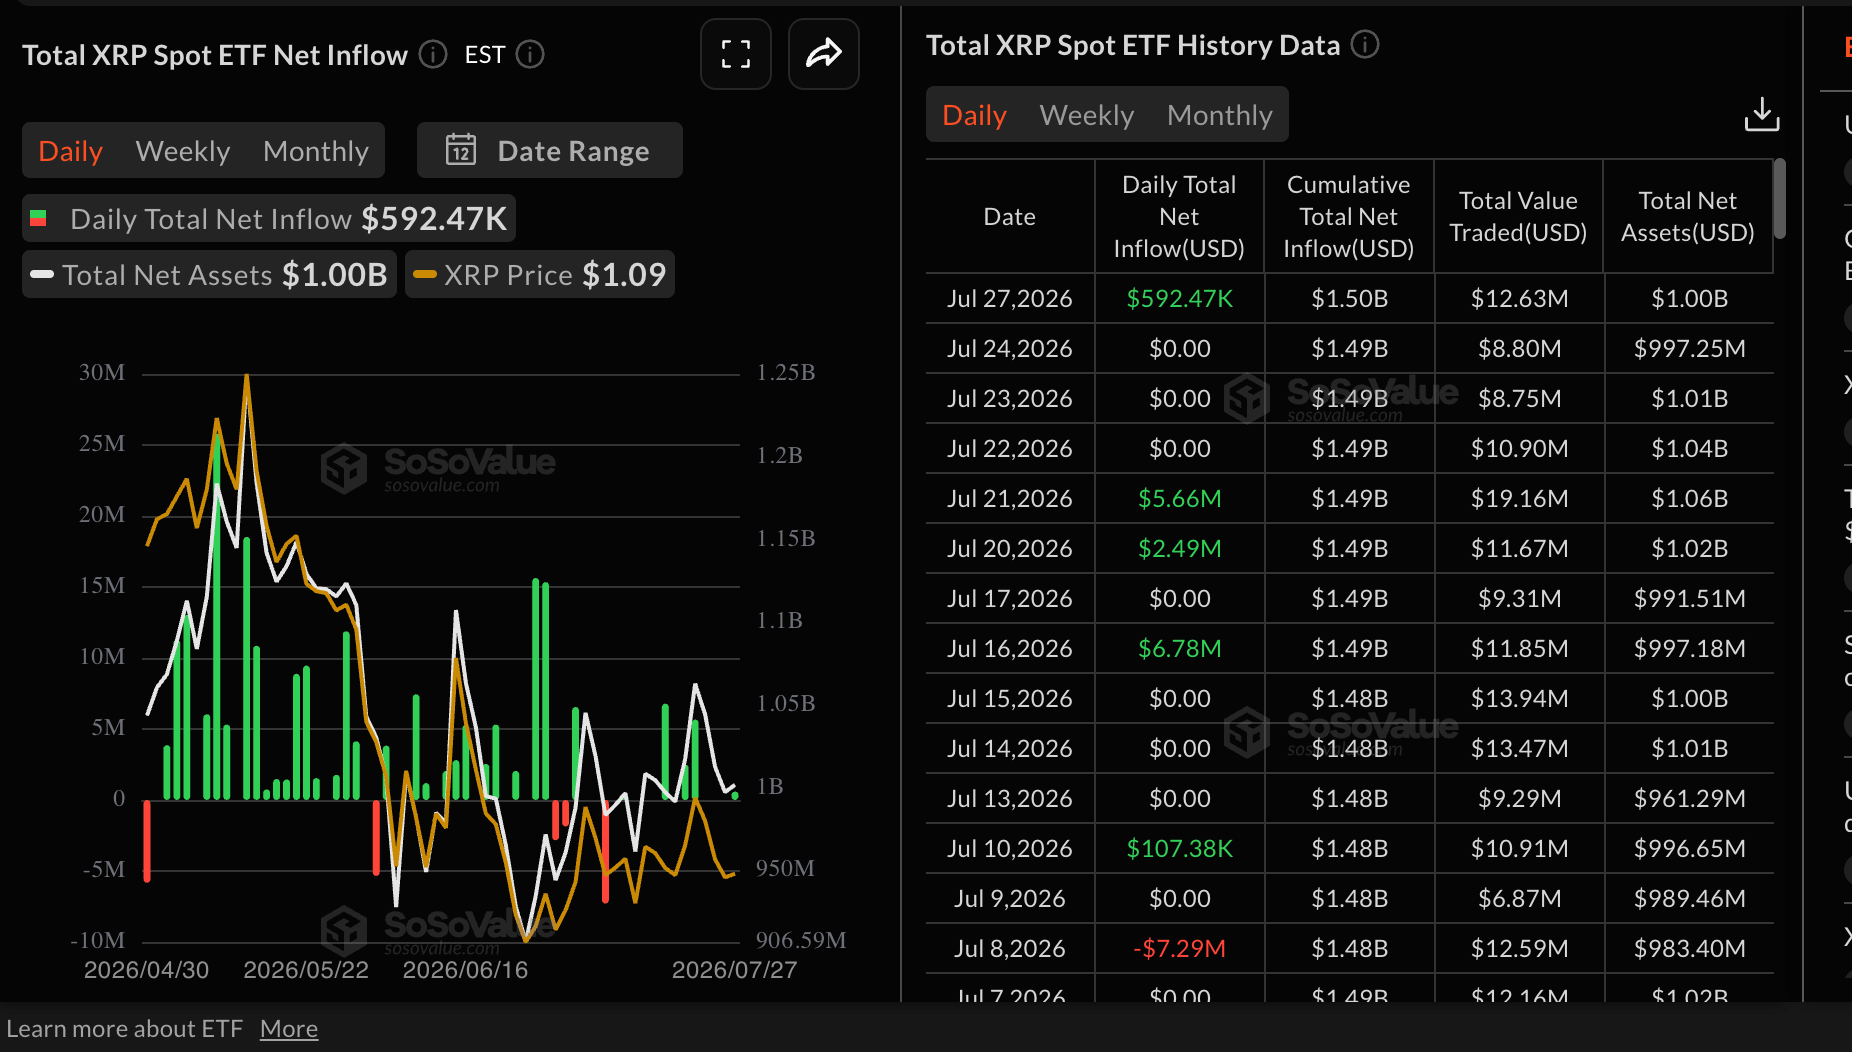
XRP spot ETFs posted very mild inflows totaling $592,000 on Monday, following three straight days of muted activity. Cumulative inflows edge higher to $1.50 billion, with net assets under management holding steady at $1 billion, according to SoSoValue.
Technical outlook: Bitcoin bears tighten grip amid persistent losses
Bitcoin trades around $63,460, keeping a bearish near-term bias as it holds below a dense pack of moving averages. The 50-day Exponential Moving Average (EMA) at $64,971 is the first cap on the upside, with the Parabolic SAR at $66,956 and the 100-day EMA at $67,651 reinforcing the notion of overhead supply.
Momentum is soft, with the Relative Strength Index (RSI) hovering near a neutral 46 on the daily chart and the Moving Average Convergence Divergence (MACD) histogram in negative territory, which together suggest a lack of buying conviction after the recent pullback.
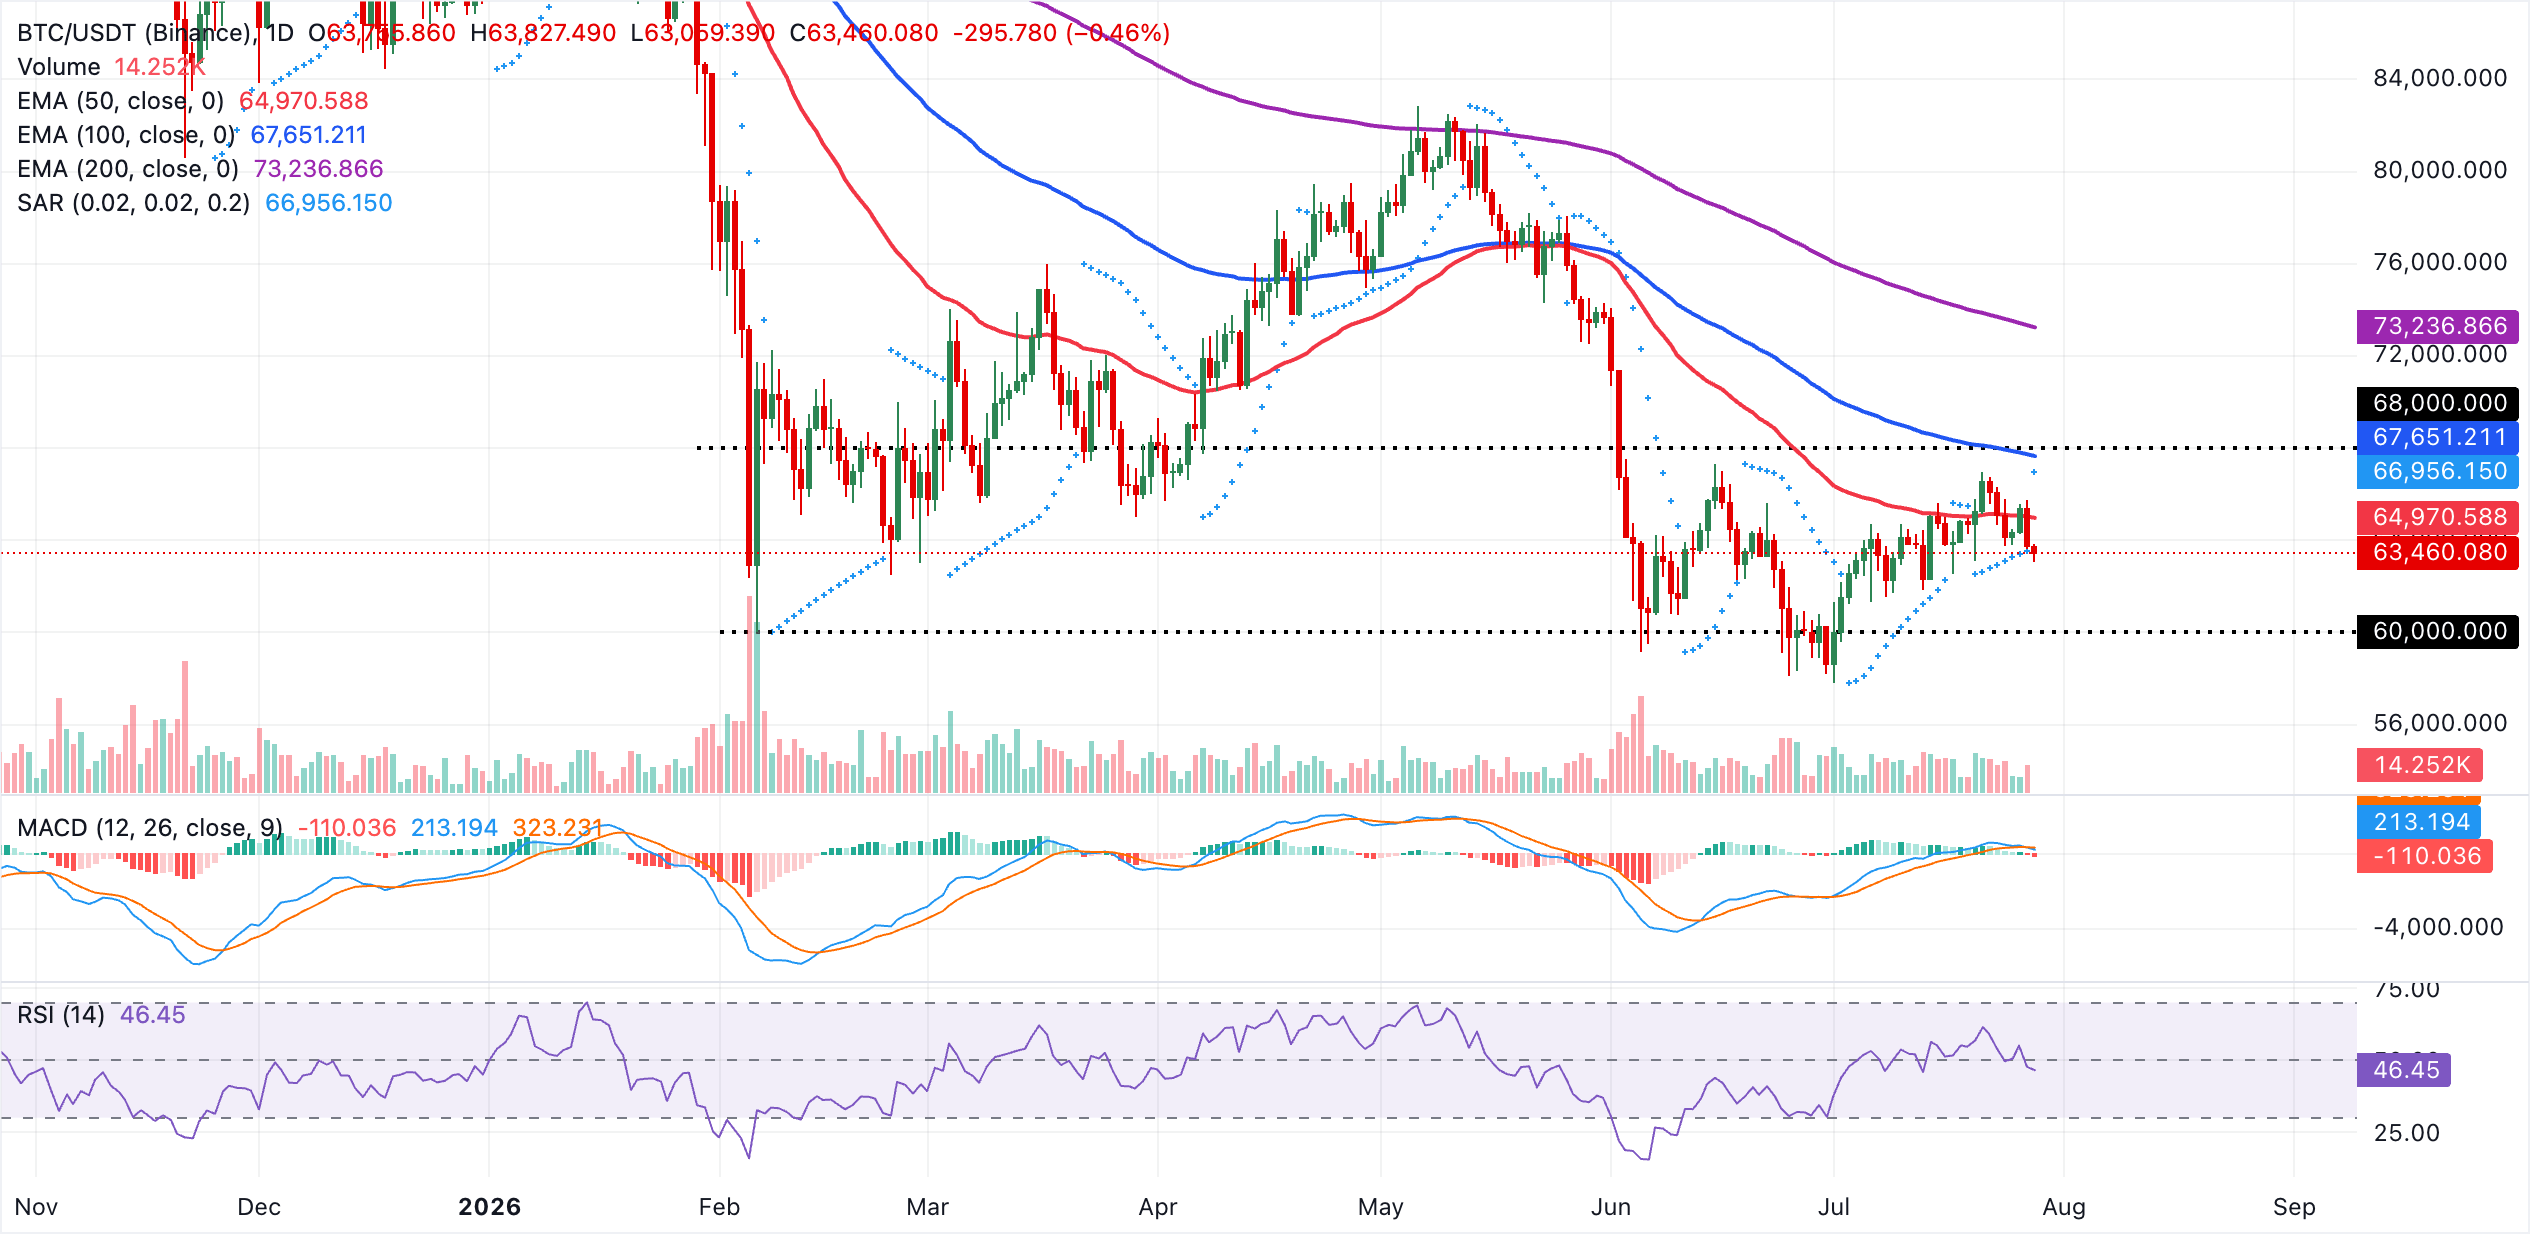
On the topside, immediate resistance is defined by the 50-day EMA at $64,971, followed by the Parabolic SAR level at $66,956 and the 100-day EMA at $67,651. A sustained break above these would be needed to challenge the longer-term bearish structure, where the 200-day EMA at $73,237 marks a more significant barrier. With no nearby technical supports on the daily chart, key psychological demand levels at $63,000 and $60,000 will come in handy and encourage bulls to reengage.
Altcoins technical outlook: Ethereum and XRP face renewed headwinds
Ethereum trades near $1,880, holding a constructive near-term bias as price sits above the short-term 50-day EMA at $1,841 and the latest Parabolic SAR signal at $1,856. This positioning suggests underlying dip-buying interest, even as broader trend gauges remain overhead.
Momentum is mixed, with the RSI near 54 indicating neutral-to-firm traction on the daily chart, while the MACD histogram has slipped marginally negative, hinting that bulls may face a slower grind higher rather than a clean breakout.
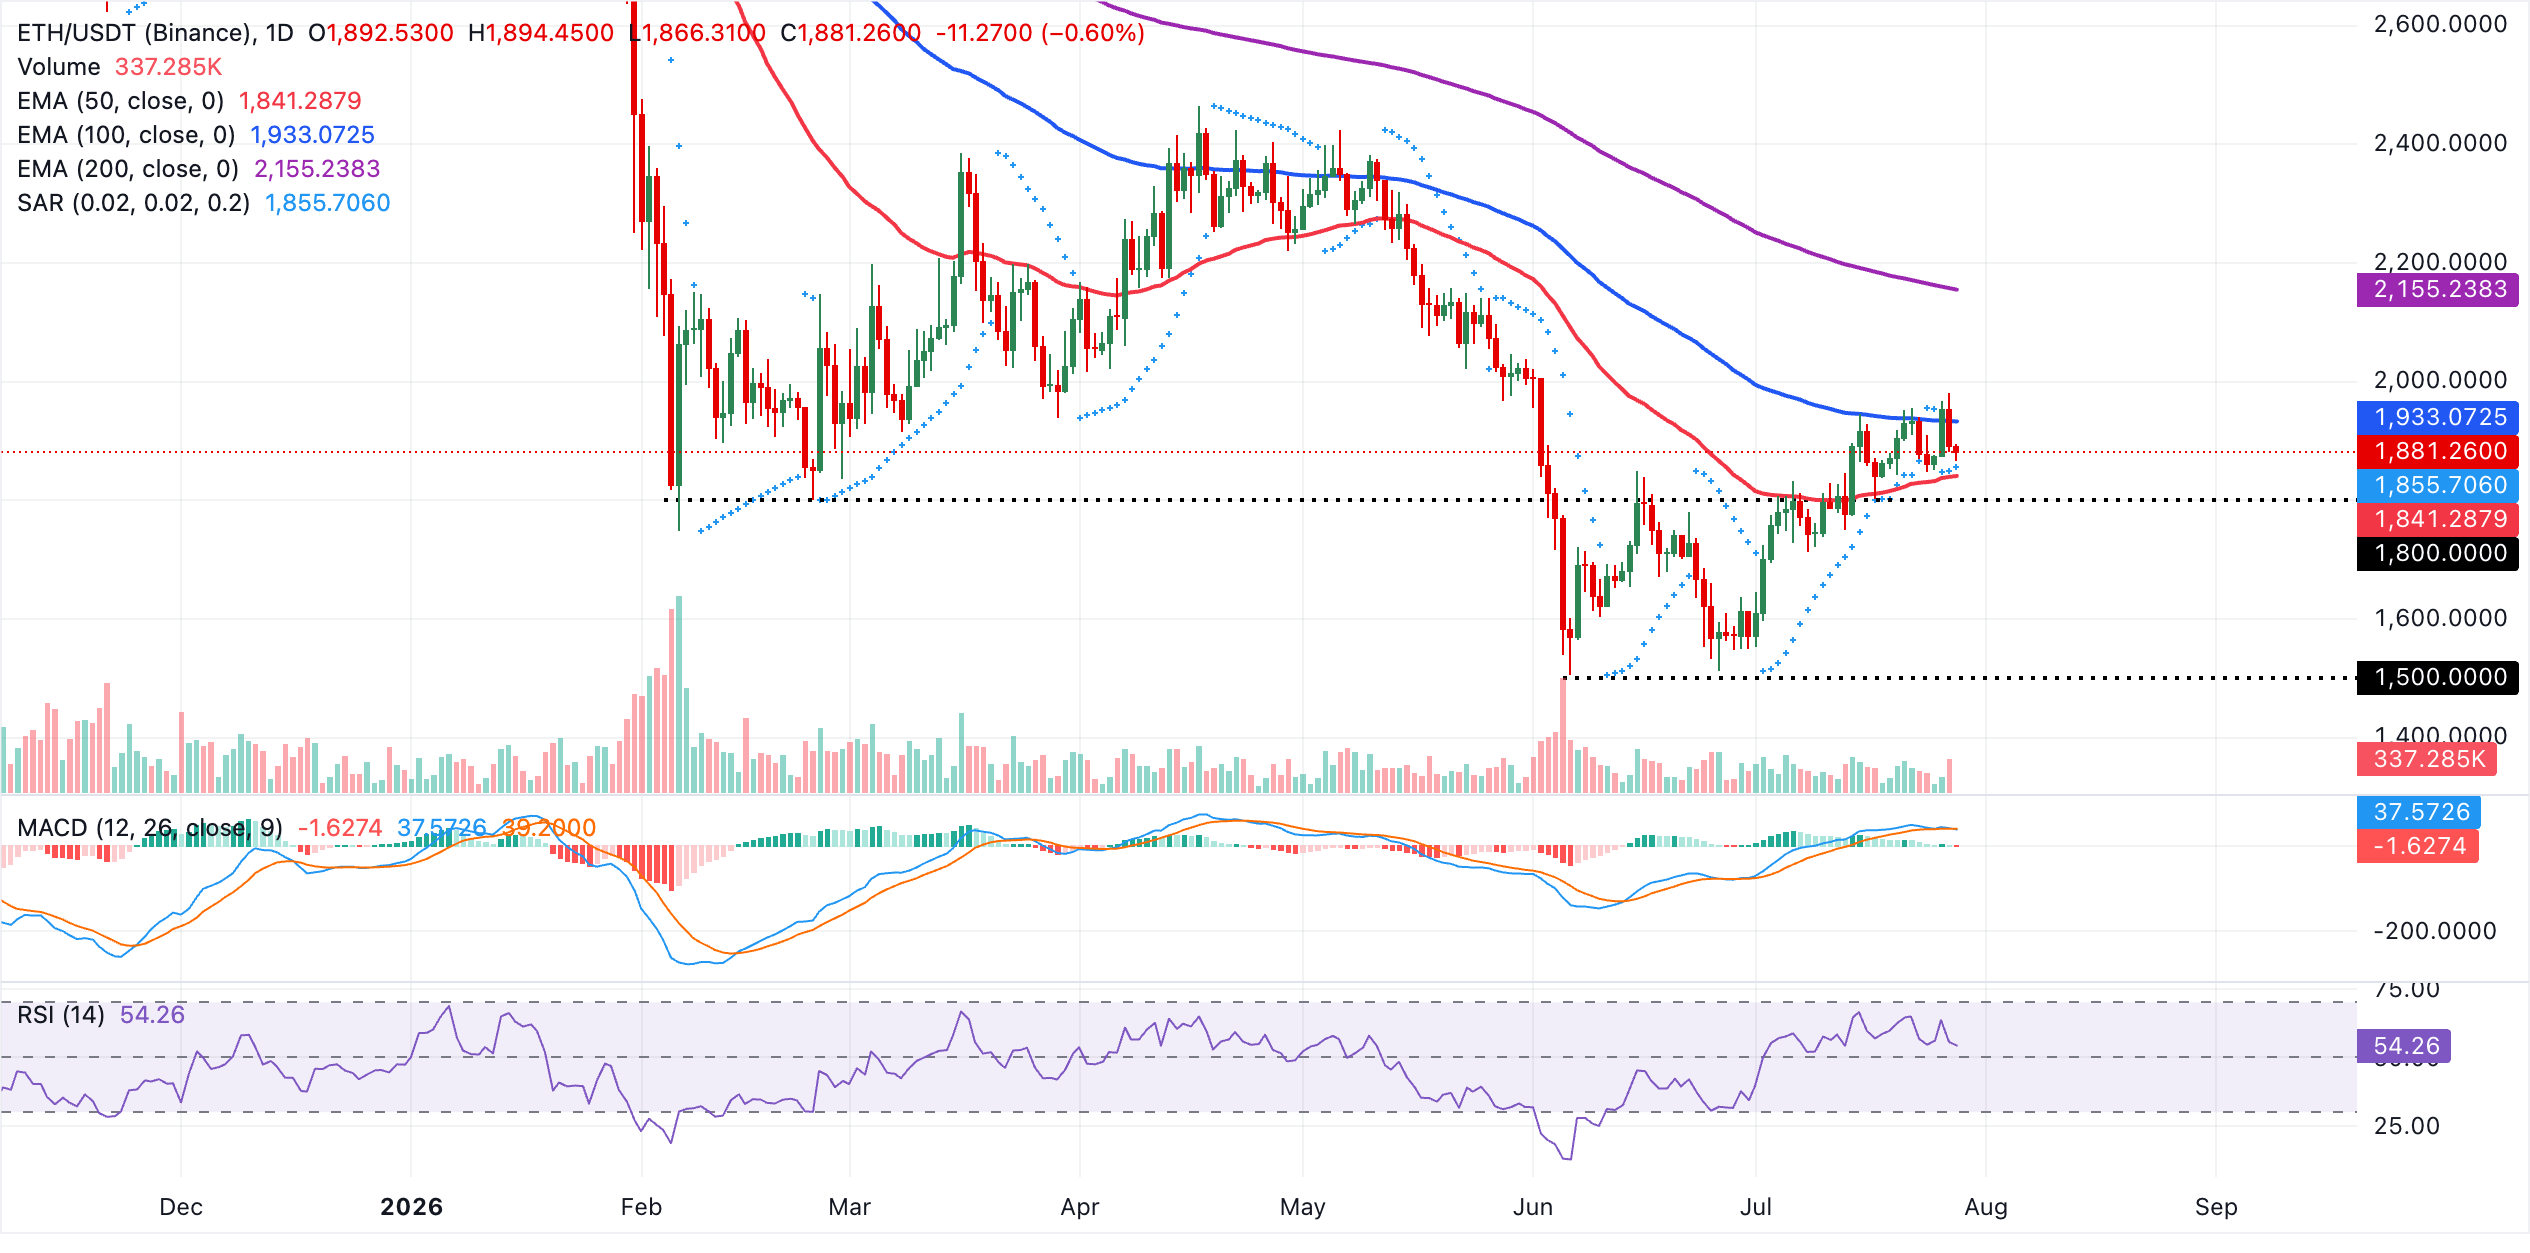
Initial resistance lies at the 100-day EMA around $1,933, with a stronger barrier emerging at the 200-day EMA near $2,155, where medium-term sellers are likely to defend the broader downtrend. On the downside, immediate support is implied by the Parabolic SAR at $1,856, followed by the 50-day EMA at $1,841. A daily close below this latter level would weaken the current bullish bias and open the door to a deeper corrective phase.
XRP, on the other hand, trades at $1.05 at the time of writing. The pair is pressed into the lower Bollinger Band near $1.05 acting as a pivot while price remains decisively below the indicator's middle layer at $1.10 and all three major moving averages, the 50-day, 100-day and the 200-day EMAs.
Momentum adds a soft negative tone as the RSI at 39 drifts below the midline on the daily chart and the MACD histogram holds slightly in negative territory, suggesting downside pressure is still dominant despite XRP's proximity to the Bollinger Band support.
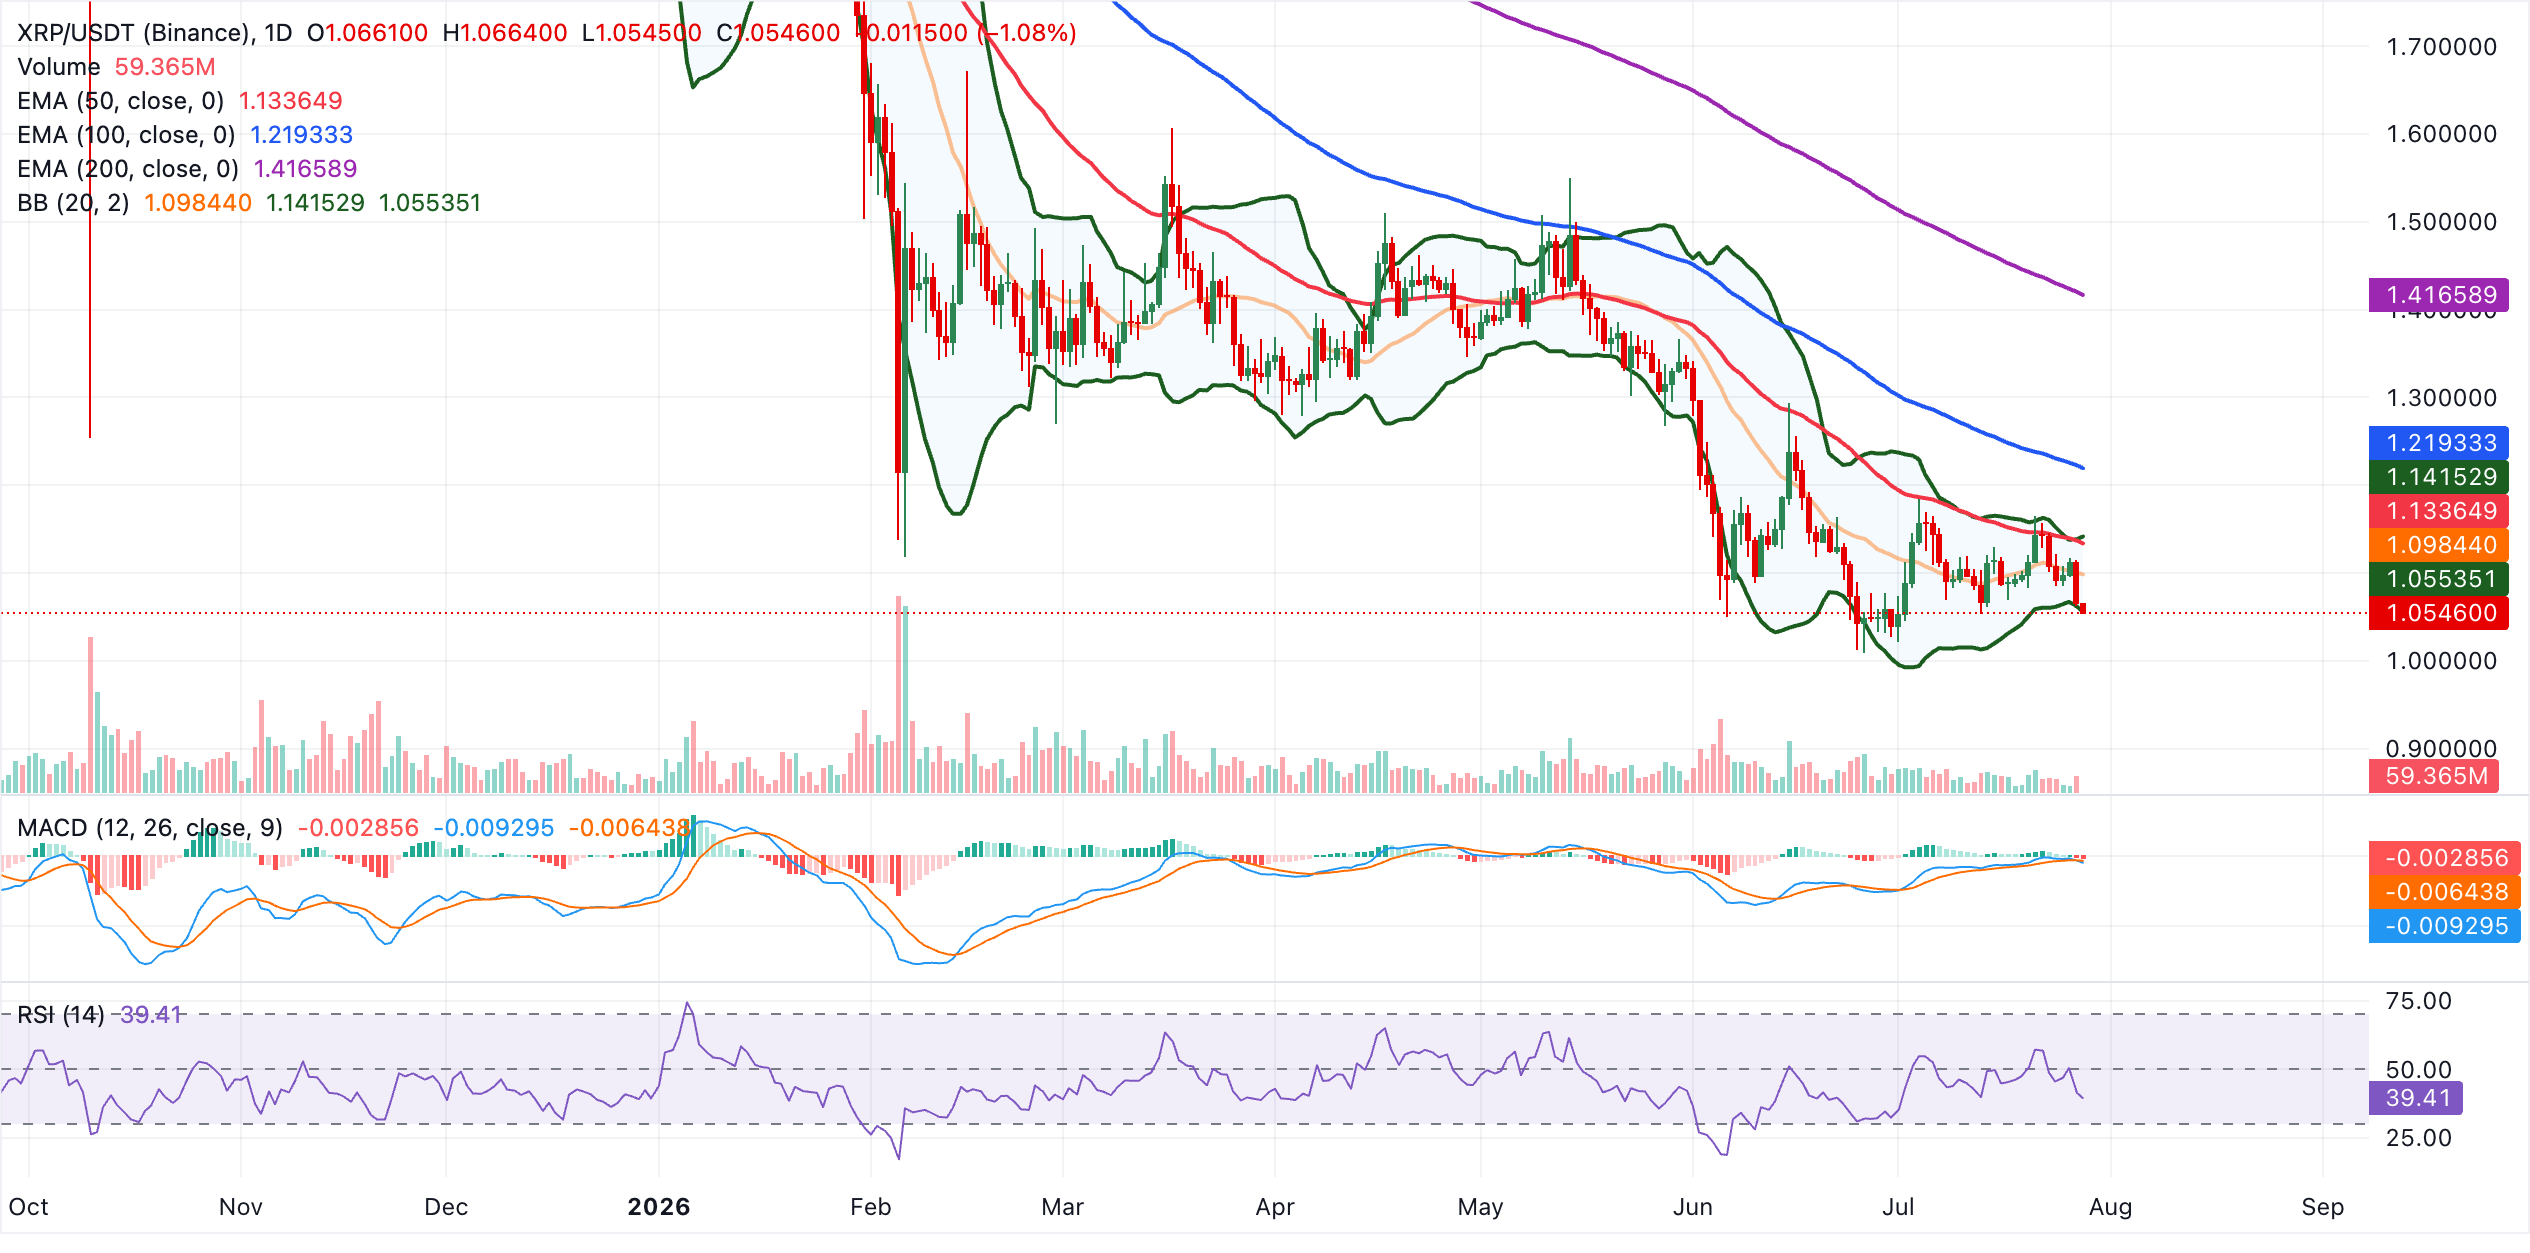
Immediate focus stays on the lower Bollinger Band layer at $1.05, where a sustained break would likely open the door to further selling toward key psychological levels such as $1.00. On the topside, initial resistance is lies at the Bollinger Band middle layer around $1.10, followed by the 50-day EMA at $1.13 and the upper Bollinger Band layer near $1.14. Above these barriers, the 100-day EMA at $1.22 and the distant 200-day EMA at $1.42 mark broader recovery hurdles that the pair would need to reclaim to neutralize the present bearish backdrop.
(The technical analysis of this story was written with the help of an AI tool. Know more.)
Crypto ETF FAQs
An Exchange-Traded Fund (ETF) is an investment vehicle or an index that tracks the price of an underlying asset. ETFs can not only track a single asset, but a group of assets and sectors. For example, a Bitcoin ETF tracks Bitcoin’s price. ETF is a tool used by investors to gain exposure to a certain asset.
Yes. The first Bitcoin futures ETF in the US was approved by the US Securities & Exchange Commission in October 2021. A total of seven Bitcoin futures ETFs have been approved, with more than 20 still waiting for the regulator’s permission. The SEC says that the cryptocurrency industry is new and subject to manipulation, which is why it has been delaying crypto-related futures ETFs for the last few years.
Yes. The SEC approved in January 2024 the listing and trading of several Bitcoin spot Exchange-Traded Funds, opening the door to institutional capital and mainstream investors to trade the main crypto currency. The decision was hailed by the industry as a game changer.
The main advantage of crypto ETFs is the possibility of gaining exposure to a cryptocurrency without ownership, reducing the risk and cost of holding the asset. Other pros are a lower learning curve and higher security for investors since ETFs take charge of securing the underlying asset holdings. As for the main drawbacks, the main one is that as an investor you can’t have direct ownership of the asset, or, as they say in crypto, “not your keys, not your coins.” Other disadvantages are higher costs associated with holding crypto since ETFs charge fees for active management. Finally, even though investing in ETFs reduces the risk of holding an asset, price swings in the underlying cryptocurrency are likely to be reflected in the investment vehicle too.
Bài viết đề xuất


