

Dogecoin Price Forecast: DOGE eyes $0.065 after breaking key support level

Nguồn Fxstreet
  • Dogecoin trades below $0.0700 on Friday following a 5% decline the previous day.
  • Bearish derivatives data signals a sell-side dominance among traders. 
  • The technical outlook for DOGE is bearish, with a breakout of the $0.0700 support level setting the stage for a steeper decline.

Dogecoin (DOGE) price trades in the red below $0.0700 on Friday, following a 5% drop the previous day. DOGE loses retail strength as broader market speculative demand eases with elevated tensions between the US and Iran. The technical outlook for DOGE points to deeper losses below $0.065.

Dogecoin takes the fall as broader market risk appetite wanes

Dogecoin, the largest meme coin with a valuation of over $11 billion, shows strong correlation with broader market sentiment, with speculative demand as the key bullish catalyst. The ongoing US-Iran war and President Donald Trump’s threat of a “major military punishment” for Iran have elevated fear in the crypto market. CoinMarketCap’s Fear and Greed Index stands at 37 on Friday, down from 40 on Wednesday, reflecting sentiments returning to bearish levels. 
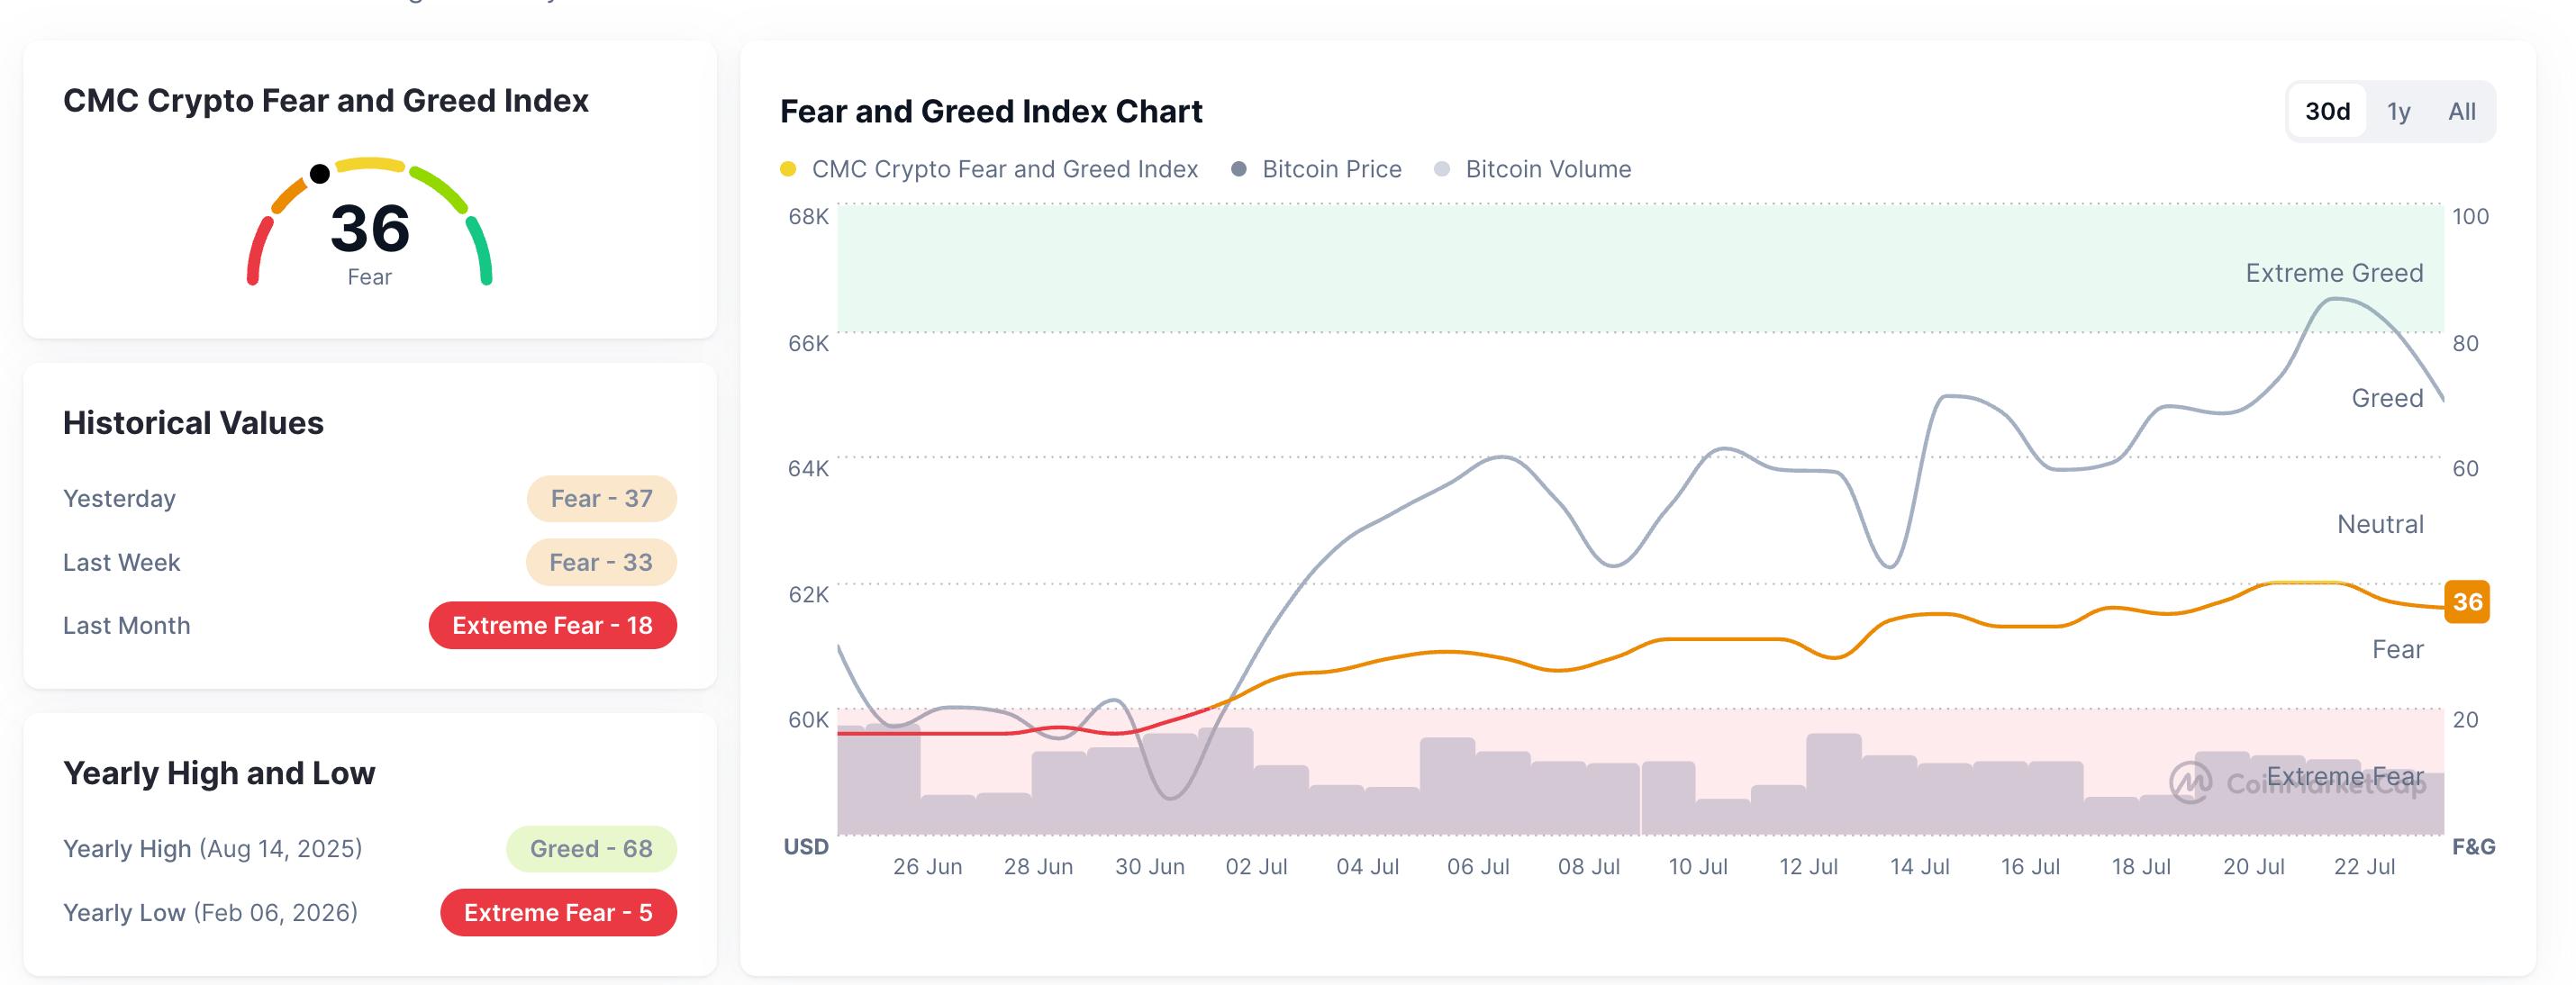
Fear and Greed Index. Source: CoinMarketCap

CoinGlass data shows the DOGE futures Open Interest (OI) edges lower to $1.10 billion, reflecting a mild contraction in the notional value of existing perpetual contracts. However, the 76% increase in trading volume to $1.38 billion reflects rising retail activity. 

The funding rate of -0.0016% reflects a bearish bias in the retail activity, as traders are willing to buy short positions at a premium. In addition, long liquidation of $8.19 million over the last 24 hours outpaced short liquidation of $552,490, reaffirming the sell-side dominance. 
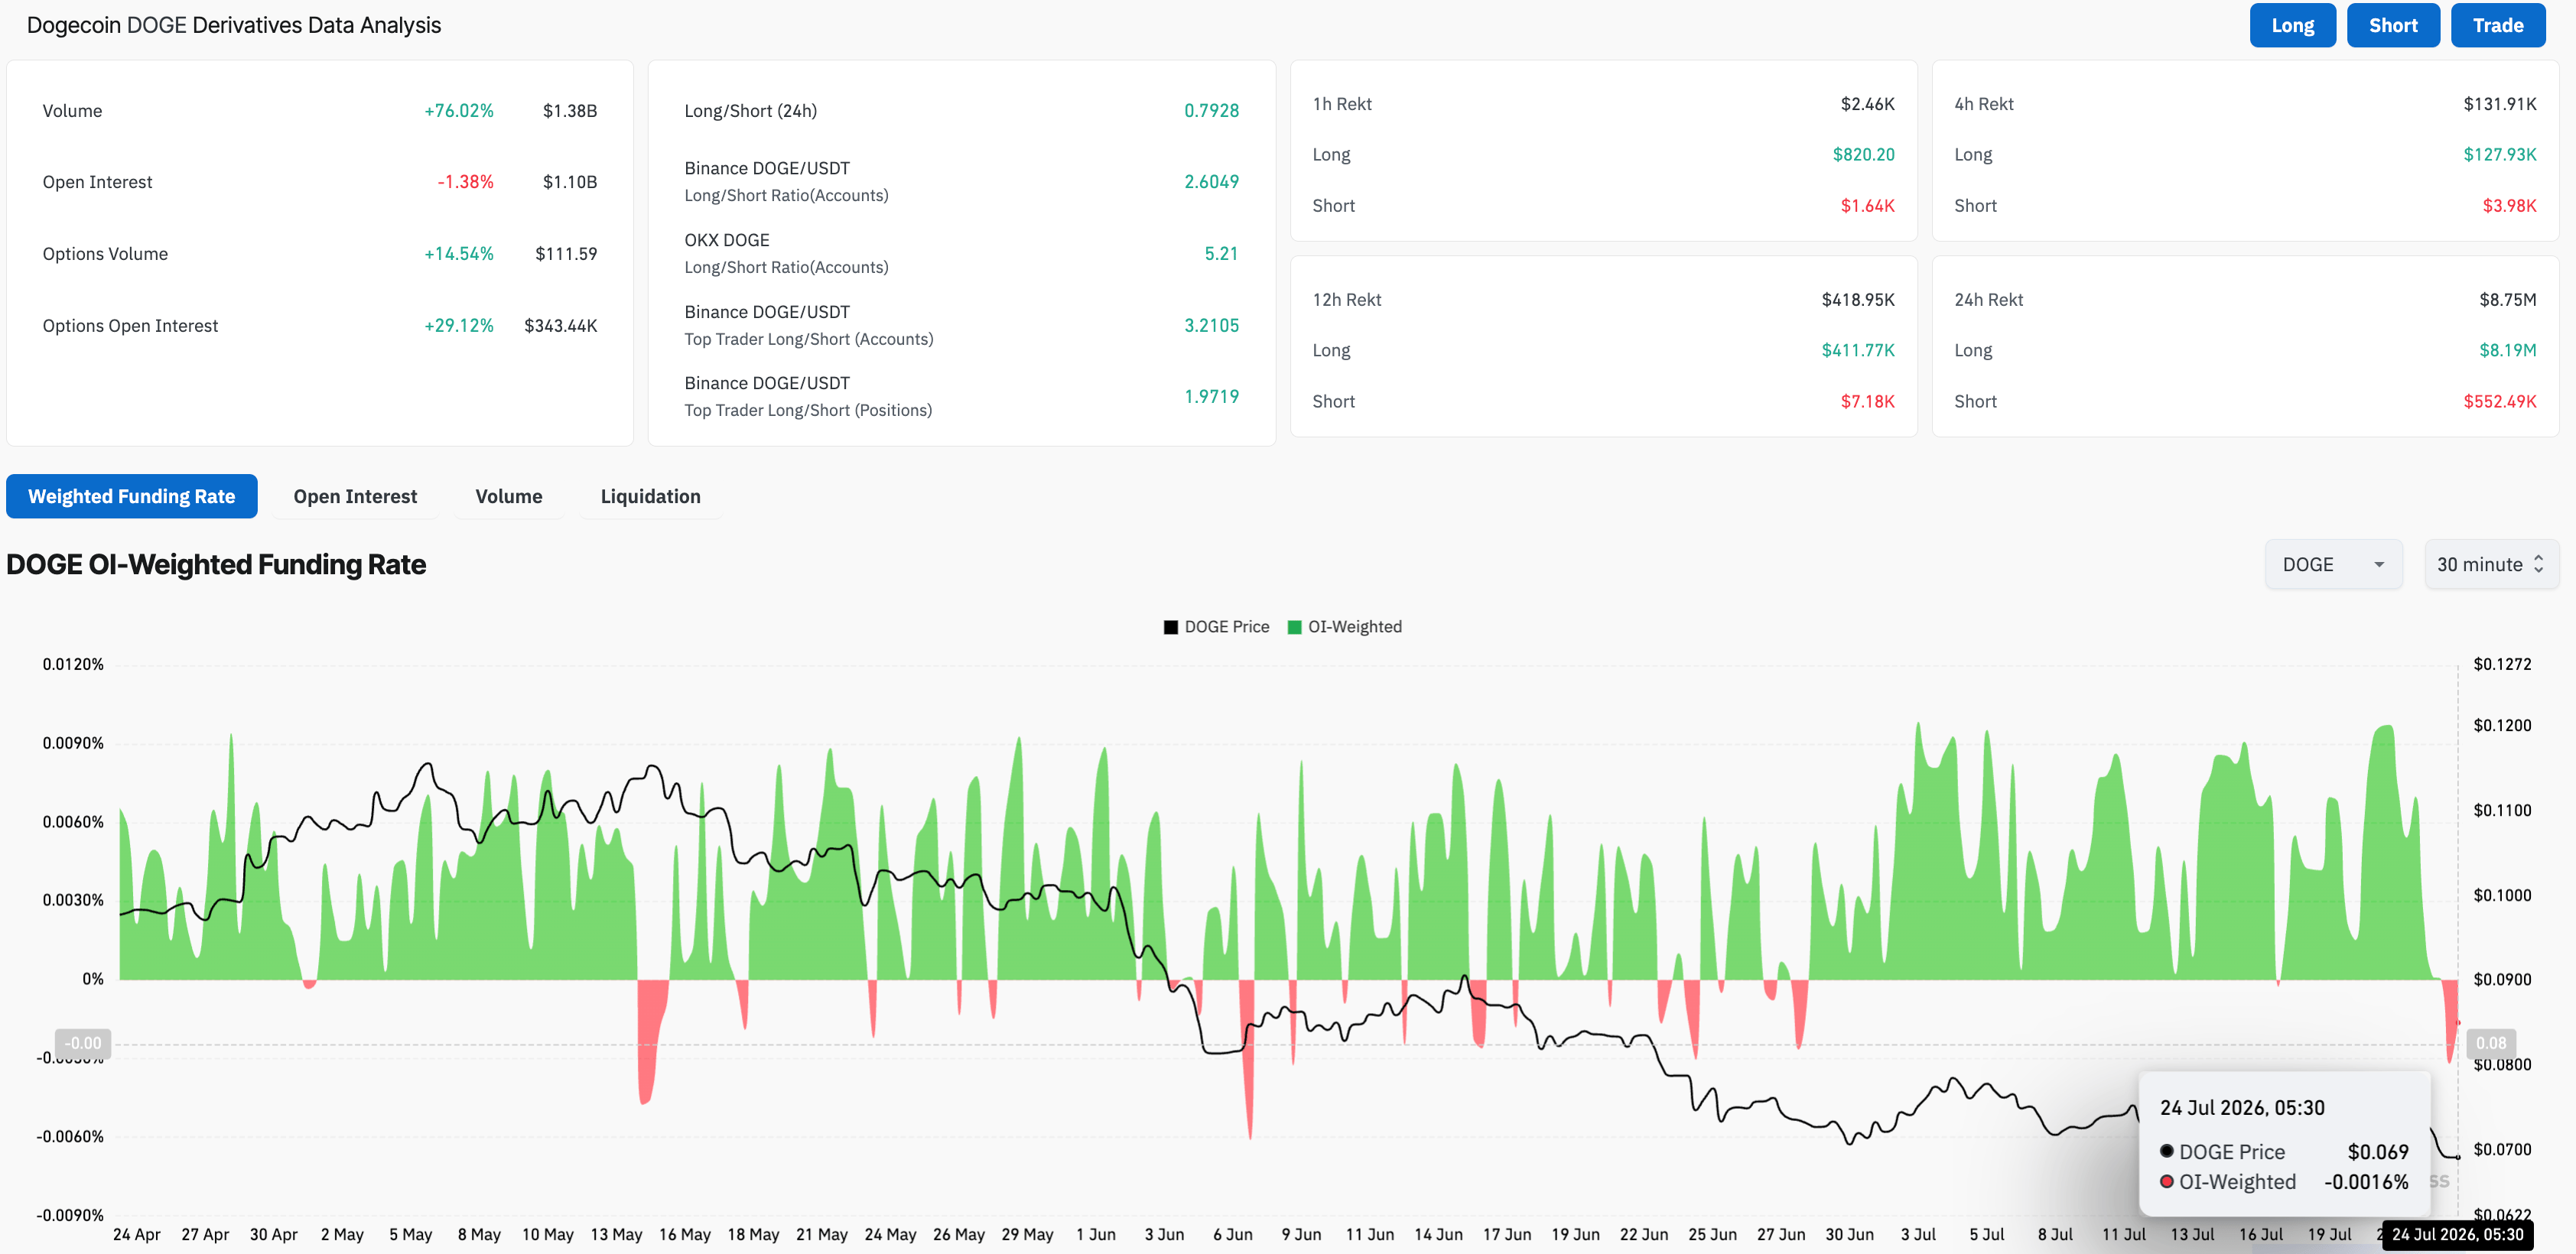
DOGE derivatives data. Source: CoinGlass

Will Dogecoin extend its decline below $0.0700?

Dogecoin hovers below $0.0700 at press time on Friday after a 5% decline the previous day broke below the $0.0700 threshold. The meme coin maintains a bearish near-term bias, with price holding below both the 50-day Exponential Moving Average (EMA) at $0.0788 and the 200-day EMA at $0.1032.

The pair remains vulnerable to more downside after a sustained decline, with the Relative Strength Index (RSI) hovering at 31, on the verge of signaling oversold conditions. Meanwhile, the Moving Average Convergence Divergence (MACD) tests the signal line, hinting at renewed bearish momentum.

On the downside, the next meaningful support comes in at $0.0641, where buyers would be expected to defend the recent range; a daily close below this floor would likely open the door to a deeper slide despite the nascent improvement in momentum indicators.

Chart Analysis DOGE/USDT (Binance)
DOGE/USDT daily price chart.

On the topside, immediate resistance appears at the horizontal barrier of $0.0700, followed by $0.0777, near the 50-day EMA at $0.0788, which together define a broader supply zone.

(The technical analysis of this story was written with the help of an AI tool. Know more.)

Tuyên bố miễn trừ trách nhiệm: Chỉ dành cho mục đích thông tin. Hiệu suất trong quá khứ không đảm bảo cho kết quả trong tương lai.
placeholder
3 cổ phiếu khai thác crypto có thể tăng ngay cả khi giá Bitcoin giảmBitcoin không có kết quả tốt trong tháng qua và tiếp tục giảm sau khi rớt xuống dưới 100,000 USD. Các cổ phiếu khai thác crypto cũng chịu chung số phận bởi doanh thu của họ phụ thuộc nhiều vào Bitcoin
Tác giả  BeInCrypto
ngày09 tháng 12 năm 2025
Bitcoin không có kết quả tốt trong tháng qua và tiếp tục giảm sau khi rớt xuống dưới 100,000 USD. Các cổ phiếu khai thác crypto cũng chịu chung số phận bởi doanh thu của họ phụ thuộc nhiều vào Bitcoin
placeholder
Giá Bitcoin tăng vọt gần 64,000 USD khi phe bán khống bị thanh lýBitcoin (BTC) đã tăng vọt lên gần 64,000 USD vào đầu ngày 06/07/2024, chạm mức 63,900 USD trên CoinGecko, tiếp tục đà tăng vào cuối tuần và khiến hàng trăm triệu USD vị thế short bị thanh lý.Diễn biến
Tác giả  BeInCrypto
7 tháng 06 ngày Thứ Hai
Bitcoin (BTC) đã tăng vọt lên gần 64,000 USD vào đầu ngày 06/07/2024, chạm mức 63,900 USD trên CoinGecko, tiếp tục đà tăng vào cuối tuần và khiến hàng trăm triệu USD vị thế short bị thanh lý.Diễn biến
placeholder
Dự báo CPI tháng 6 của Mỹ: Liệu lạm phát hạ nhiệt có mở ra kỳ vọng cắt giảm lãi suất của Fed? Chứng khoán Mỹ, đồng USD và vàng sẽ phản ứng như thế nào?Mỹ sẽ công bố dữ liệu Chỉ số Giá Tiêu dùng (CPI) tháng 6 vào thứ Ba tuần này, đây là một trong những sự kiện kinh tế vĩ mô quan trọng nhất trên thị trường tài chính toàn cầu tuần này. Tro
Tác giả  TradingKey
7 tháng 13 ngày Thứ Hai
Mỹ sẽ công bố dữ liệu Chỉ số Giá Tiêu dùng (CPI) tháng 6 vào thứ Ba tuần này, đây là một trong những sự kiện kinh tế vĩ mô quan trọng nhất trên thị trường tài chính toàn cầu tuần này. Tro
placeholder
Dự báo giá bạc: XAG/USD tăng vọt lên gần 58,20$ khi đà tăng giá dầu tạm dừngGiá bạc (XAG/USD) tăng hơn 3% lên gần 58,20$ trong phiên giao dịch đầu tiên ở châu Âu vào thứ Ba.
Tác giả  FXStreet
7 tháng 21 ngày Thứ Ba
Giá bạc (XAG/USD) tăng hơn 3% lên gần 58,20$ trong phiên giao dịch đầu tiên ở châu Âu vào thứ Ba.
placeholder
Điểm tin thị trường hôm nay: Giá dầu vượt ngưỡng 100 USD, làm dấy lên lo ngại lạm phát, trong bối cảnh chi tiêu vốn cho AI bị giám sát chặt chẽ và cú lao dốc 14% của Tesla kéo giảm nhóm công nghệTheo dõi xu hướng thị trườngTradingKey - Thị trường đã hứng chịu đòn giáng kép từ việc giá dầu tăng vọt và những hoài nghi về hiệu quả sinh lợi của các khoản đầu tư vào AI, vốn dấy lên từ việc gia tăn
Tác giả  TradingKey
4 giờ trước
Theo dõi xu hướng thị trườngTradingKey - Thị trường đã hứng chịu đòn giáng kép từ việc giá dầu tăng vọt và những hoài nghi về hiệu quả sinh lợi của các khoản đầu tư vào AI, vốn dấy lên từ việc gia tăn
sản phẩm liên quan
goTop
quote