


Cardano Price Forecast: ADA holds steady as Van Rossem hard fork goes live
- Cardano stalls at $0.165 on Monday following a modest recovery in the previous week.
- Cardano activates its first hard fork approved entirely through onchain governance, introducing Protocol Version 11 with enhanced Plutus capabilities.
- Mixed derivatives metrics continue to limit ADA’s upside despite the network’s latest technical upgrade.
Cardano (ADA) stalls at $0.165 on Monday after a modest rebound in the previous week. The activation of the Van Rossem hard fork on Saturday marked Cardano’s first protocol upgrade approved entirely through onchain governance, which introduced Protocol Version 11 with improvements aimed at reducing smart contract costs. Despite this bullish development, mixed derivatives metrics among the traders cap ADA’s recovery.
Van Rossem hard fork boosts Cardano’s long-term outlook
Cardano activated the Van Rossem hard fork on Saturday, marking the network’s first major upgrade fully approved and ratified through onchain governance.
The upgrade introduces new Plutus capabilities and cost-model improvements intended to lower smart-contract execution costs, while laying technical groundwork for the Dijkstra era.
This development could serve as a positive catalyst for ADA in the long term, enhancing Cardano’s smart contract capabilities and network efficiency. However, in the short term, it failed to lift sentiment, with the ADA price trading sideways around $0.165 on Monday after a mild recovery the previous week.
Mixed sentiment caps recovery
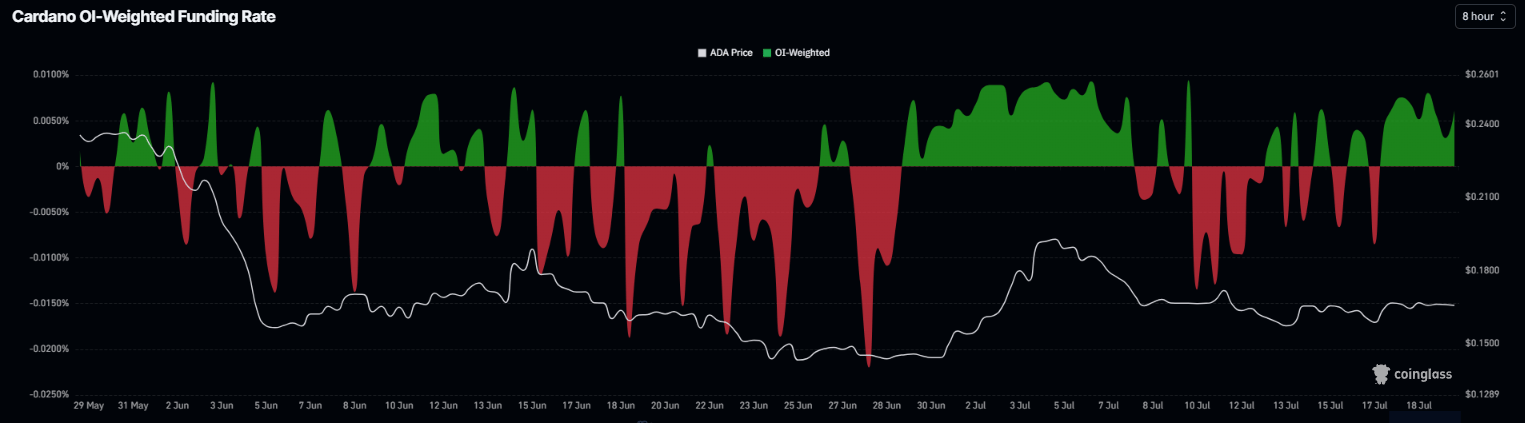
Derivatives metrics show mixed sentiment among Cardano traders. Coinglass’s Funding rates data for ADA flipped positive on Friday, with a reading of 0.0061% on Monday, indicating that longs are paying the shorts and highlighting improving sentiment.
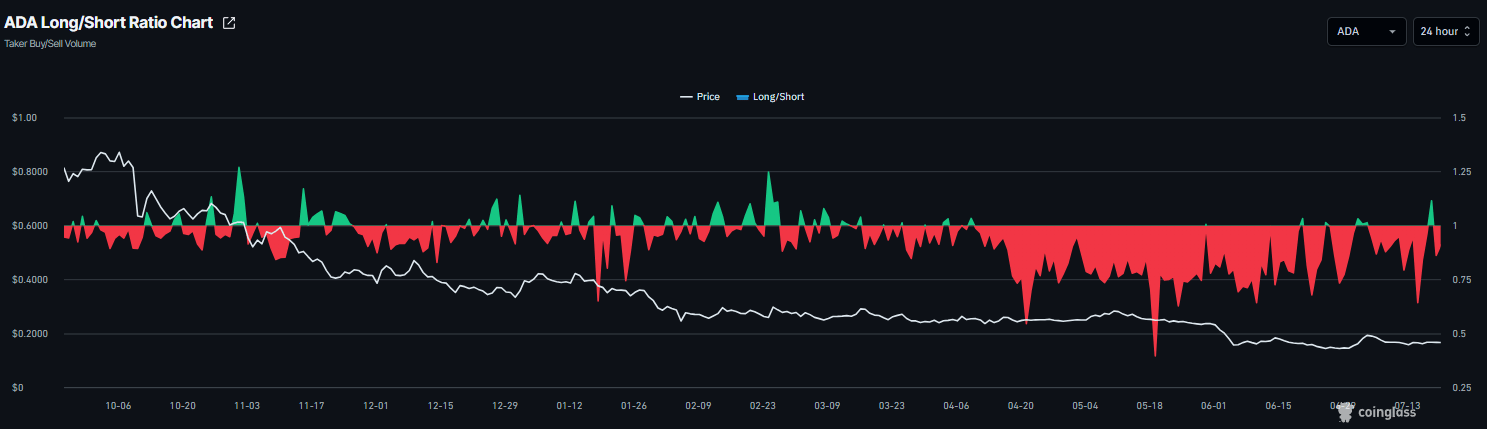
However, Coinglass’ long-to-short ratio for ADA read 0.90 on Monday. The ratio being below one, indicates bearish sentiment, as traders are betting the asset’s price will fall.
Cardano Price Forecast: ADA trades sideways
Cardano price trades at $0.165 on Monday, following a mild recovery in the previous week. Despite the mild rebound, ADA maintains a bearish bias as price remains well below the 50-day, 100-day, and 200-day Exponential Moving Averages (EMAs), clustered between roughly $0.180 and $0.270. The pair has stalled after its early-July rebound, with sellers defending the lower Fibonacci retracements of the April–June downswing, while the Relative Strength Index (RSI) flatlines just under the 50 mark, hinting at a lack of directional conviction. The Moving Average Convergence Divergence (MACD) indicator hovers marginally in positive territory but remains muted, suggesting only modest upside momentum against a still-dominant overhead structure.
On the topside, initial resistance is seen at the 23.6% Fibonacci retracement at $0.173, followed closely by the 50-day EMA at $0.177, forming a nearby cap that bulls would need to clear to extend recovery attempts. Further up, the 38.2% retracement at $0.195 and the broken downtrend trigger zone near $0.202 align with the 100-day EMA at $0.205, ahead of a denser band of resistance between the $0.231–$0.245 area and the longer-term 200-day EMA at $0.273.
On the downside, immediate support emerges at the horizontal level of $0.150, with the prior swing low around the 0.0% Fibonacci anchor at $0.138 envisaged as a deeper bearish target if selling pressure resumes.
(The technical analysis of this story was written with the help of an AI tool. Know more.)
Bài viết đề xuất


