


Crypto Today: Bitcoin, Ethereum, XRP steady above supports on Iran deal hopes
- Bitcoin rises above $77,000, building on hopes of a US-Iran peace deal despite cooling retail demand.
- Ethereum remains above the $2,100 support as momentum indicators gradually improve.
- XRP ticks up, trading above $1.36 on Monday, supported by steady demand through spot ETFs.
Cryptocurrency prices are broadly holding steady on Monday, with Bitcoin (BTC) trading above its short-term $77,000 support, Ethereum (ETH) above the $2,100 demand area and Ripple (XRP) hovering above $1.36.
US-Iran deal optimism lifts risk sentiment
The United States (US) and Iran appear to be closing in on a deal to end the war in the Middle East and open the Strait of Hormuz, whose continued closure is exerting immense pressure on global Oil and Gas supplies.
US President Donald Trump said over the weekend that the peace agreement had been largely negotiated. The two countries are reportedly finalizing a 60-day ceasefire that could pave the way for a gradual reopening of the Strait of Hormuz, end the blockade of Iranian ports, and allow discussions on a potential nuclear deal, according to AP News.
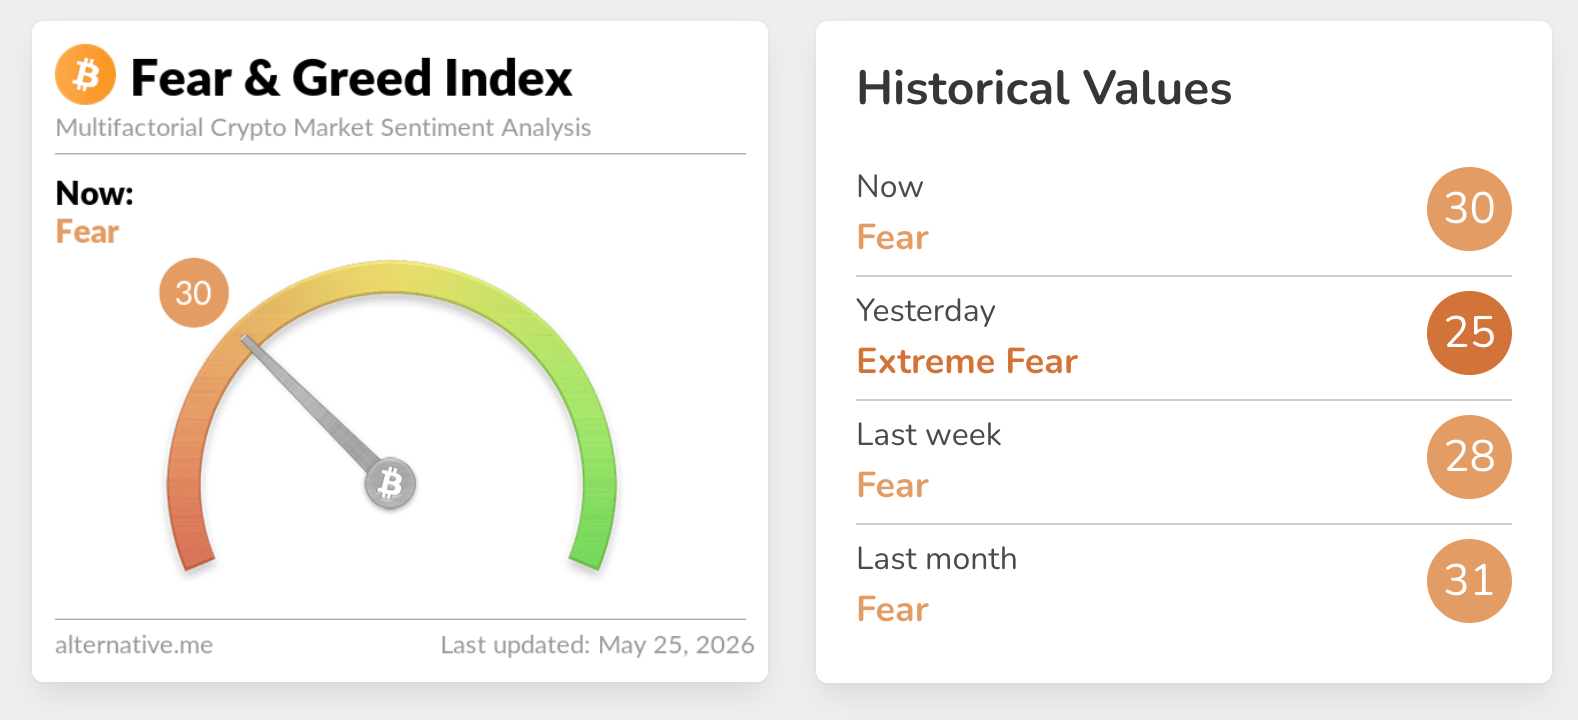
Sentiment toward risk assets, including crypto, is improving. The Fear and Greed Index is up at 30 in the Fear Territory on Monday, up from 25 in the Extreme Fear zone the day before. However, a sustained increase in risk appetite remains necessary to underpin a more robust bullish trend.
Price analysis: Bitcoin bulls strive to regain trend control
Bitcoin trades at at $77,350, keeping a soft bearish bias as it sits below the 200-day Exponential Moving Average (EMA) at $81,335 while holding above the 50-day and 100-day EMAs clustered just under $77,000. This configuration suggests the broader uptrend remains capped in the medium term, even as the rising EMAs provide nearby dynamic support.
Momentum signals are mixed, with the Relative Strength Index (RSI) hovering around the neutral 48 area on the daily chart and the Money Flow Index (MFI) slipping into oversold territory near 29, At the same time, the Moving Average Convergence Divergence (MACD) histogram remains below zero on the same chart, hinting that downside pressure persists but could be nearing exhaustion.
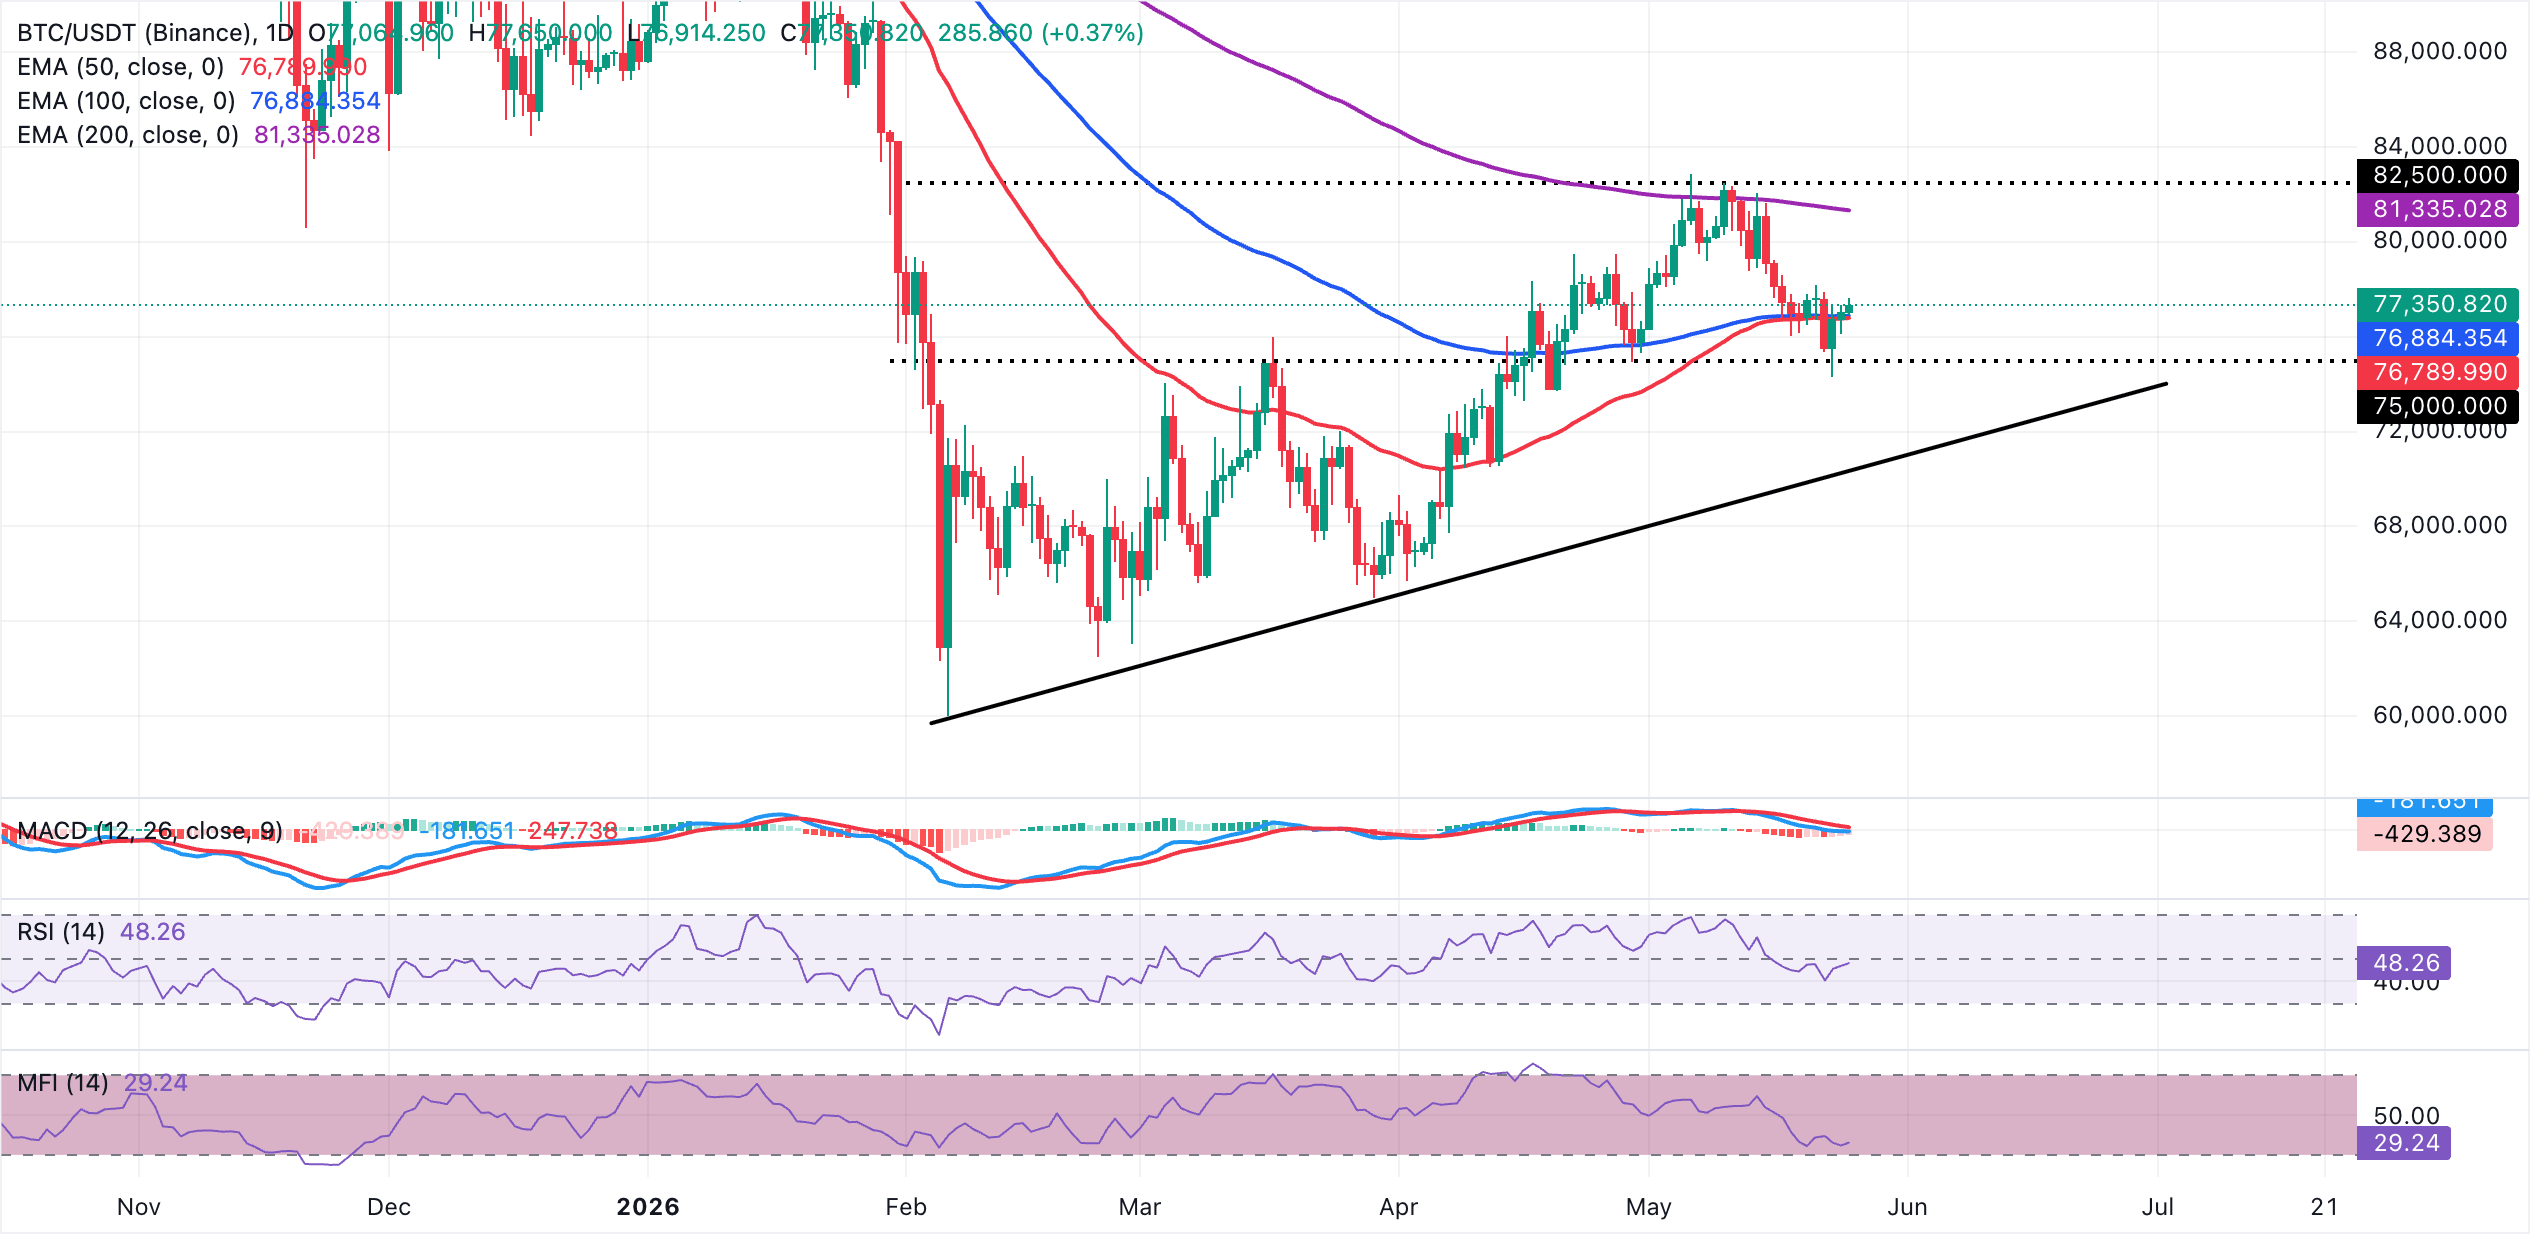
On the downside, initial support is reinforced by the 50-day EMA around $76,790 and the 100-day EMA near $76,884, with a deeper floor emerging at the ascending trendline area around $70,380 if selling accelerates. On the topside, bulls need to reclaim the 200-day EMA at $81,335 as a first key resistance to alleviate the current capped structure and open the door for a retest of the recent highs, while failure to regain that level would keep rallies vulnerable to renewed supply.
Altcoins technical outlook: Ethereum and XRP defend lifeline support
Ethereum trades at $2,114, keeping a bearish near-term bias as price holds beneath the 50-day, 100-day and 200-day EMAs clustered between roughly $2,220 and $2,520. The break back under these major EMAs leaves the pair capped despite an intact longer-term rising trendline, while the RSI hovering just below 40 on the daily chart and a negative MACD histogram hint that downside momentum still outweighs buying interest.
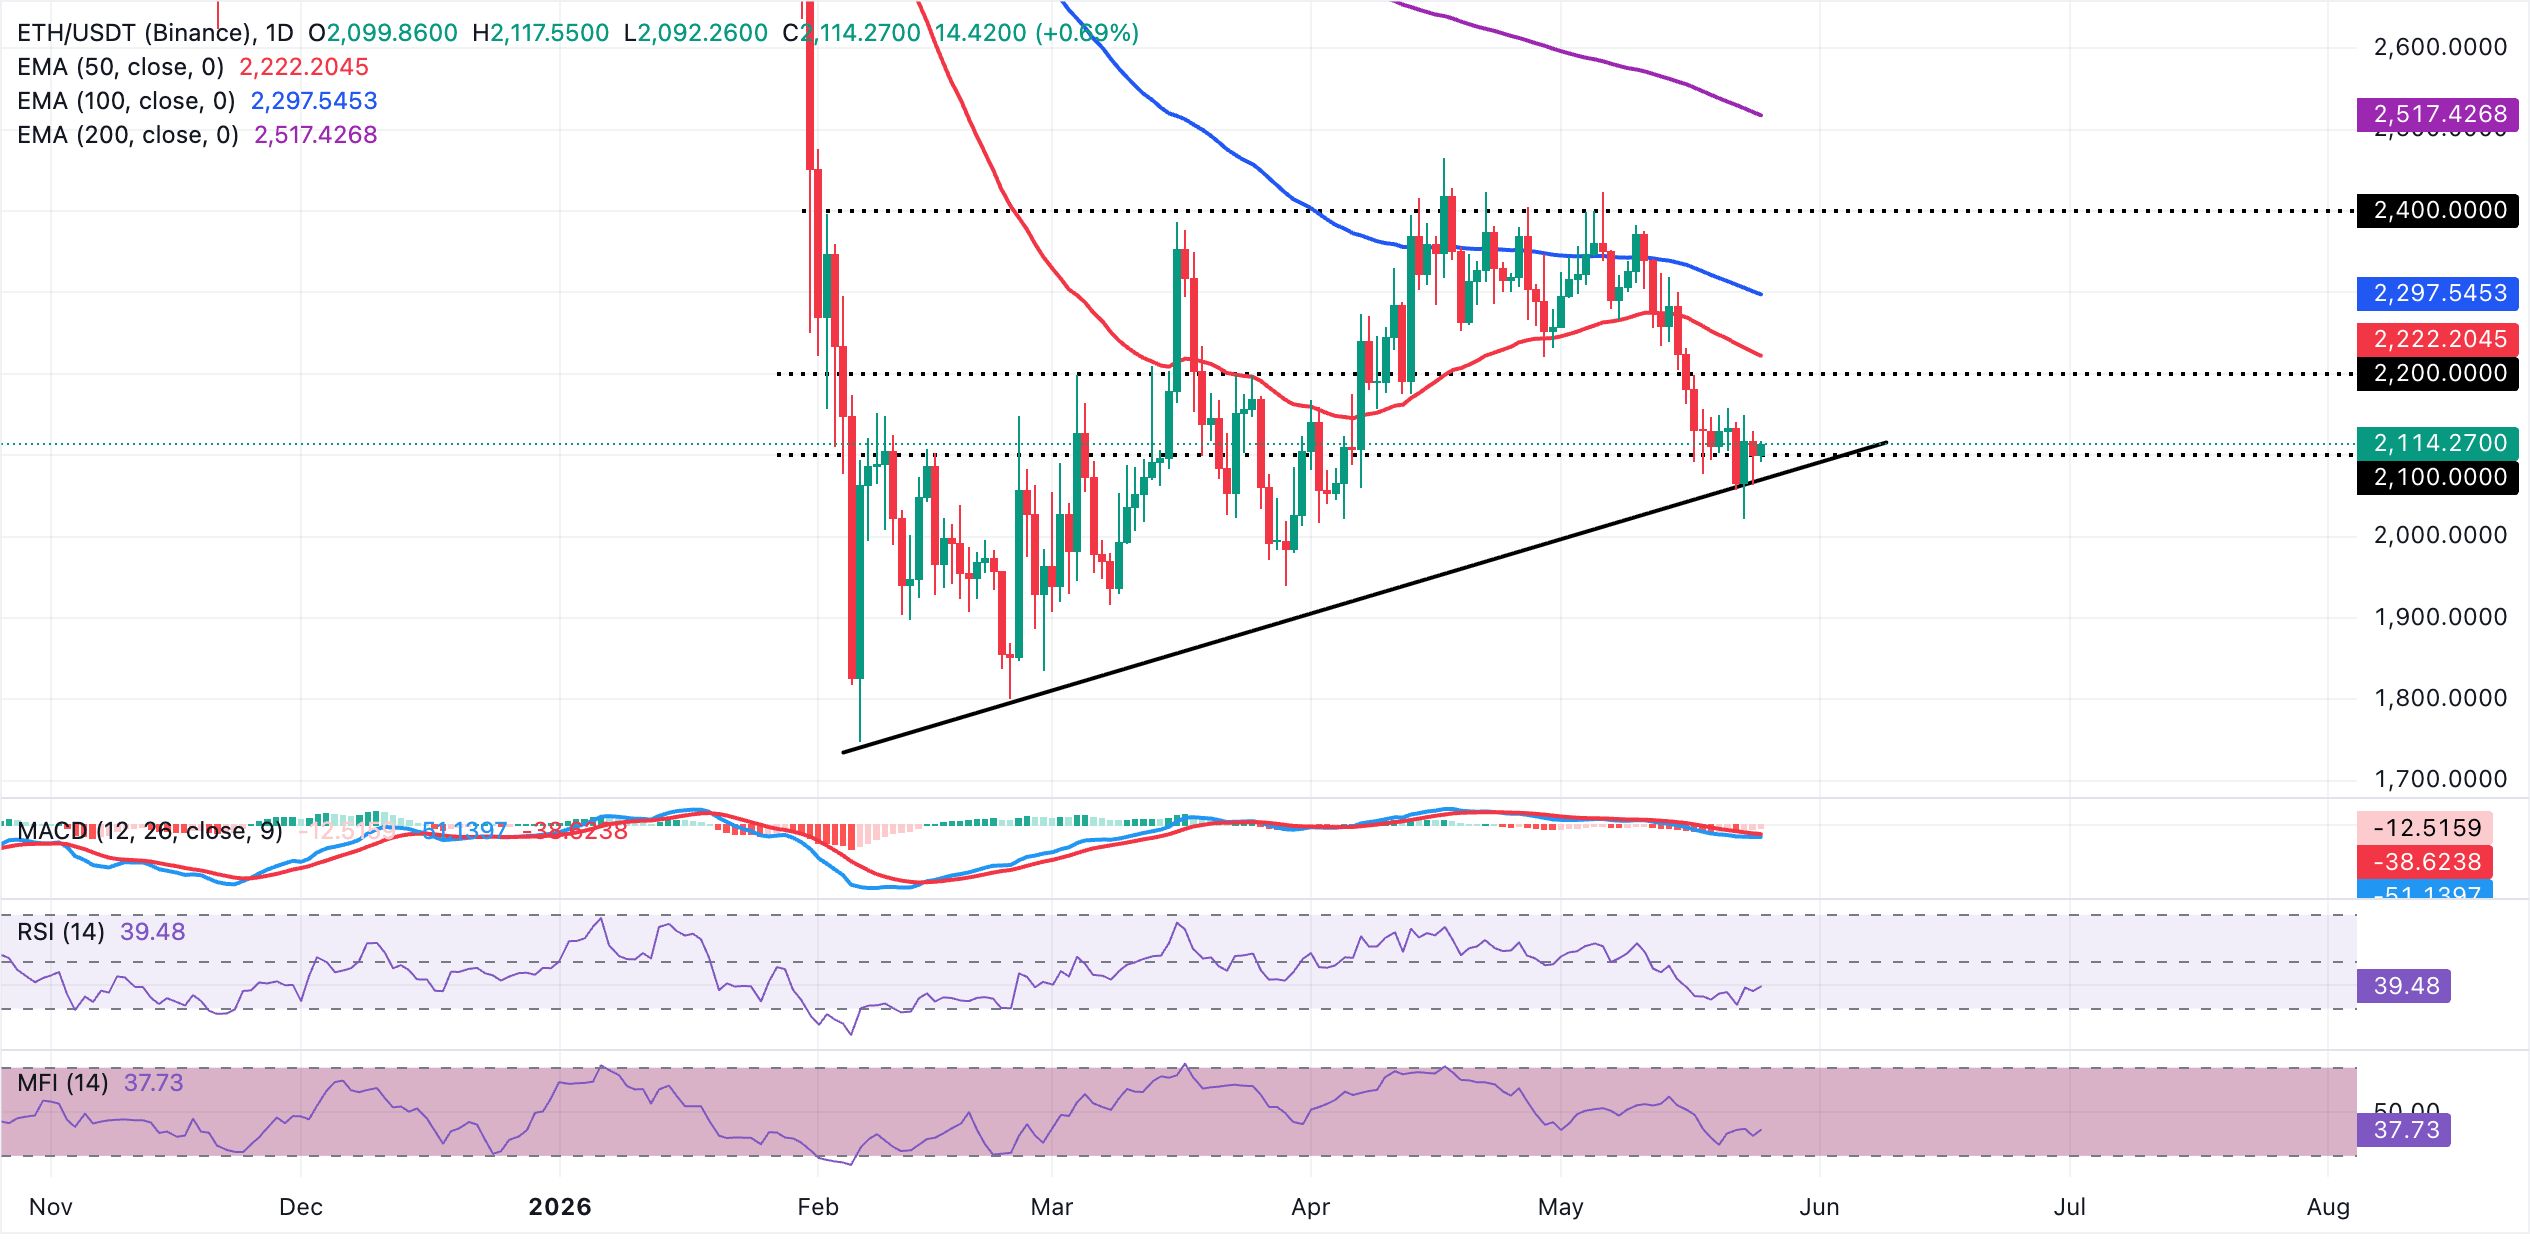
On the downside, immediate support lies near rising trendline area around $2,071, where buyers may attempt to stabilize the decline. Initial resistance emerges at the 50-day EMA at $2,222, followed by the 100-day EMA at $2,298 and then the 200-day EMA near $2,517. Notably, a sustained recovery above this EMA stack would ease the current bearish pressure.
XRP, on the other hand, trades at $1.36, keeping a bearish near-term tone as price holds beneath a dense band of moving-average and volatility resistance. The pair is capped below the 20-day Bollinger Simple Moving Average around $1.41 and the 50-day EMA near $1.40, while broader trend gauges such as the 100-day EMA at $1.47 and the 200-day EMA at $1.68 remain well overhead, suggesting rallies are likely to encounter supply.
Momentum conditions reinforce the downside bias, with the MACD histogram in negative territory and the RSI hovering below the midline, even as the MFI slips into oversold territory, hinting that selling pressure has been intense.
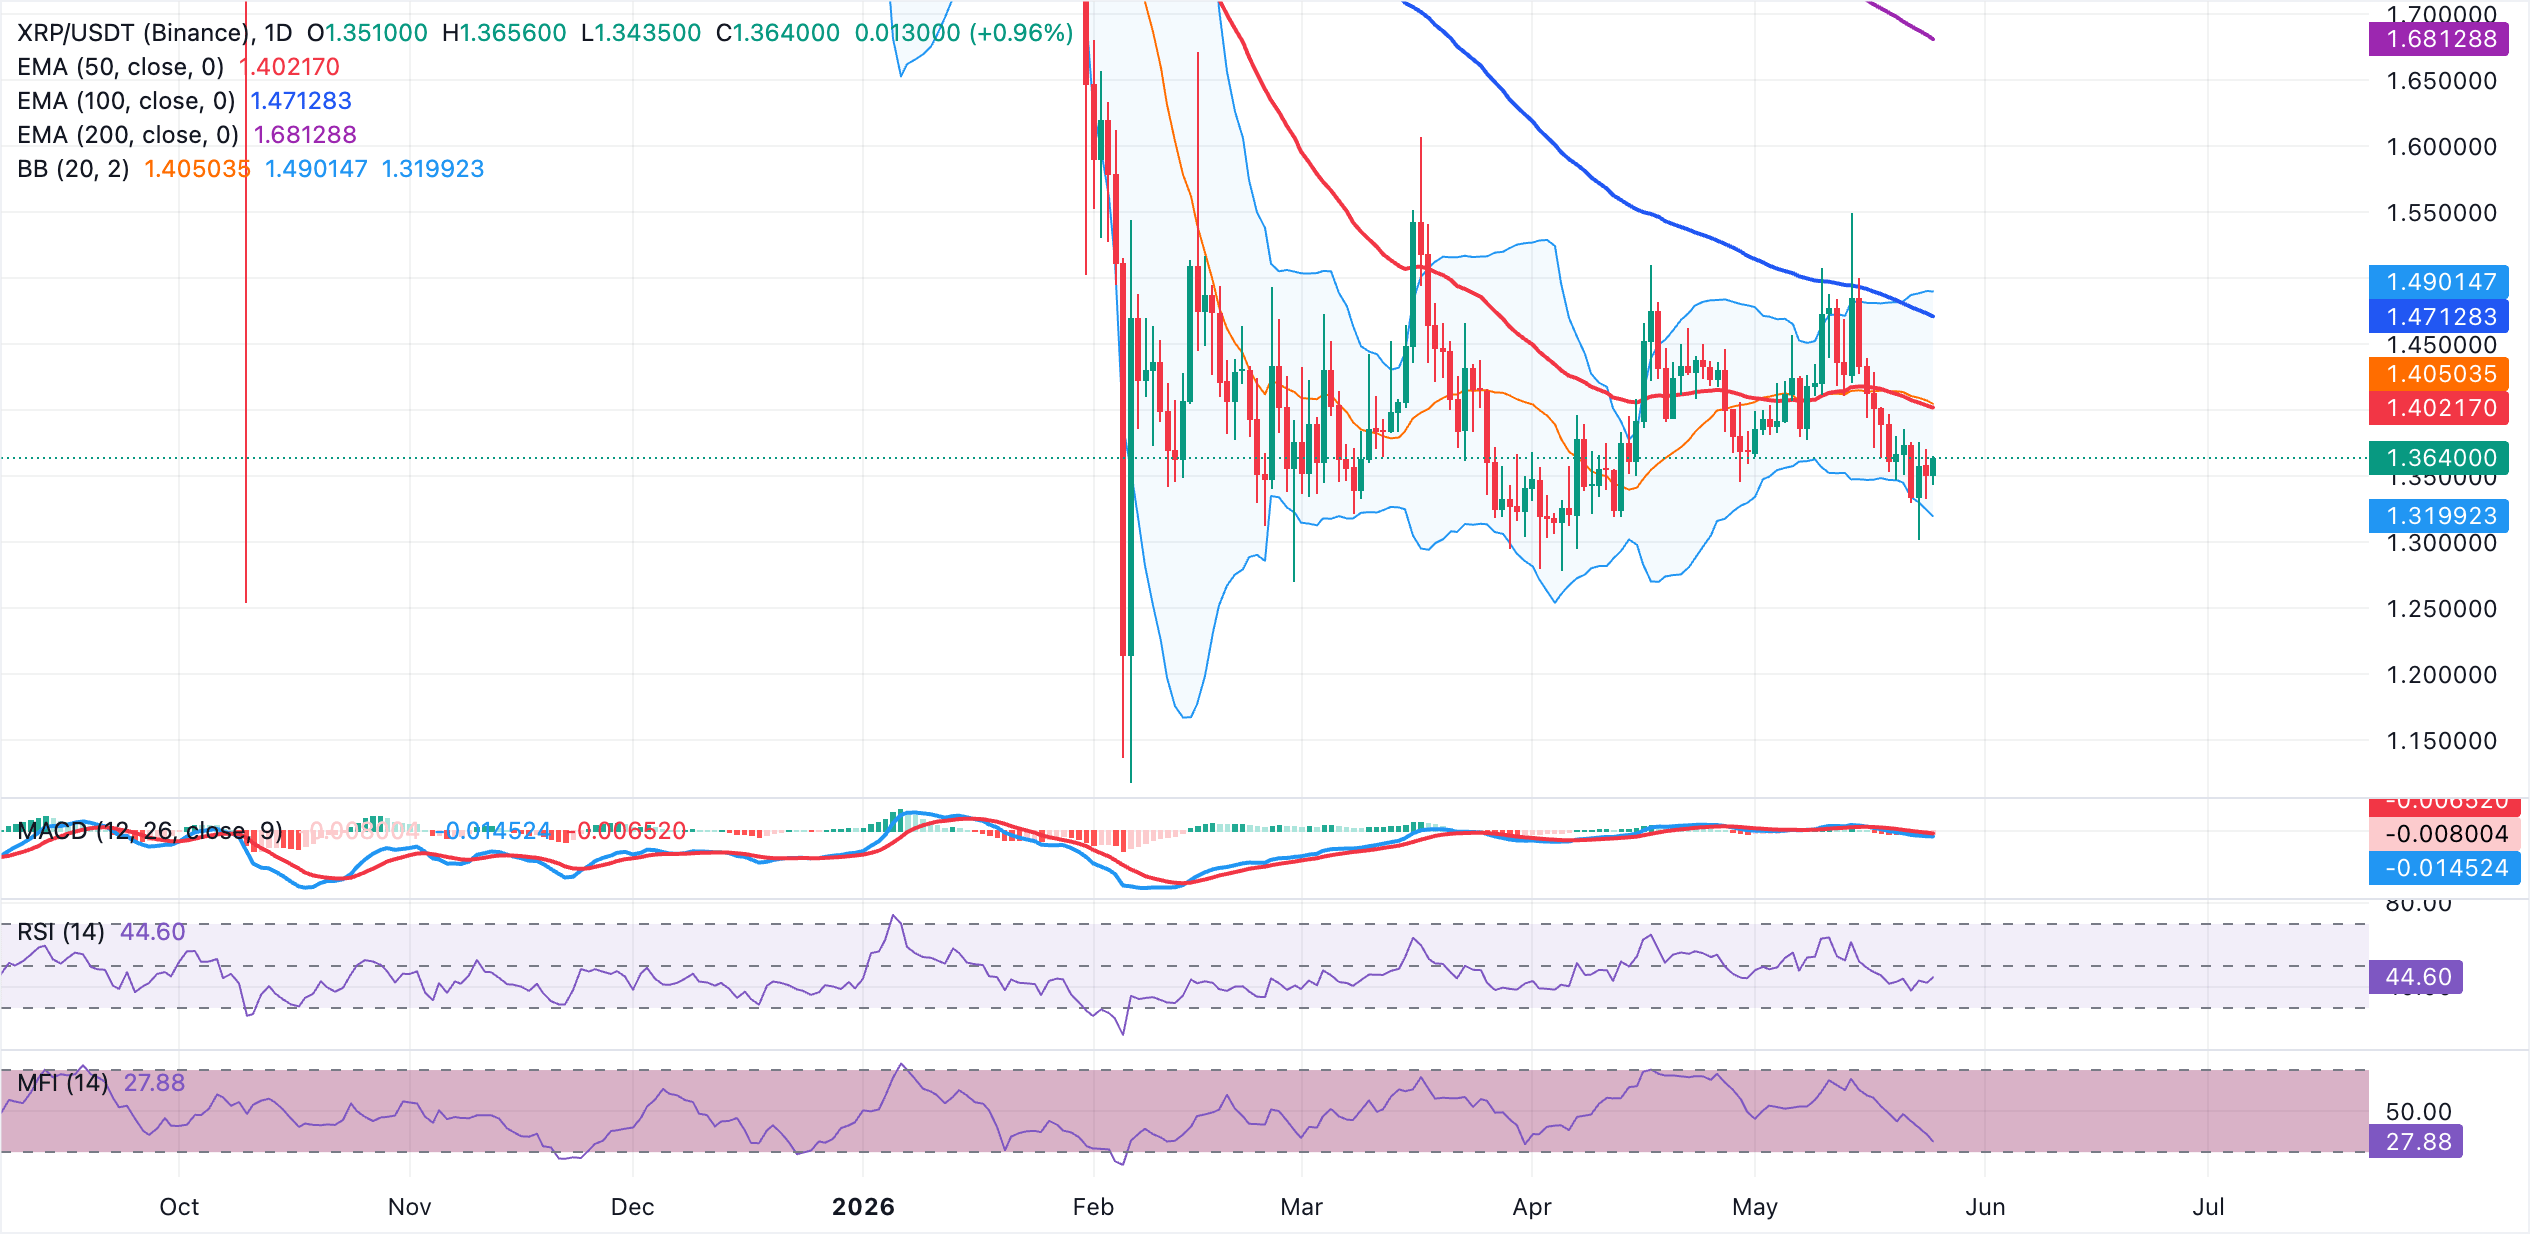
On the downside, initial support is aligned with the lower Bollinger Band, which lies around $1.32, where short-term dip-buying interest could emerge after the recent slide. On the topside, the first barrier is the clustered 20-day Bollinger midline and 50-day EMA zone near $1.40.
A sustained break above this area would ease immediate downside pressure, exposing subsequent resistance at the 100-day EMA at $1.47 and then the upper Bollinger Band near $1.49, while the 200-day EMA at $1.68 remains a distant structural cap for the broader trend.
Demand through US-listed spot Exchange-Traded Funds (ETFs) has remained steady over the last few weeks, reinforcing a subtle bullish outlook.
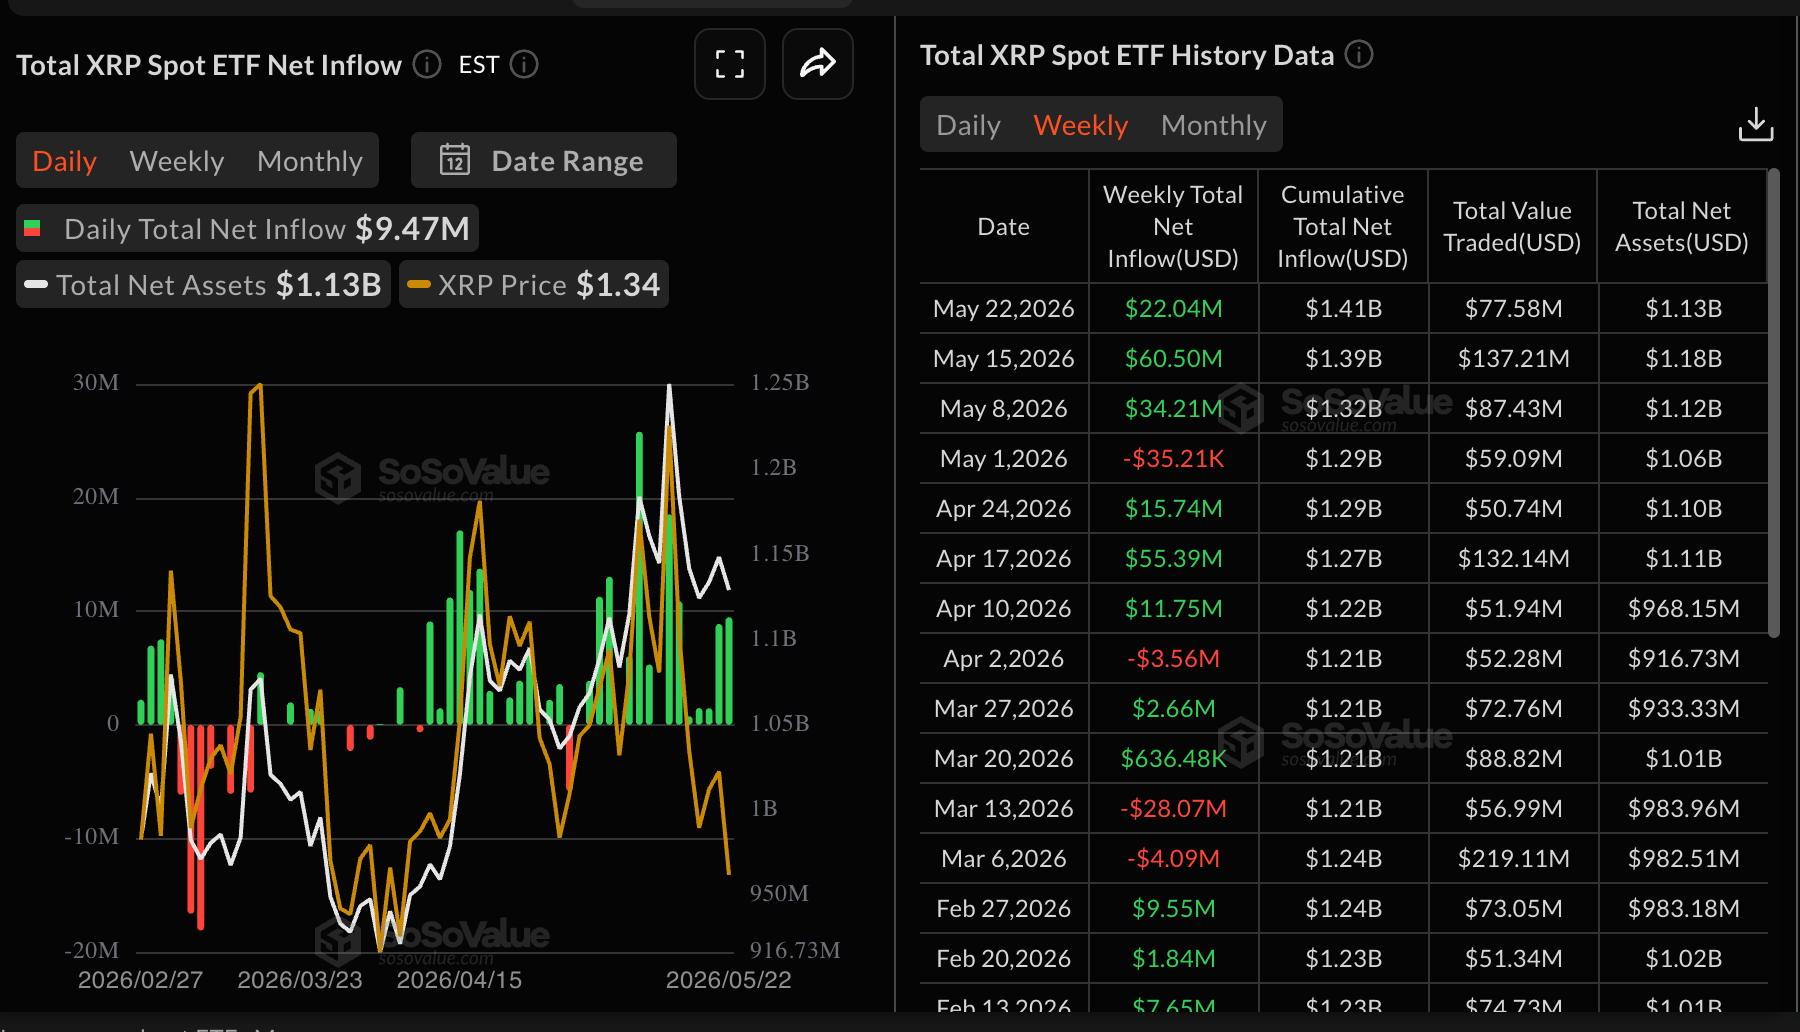
Deposits totaled $22 million last week, while cumulative inflows increased to $1.41 billion. According to SoSo Value data, total assets under management now stand at $1.13 billion.
(The technical analysis of this story was written with the help of an AI tool.)
Bitcoin, altcoins, stablecoins FAQs
Bitcoin is the largest cryptocurrency by market capitalization, a virtual currency designed to serve as money. This form of payment cannot be controlled by any one person, group, or entity, which eliminates the need for third-party participation during financial transactions.
Altcoins are any cryptocurrency apart from Bitcoin, but some also regard Ethereum as a non-altcoin because it is from these two cryptocurrencies that forking happens. If this is true, then Litecoin is the first altcoin, forked from the Bitcoin protocol and, therefore, an “improved” version of it.
Stablecoins are cryptocurrencies designed to have a stable price, with their value backed by a reserve of the asset it represents. To achieve this, the value of any one stablecoin is pegged to a commodity or financial instrument, such as the US Dollar (USD), with its supply regulated by an algorithm or demand. The main goal of stablecoins is to provide an on/off-ramp for investors willing to trade and invest in cryptocurrencies. Stablecoins also allow investors to store value since cryptocurrencies, in general, are subject to volatility.
Bitcoin dominance is the ratio of Bitcoin's market capitalization to the total market capitalization of all cryptocurrencies combined. It provides a clear picture of Bitcoin’s interest among investors. A high BTC dominance typically happens before and during a bull run, in which investors resort to investing in relatively stable and high market capitalization cryptocurrency like Bitcoin. A drop in BTC dominance usually means that investors are moving their capital and/or profits to altcoins in a quest for higher returns, which usually triggers an explosion of altcoin rallies.
Bài viết đề xuất


