

Hyperliquid Price Forecast: Institutional demand, buybacks fuel the HYPE

Nguồn Fxstreet
  • Hyperliquid hovers above $60 on Monday after a 7% jump the previous day, hitting a record high of $64.48.
  • Institutional demand for the DEX token is scaling up, with $72 million in inflows last week.
  • Buybacks and steady retail demand support the price discovery rally.

Hyperliquid (HYPE) is trading at an all-time high level at press time on Monday, driven by institutional and retail demand for the Decentralized Exchange (DEX). The revenue-linked HYPE token buyback supports the rally into a price discovery mode. The technical outlook is bullish, projecting a potential rise toward $80.

Bullish factors are fueling HYPE

Hyperliquid's rally amid volatile market conditions is linked to its emergence as an everything exchange platform, offering crypto, real-world commodities, and a prediction market. 

Data shows the launch of HYPE-focused ETFs by 21Shares and Bitwise recorded $72.38 million in inflows last week, building on the $2.52 million in inflows the previous week. Typically, a surge in institutional activity boosts retail demand and spot price.
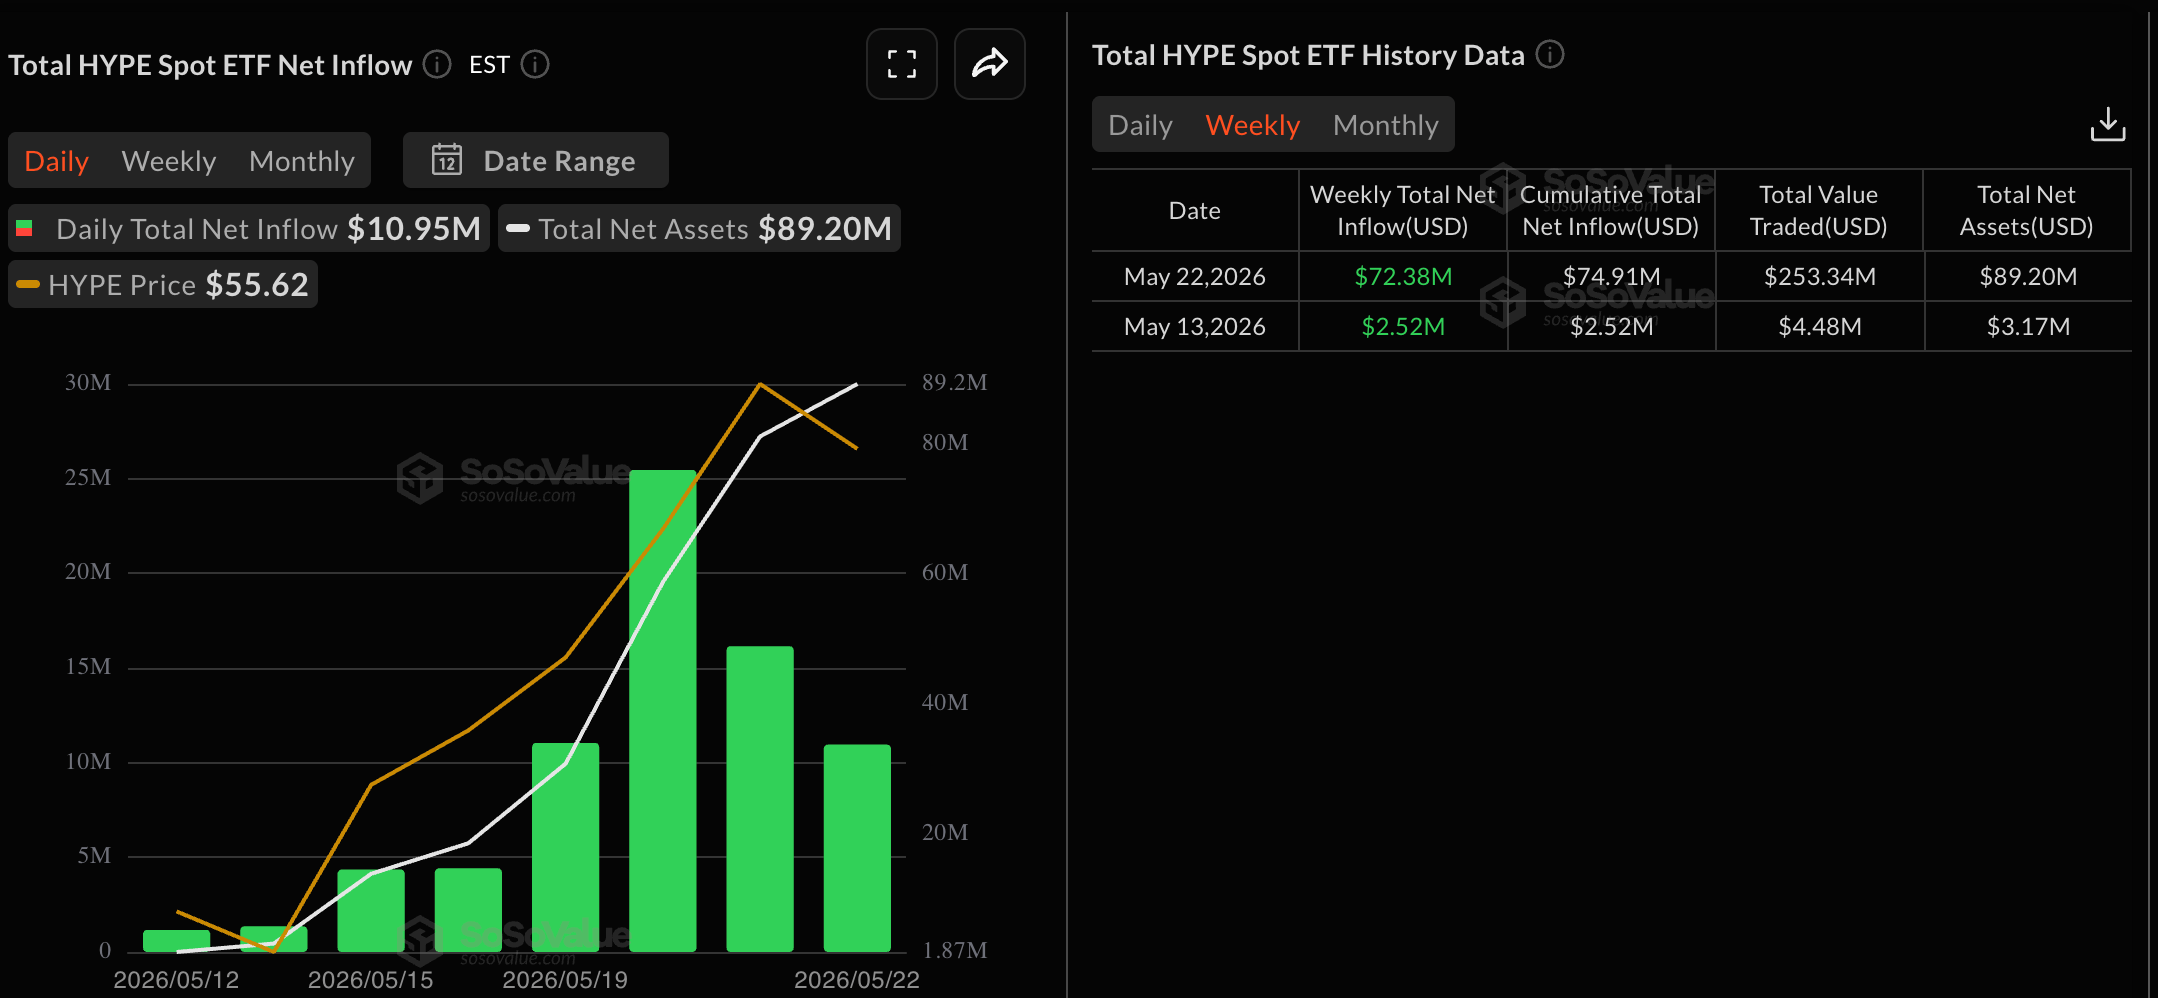
HYPE ETFs data. Source: Sosovalue

CoinGlass data confirms a rise in retail activity, with HYPE futures Open Interest (OI) hitting a record high of $2.95 billion on Monday, indicating a positional buildup driving the notional value of outstanding contracts to unprecedented levels. 
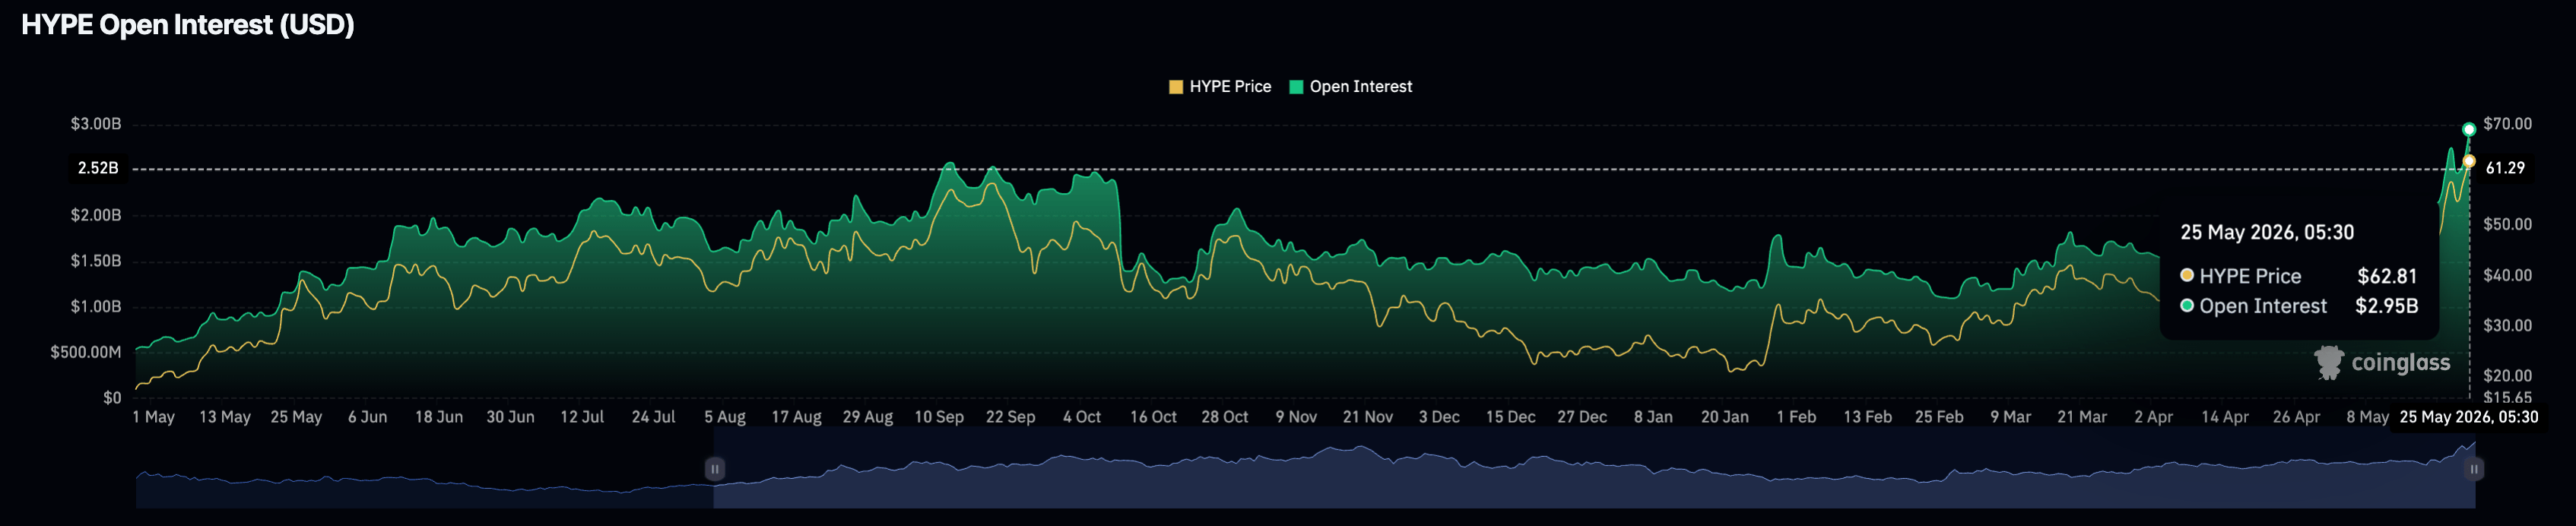
HYPE Open Interest chart. Source: CoinGlass

On the other hand, Hyperliquid redirects 97% to 99% of its trading fees to buy back HYPE tokens, locked in its assistance fund. Hyperscreener data shows roughly 210,000 HYPE tokens were bought back last week, effectively removing them from circulation. The assistance fund holds 44.52 million HYPE tokens, including the total buyback of 26.81 million HYPE.
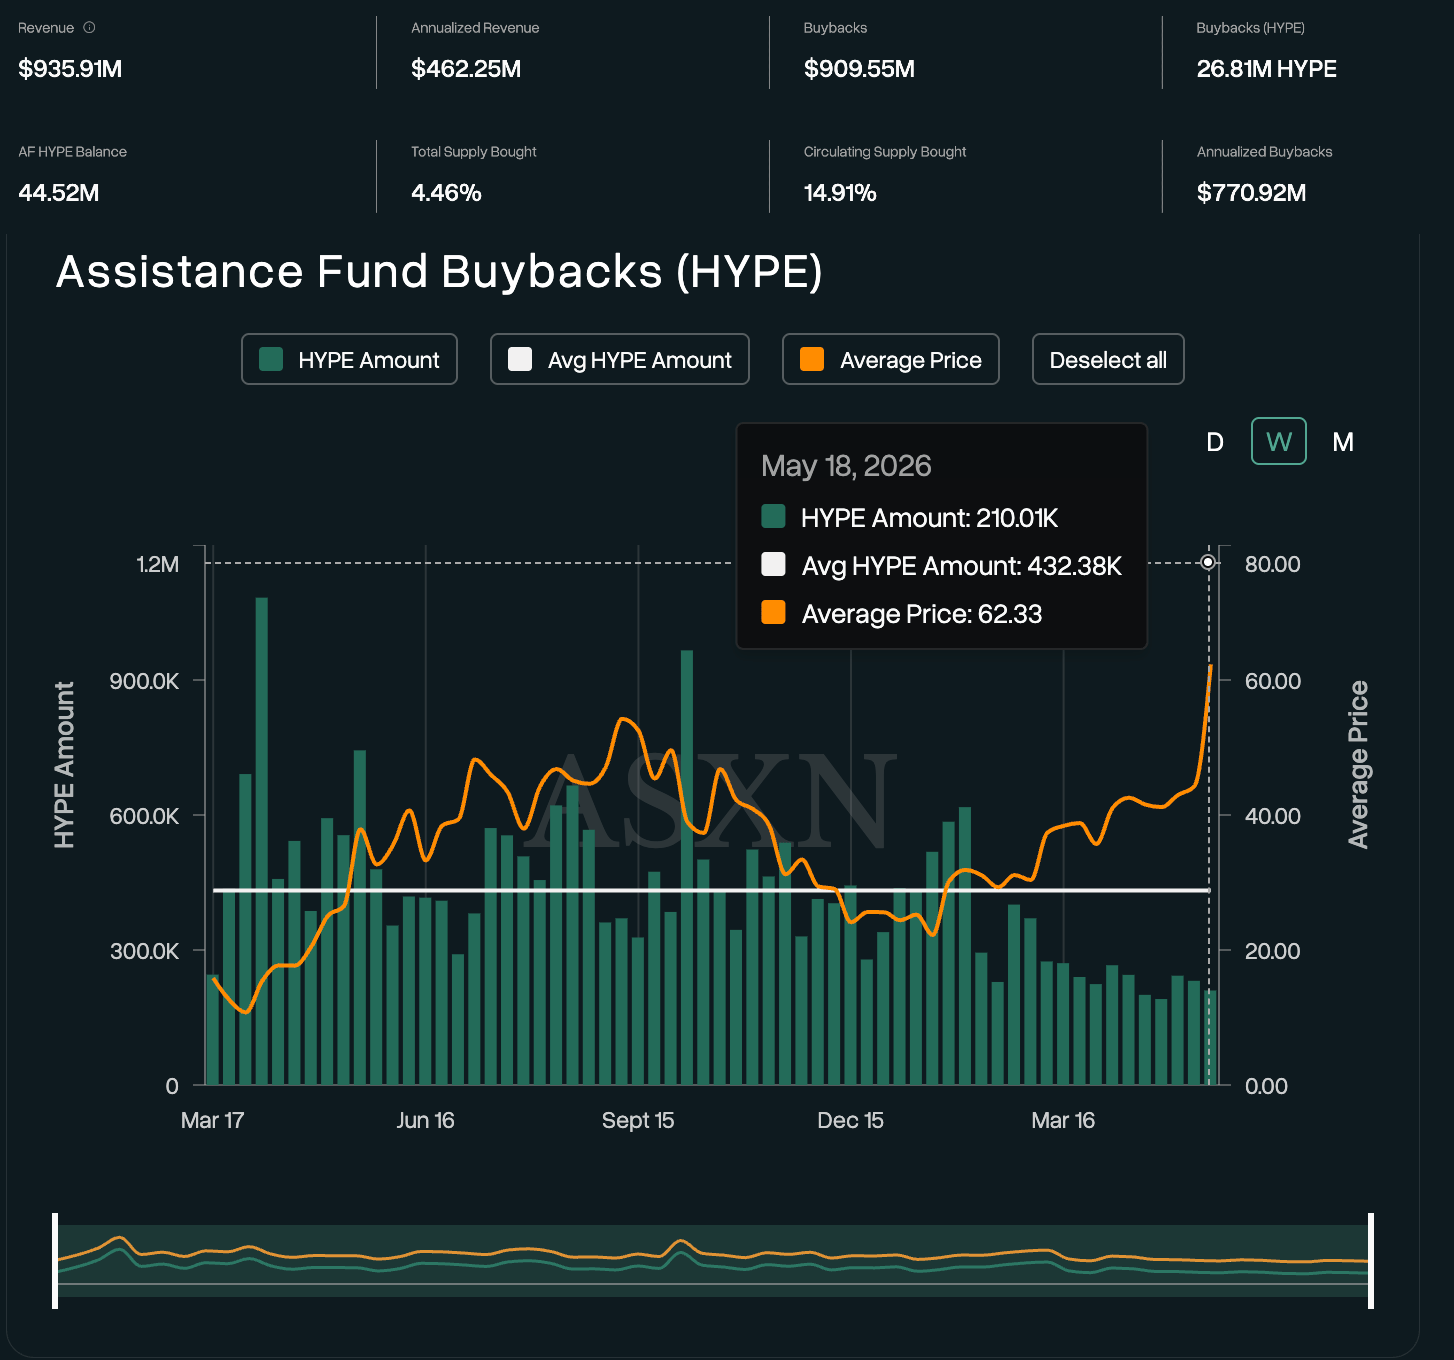
Hyperliquid buyback data. Source: Hyperscreener.

Will Hyperliquid price hit $80?

Hyperliquid is trading at an all-time high, extending a strong bullish phase above the 50- and 100-day Exponential Moving Averages (EMAs) at $45.07 and $40.98, as well as the 200-day EMA at $37.87. The pair has decisively broken above its previous swing high of $59.45, with a 7% rise on Sunday.

The Relative Strength Index (RSI) at 75 on the daily chart suggests overbought conditions, while the positive Moving Average Convergence Divergence (MACD) and its signal line scale up, hinting at a firm upside momentum in the near-term.

Hyperliquid's next key resistances align with the 127.2% and 161.8% Fibonacci extension levels at $70.04 and $83.51, respectively.
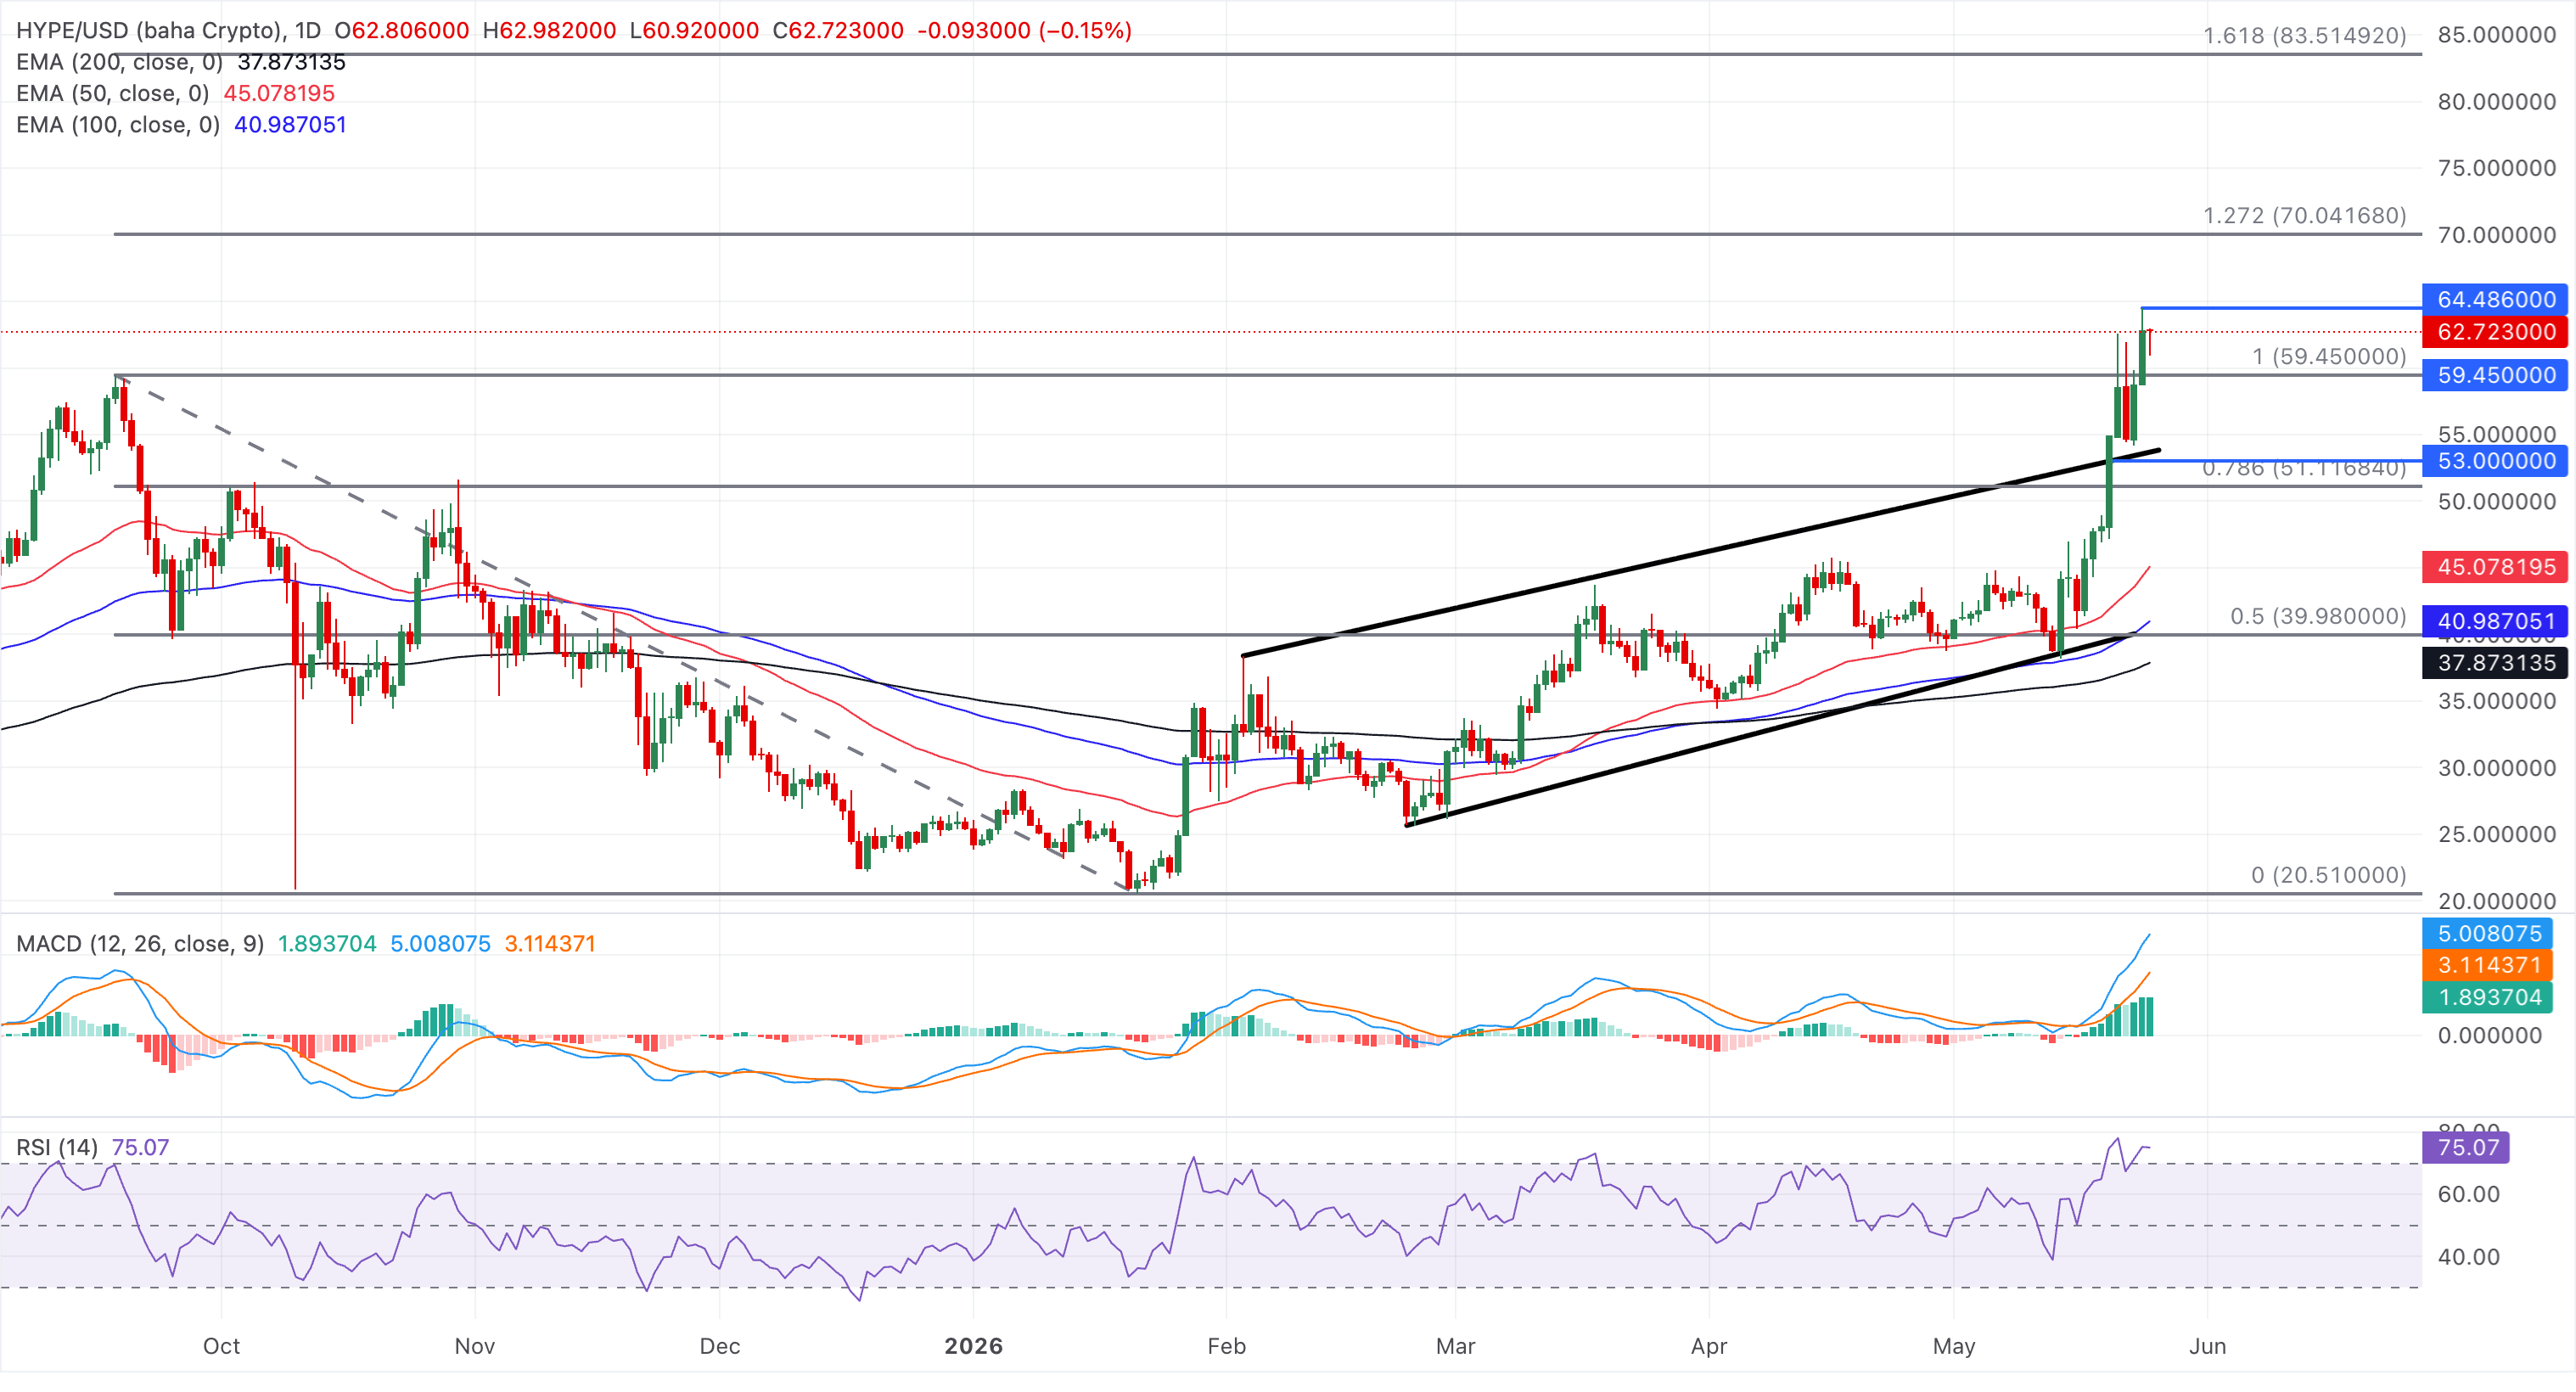
HYPE/USD daily price chart.

Looking down, the resistance-turned-support level at $59.45 acts as the immediate line of defense, followed by the $50.00 psychological level, which could serve as a secondary floor if a deeper pullback unfolds.

(The technical analysis of this story was written with the help of an AI tool.)

Tuyên bố miễn trừ trách nhiệm: Chỉ dành cho mục đích thông tin. Hiệu suất trong quá khứ không đảm bảo cho kết quả trong tương lai.
placeholder
Nhìn lại lịch sử giá vàng trong 50 năm qua. Liệu vàng còn tiếp tục thời kỳ hoàng kim thêm 50 năm nữa? Trong 50 năm qua, vàng vẫn luôn giữ được vị thế là tài sản được ưa chuộng và phổ biến nhất thế giới. Giao dịch vàng luôn được các nhà đầu tư quan tâm do mức độ thanh khoản cao và tầm ảnh hưởng lớn đến toàn bộ thị trường tài chính. Vậy, lịch sử giá vàng như thế nào và cách đầu tư vàng ra sao? Chúng ta sẽ cùng tìm hiểu qua bài viết dưới đây.
Tác giả  Nhóm Traderins
ngày11 tháng 12 năm 2023
Trong 50 năm qua, vàng vẫn luôn giữ được vị thế là tài sản được ưa chuộng và phổ biến nhất thế giới. Giao dịch vàng luôn được các nhà đầu tư quan tâm do mức độ thanh khoản cao và tầm ảnh hưởng lớn đến toàn bộ thị trường tài chính. Vậy, lịch sử giá vàng như thế nào và cách đầu tư vàng ra sao? Chúng ta sẽ cùng tìm hiểu qua bài viết dưới đây.
placeholder
Top 3 Price Prediction: BTC breakdown hints at deeper correction as ETH and XRP extend lossesBitcoin (BTC), Ethereum (ETH) and Ripple (XRP) prices are extending losses on Monday after falling slightly the previous week. BTC is slipping below the lower consolidation range at $65,000, and ETH is falling below $1,900, both extending their six-week losing streaks.
Tác giả  FXStreet
2 tháng 23 ngày Thứ Hai
Bitcoin (BTC), Ethereum (ETH) and Ripple (XRP) prices are extending losses on Monday after falling slightly the previous week. BTC is slipping below the lower consolidation range at $65,000, and ETH is falling below $1,900, both extending their six-week losing streaks.
placeholder
Đô la Úc giảm gần về 0,7250, cuộc đàm phán Trump–Tập được chú ýCặp AUD/USD mất điểm gần 0,7250 trong giờ giao dịch châu Á vào thứ Năm. Dữ liệu lạm phát của Mỹ nóng hơn dự kiến cung cấp một số hỗ trợ cho đồng đô la Mỹ (USD) so với đồng đô la Úc (AUD)
Tác giả  FXStreet
5 tháng 14 ngày Thứ Năm
Cặp AUD/USD mất điểm gần 0,7250 trong giờ giao dịch châu Á vào thứ Năm. Dữ liệu lạm phát của Mỹ nóng hơn dự kiến cung cấp một số hỗ trợ cho đồng đô la Mỹ (USD) so với đồng đô la Úc (AUD)
placeholder
Dự báo giá bạc: Phe đầu cơ giá lên XAG/USD nhắm mục tiêu vượt qua ngưỡng kháng cự hội tụ 76,75$Bạc (XAG/USD) được cho là đang hình thành dựa trên đà phục hồi của ngày trước đó từ vùng gần mức thấp nhất trong gần hai tuần, khoảng khu vực 73,00$, và đạt được lực kéo tích cực trong ngày thứ hai liên tiếp vào thứ Năm
Tác giả  FXStreet
5 tháng 21 ngày Thứ Năm
Bạc (XAG/USD) được cho là đang hình thành dựa trên đà phục hồi của ngày trước đó từ vùng gần mức thấp nhất trong gần hai tuần, khoảng khu vực 73,00$, và đạt được lực kéo tích cực trong ngày thứ hai liên tiếp vào thứ Năm
placeholder
Dự báo giá bạc: XAG/USD giữ đà tăng gần mức 78,50$ nhờ lạc quan về thỏa thuận Mỹ-IranGiá bạc (XAG/USD) tăng gần 4% sau khi ghi nhận mức lỗ vào ngày trước đó, giao dịch quanh mức 78,50$/ounce troy trong phiên giao dịch châu Á vào thứ Hai
Tác giả  FXStreet
4 giờ trước
Giá bạc (XAG/USD) tăng gần 4% sau khi ghi nhận mức lỗ vào ngày trước đó, giao dịch quanh mức 78,50$/ounce troy trong phiên giao dịch châu Á vào thứ Hai
goTop
quote