

Dogecoin, Shiba Inu and Pepe slide as meme coin correction gathers pace

Nguồn Fxstreet
  • Dogecoin trades in red on Monday after falling over 6% in the previous week.
  • Shiba Inu closes below the lower boundary of its consolidation range around $0.000056, signaling a deeper correction.
  • Pepe slips near the daily support at $0.0000035, a firm close below suggests further losses.

Meme coins remain under pressure on Monday as Dogecoin (DOGE), Shiba Inu (SHIB) and Pepe (PEPE) struggle after losing over 6%, 2% and 2.5% in the previous week. DOGE and SHIB slip below their key support zone. Meanwhile, PEPE edges toward the support zone, where a close below would suggest a deeper correction.

Dogecoin faces rejection from key resistance zones

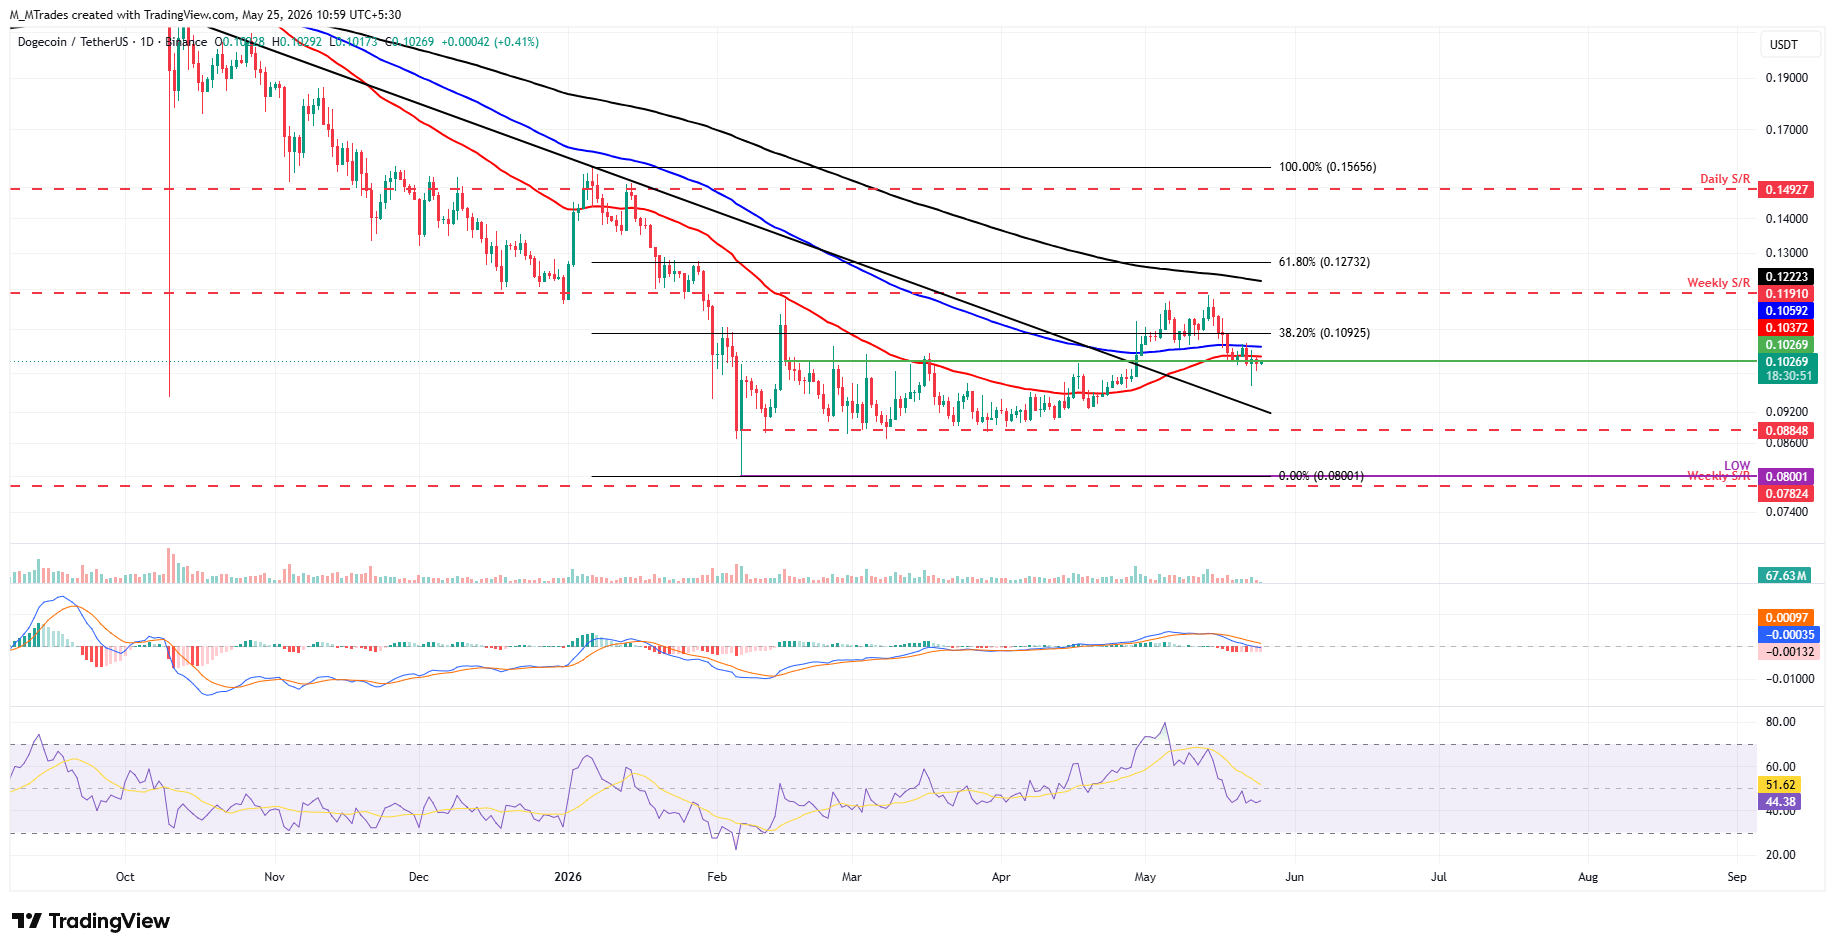
Dogecoin’s price failed to close above the key 100-day Exponential Moving Average (EMA) at $0.105 on Thursday and declined by over 3% the next day. DOGE closed below the 50-day EMA at $0.103 and struggled below it during the week. At the time of writing on Monday, DOGE trades below this resistance at $0.102.

If DOGE continues to correct, it could extend the losses toward the key psychological level at $0.100.

The Relative Strength Index (RSI) on the daily chart reads 44, below the neutral level of 50, indicating bearish momentum gaining traction. The Moving Average Convergence Divergence (MACD) also showed a bearish crossover on May 16, which remains intact, supporting the bearish outlook.
DOGE/USDT daily chart

However, if DOGE recovers, it could extend the advance toward the 100-day EMA at $0.105.

Shiba Inu closes below the lower consolidation boundary

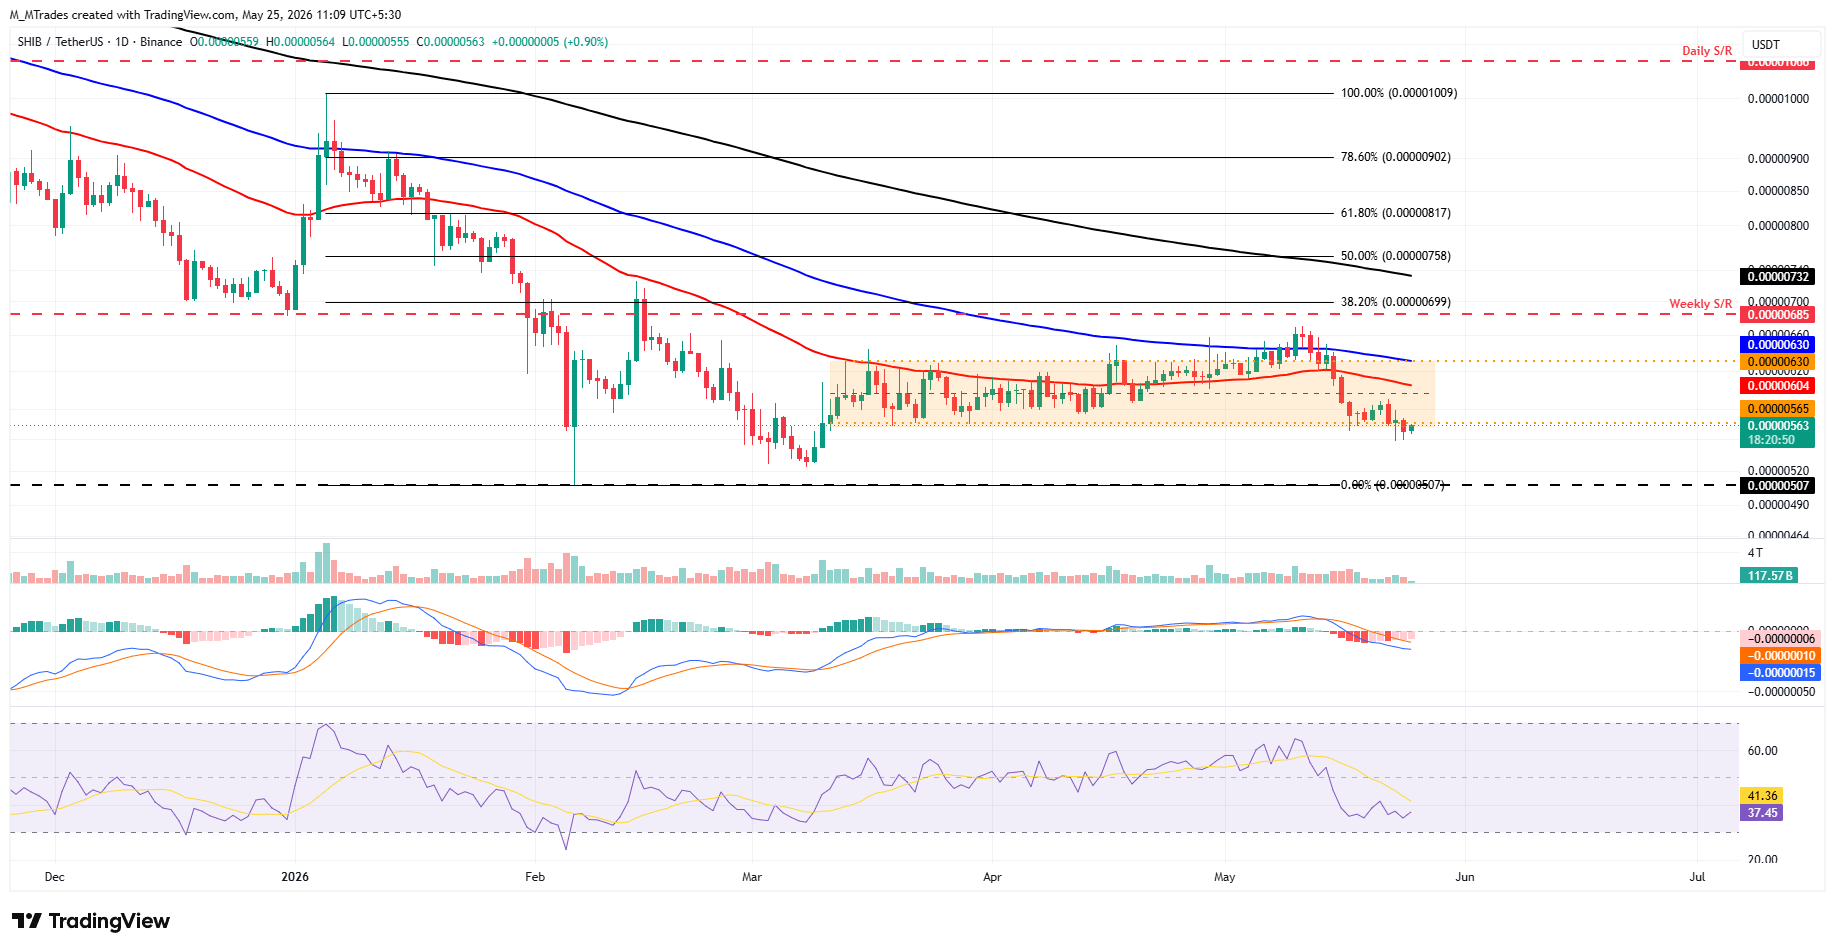
Shiba Inu corrected over 2% and closed below the lower boundary of the consolidation range at $0.0000056 in the previous week. At the time of writing on Monday, SHIB is retesting this previously broken zone.

If SHIB faces rejection at $0.0000056, it could extend losses toward the February 6 low at $0.0000050.

Like Dogecoin, SHIB’s momentum indicators, RSI and MACD, show bearish momentum gaining traction.
SHIB/USDT daily chart

On the other hand, if SHIB recovers, it could extend the advance toward the 50-day EMA at $0.0000060.

Pepe could extend losses if it closes below key support

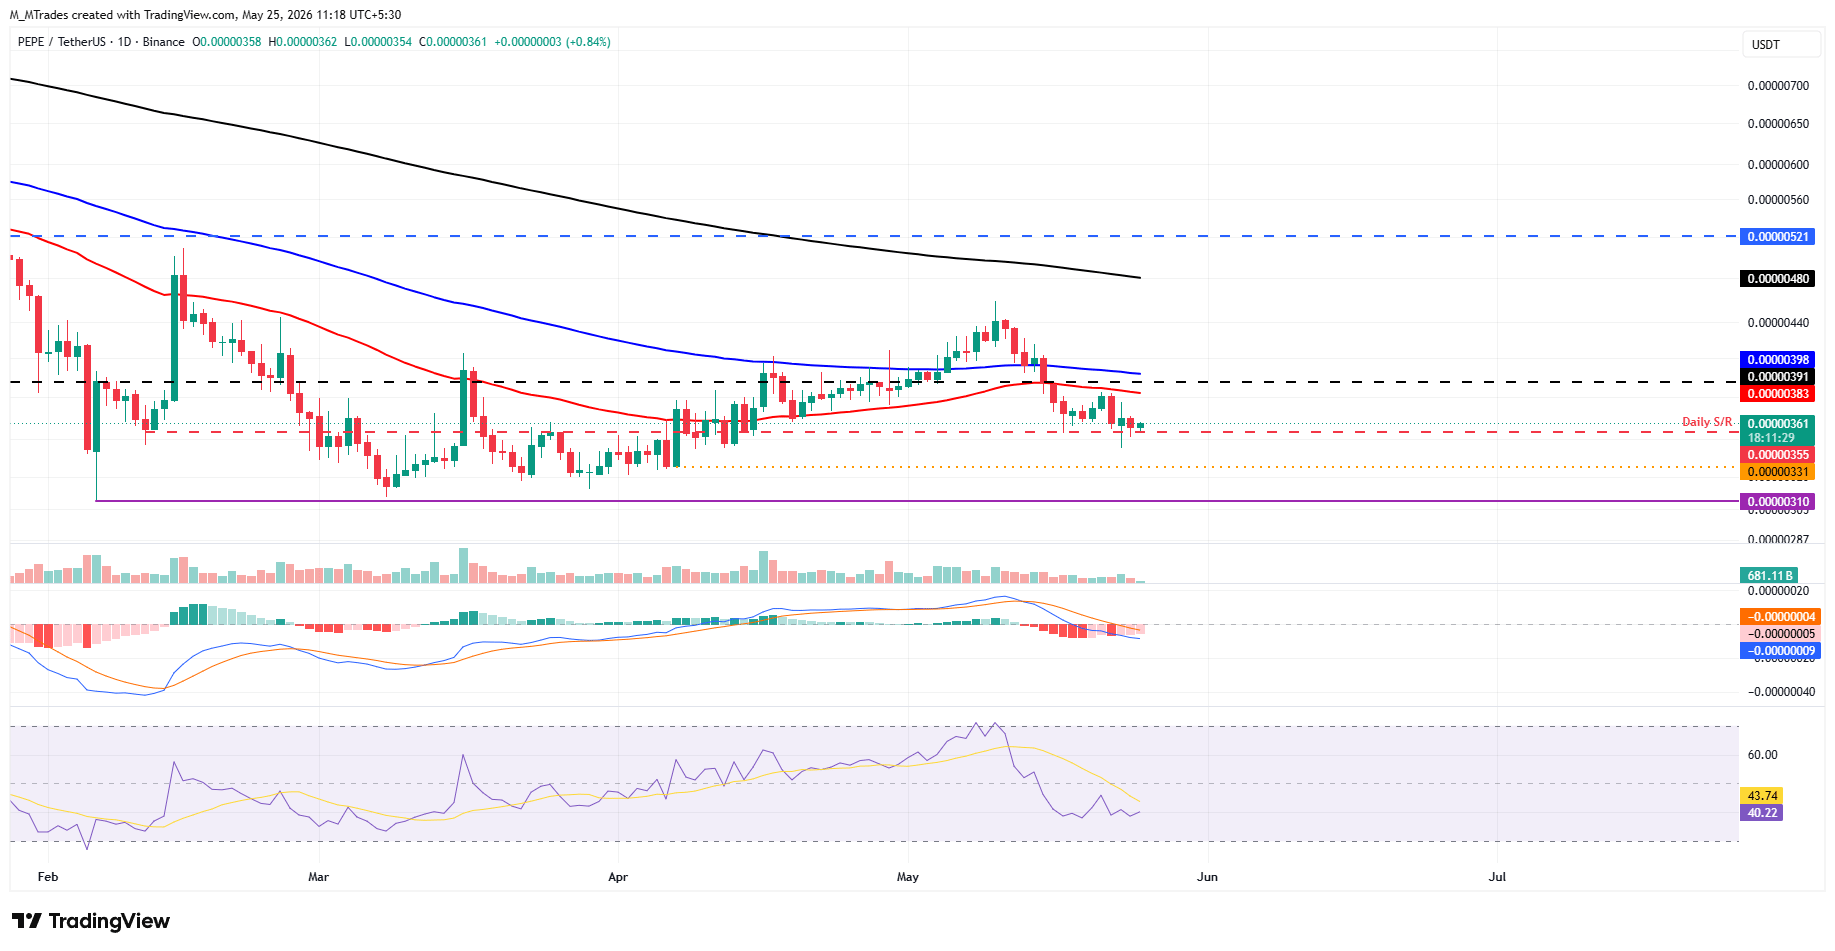
Pepe price corrected over 2.7% last week and retested the daily support at $0.0000036 on Monday.

If PEPE closes below the daily support at $0.0000036, it could extend the losses toward the April 7 low at $0.0000033.

Like Dogecoin and Shiba Inu, Pepe’s momentum indicators, RSI and MACD, also support a negative outlook.
PEPE/USDT daily chart

If PEPE recovers, it could extend the recovery toward the 50-day EMA at $0.0000038.

Tuyên bố miễn trừ trách nhiệm: Chỉ dành cho mục đích thông tin. Hiệu suất trong quá khứ không đảm bảo cho kết quả trong tương lai.
placeholder
Nhìn lại lịch sử giá vàng trong 50 năm qua. Liệu vàng còn tiếp tục thời kỳ hoàng kim thêm 50 năm nữa? Trong 50 năm qua, vàng vẫn luôn giữ được vị thế là tài sản được ưa chuộng và phổ biến nhất thế giới. Giao dịch vàng luôn được các nhà đầu tư quan tâm do mức độ thanh khoản cao và tầm ảnh hưởng lớn đến toàn bộ thị trường tài chính. Vậy, lịch sử giá vàng như thế nào và cách đầu tư vàng ra sao? Chúng ta sẽ cùng tìm hiểu qua bài viết dưới đây.
Tác giả  Nhóm Traderins
ngày11 tháng 12 năm 2023
Trong 50 năm qua, vàng vẫn luôn giữ được vị thế là tài sản được ưa chuộng và phổ biến nhất thế giới. Giao dịch vàng luôn được các nhà đầu tư quan tâm do mức độ thanh khoản cao và tầm ảnh hưởng lớn đến toàn bộ thị trường tài chính. Vậy, lịch sử giá vàng như thế nào và cách đầu tư vàng ra sao? Chúng ta sẽ cùng tìm hiểu qua bài viết dưới đây.
placeholder
Top 3 Price Prediction: BTC breakdown hints at deeper correction as ETH and XRP extend lossesBitcoin (BTC), Ethereum (ETH) and Ripple (XRP) prices are extending losses on Monday after falling slightly the previous week. BTC is slipping below the lower consolidation range at $65,000, and ETH is falling below $1,900, both extending their six-week losing streaks.
Tác giả  FXStreet
2 tháng 23 ngày Thứ Hai
Bitcoin (BTC), Ethereum (ETH) and Ripple (XRP) prices are extending losses on Monday after falling slightly the previous week. BTC is slipping below the lower consolidation range at $65,000, and ETH is falling below $1,900, both extending their six-week losing streaks.
placeholder
Đô la Úc giảm gần về 0,7250, cuộc đàm phán Trump–Tập được chú ýCặp AUD/USD mất điểm gần 0,7250 trong giờ giao dịch châu Á vào thứ Năm. Dữ liệu lạm phát của Mỹ nóng hơn dự kiến cung cấp một số hỗ trợ cho đồng đô la Mỹ (USD) so với đồng đô la Úc (AUD)
Tác giả  FXStreet
5 tháng 14 ngày Thứ Năm
Cặp AUD/USD mất điểm gần 0,7250 trong giờ giao dịch châu Á vào thứ Năm. Dữ liệu lạm phát của Mỹ nóng hơn dự kiến cung cấp một số hỗ trợ cho đồng đô la Mỹ (USD) so với đồng đô la Úc (AUD)
placeholder
Dự báo giá bạc: Phe đầu cơ giá lên XAG/USD nhắm mục tiêu vượt qua ngưỡng kháng cự hội tụ 76,75$Bạc (XAG/USD) được cho là đang hình thành dựa trên đà phục hồi của ngày trước đó từ vùng gần mức thấp nhất trong gần hai tuần, khoảng khu vực 73,00$, và đạt được lực kéo tích cực trong ngày thứ hai liên tiếp vào thứ Năm
Tác giả  FXStreet
5 tháng 21 ngày Thứ Năm
Bạc (XAG/USD) được cho là đang hình thành dựa trên đà phục hồi của ngày trước đó từ vùng gần mức thấp nhất trong gần hai tuần, khoảng khu vực 73,00$, và đạt được lực kéo tích cực trong ngày thứ hai liên tiếp vào thứ Năm
placeholder
Dự báo giá bạc: XAG/USD giữ đà tăng gần mức 78,50$ nhờ lạc quan về thỏa thuận Mỹ-IranGiá bạc (XAG/USD) tăng gần 4% sau khi ghi nhận mức lỗ vào ngày trước đó, giao dịch quanh mức 78,50$/ounce troy trong phiên giao dịch châu Á vào thứ Hai
Tác giả  FXStreet
4 giờ trước
Giá bạc (XAG/USD) tăng gần 4% sau khi ghi nhận mức lỗ vào ngày trước đó, giao dịch quanh mức 78,50$/ounce troy trong phiên giao dịch châu Á vào thứ Hai
sản phẩm liên quan
goTop
quote