


Ripple Price Forecast: Three indicators that could define XRP’s next move
- XRP posts modest gains but remains below $1.90 as bulls push to regain control.
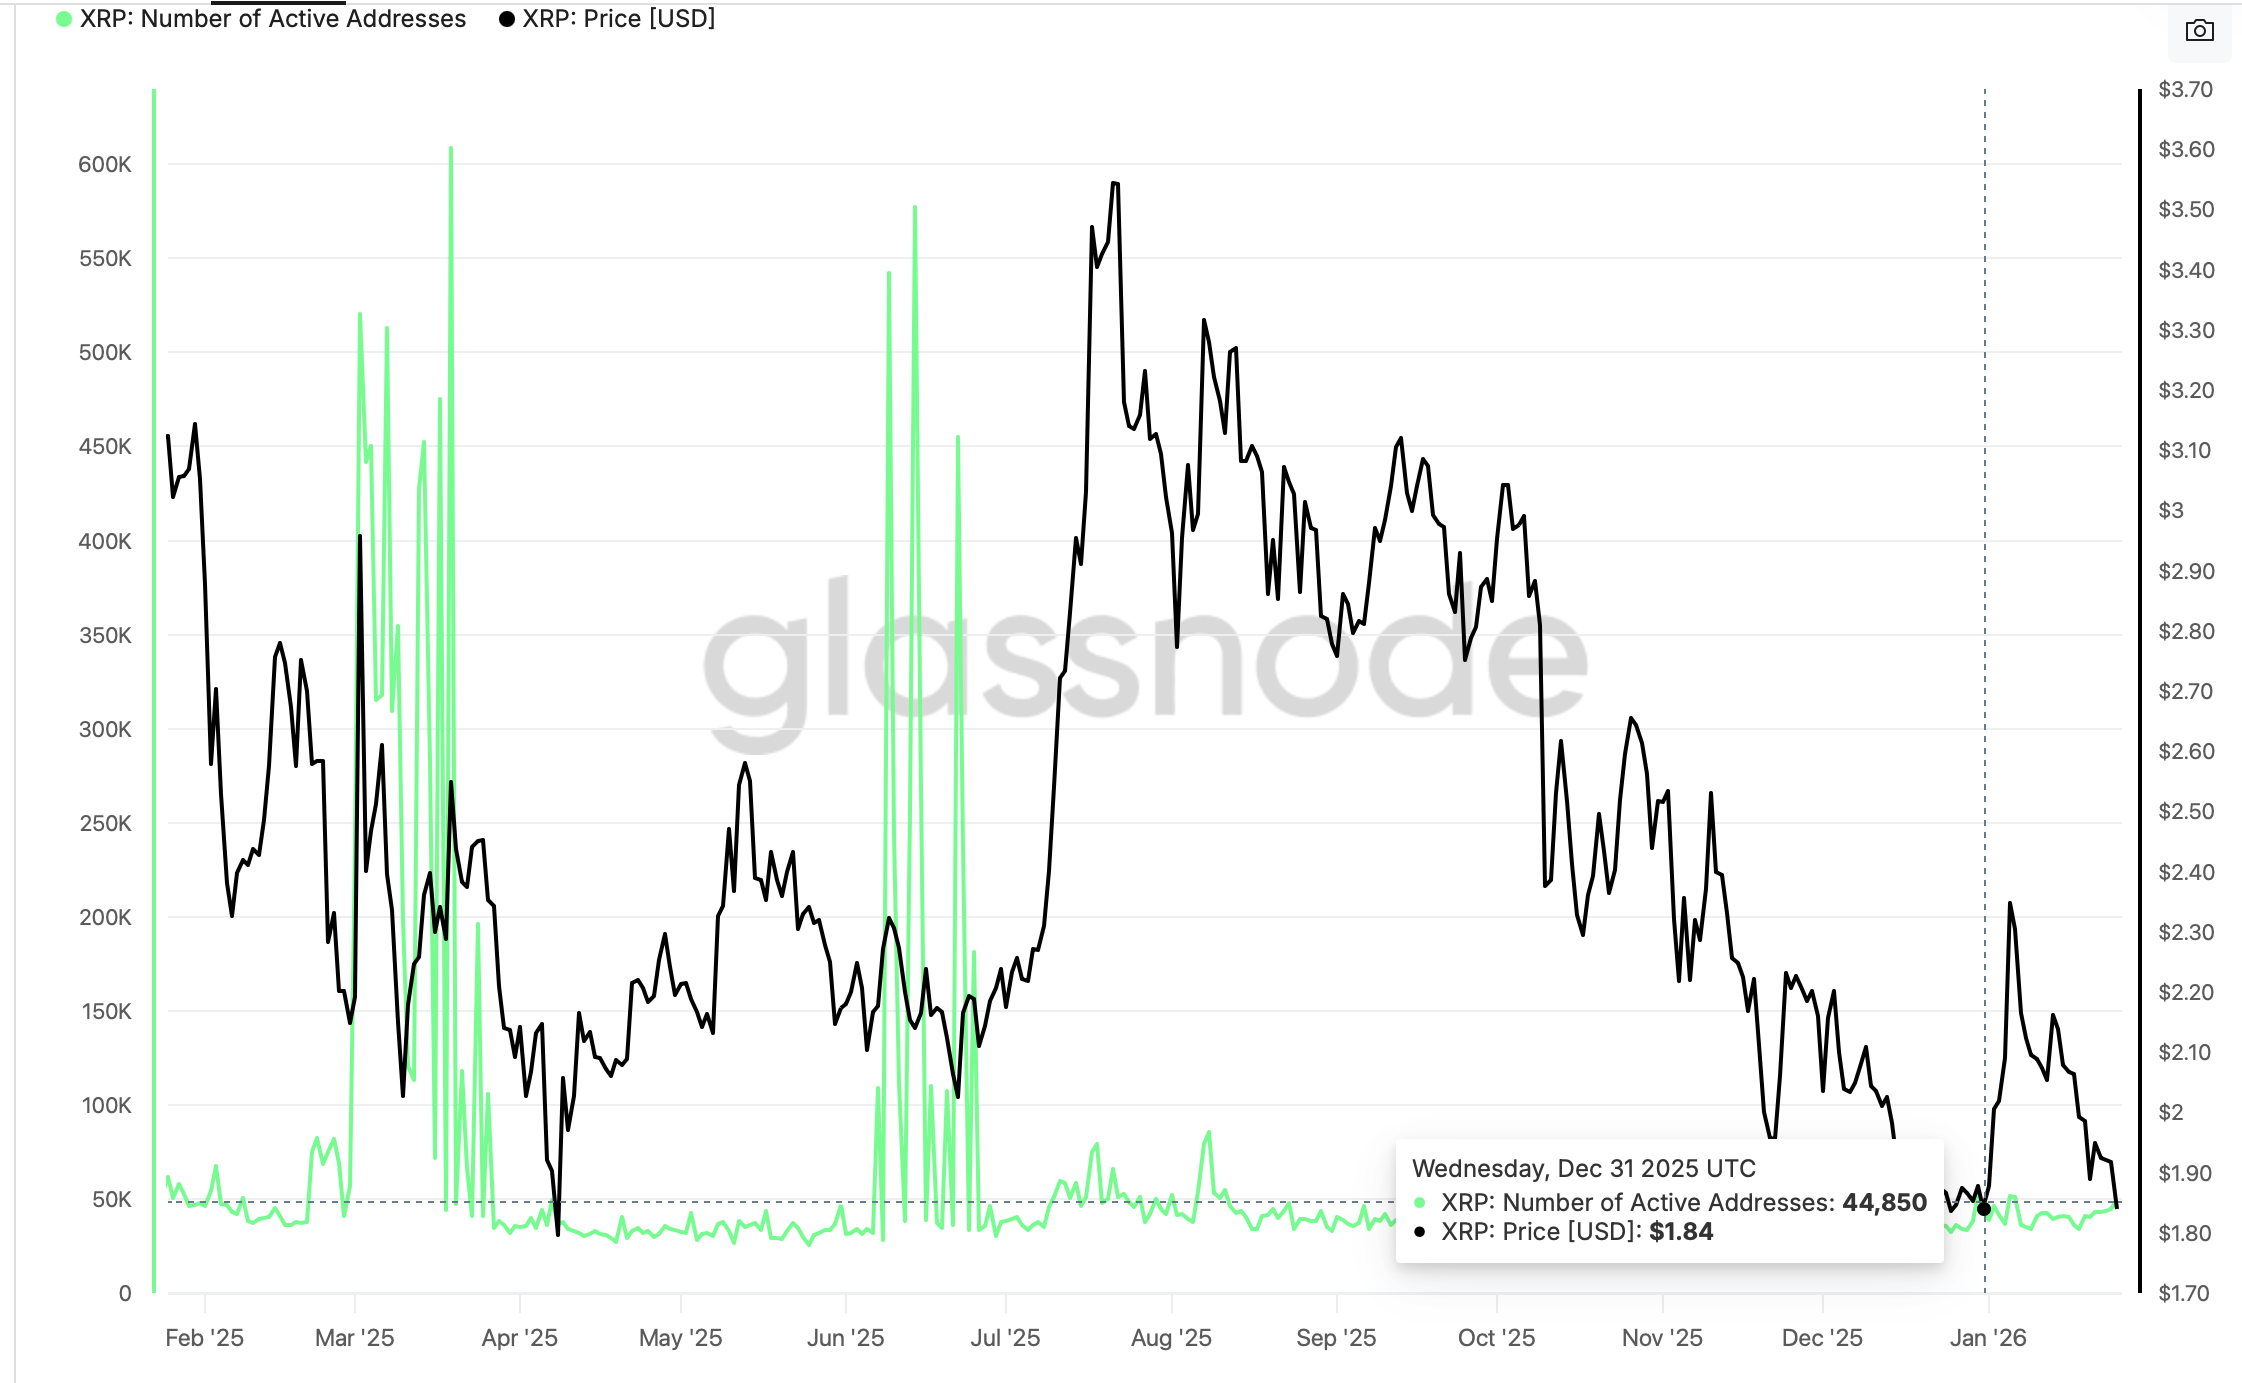
- The number of active addresses on the XRP Ledger dropped to 49,500 as of Sunday, signaling a decline in on-chain activity.
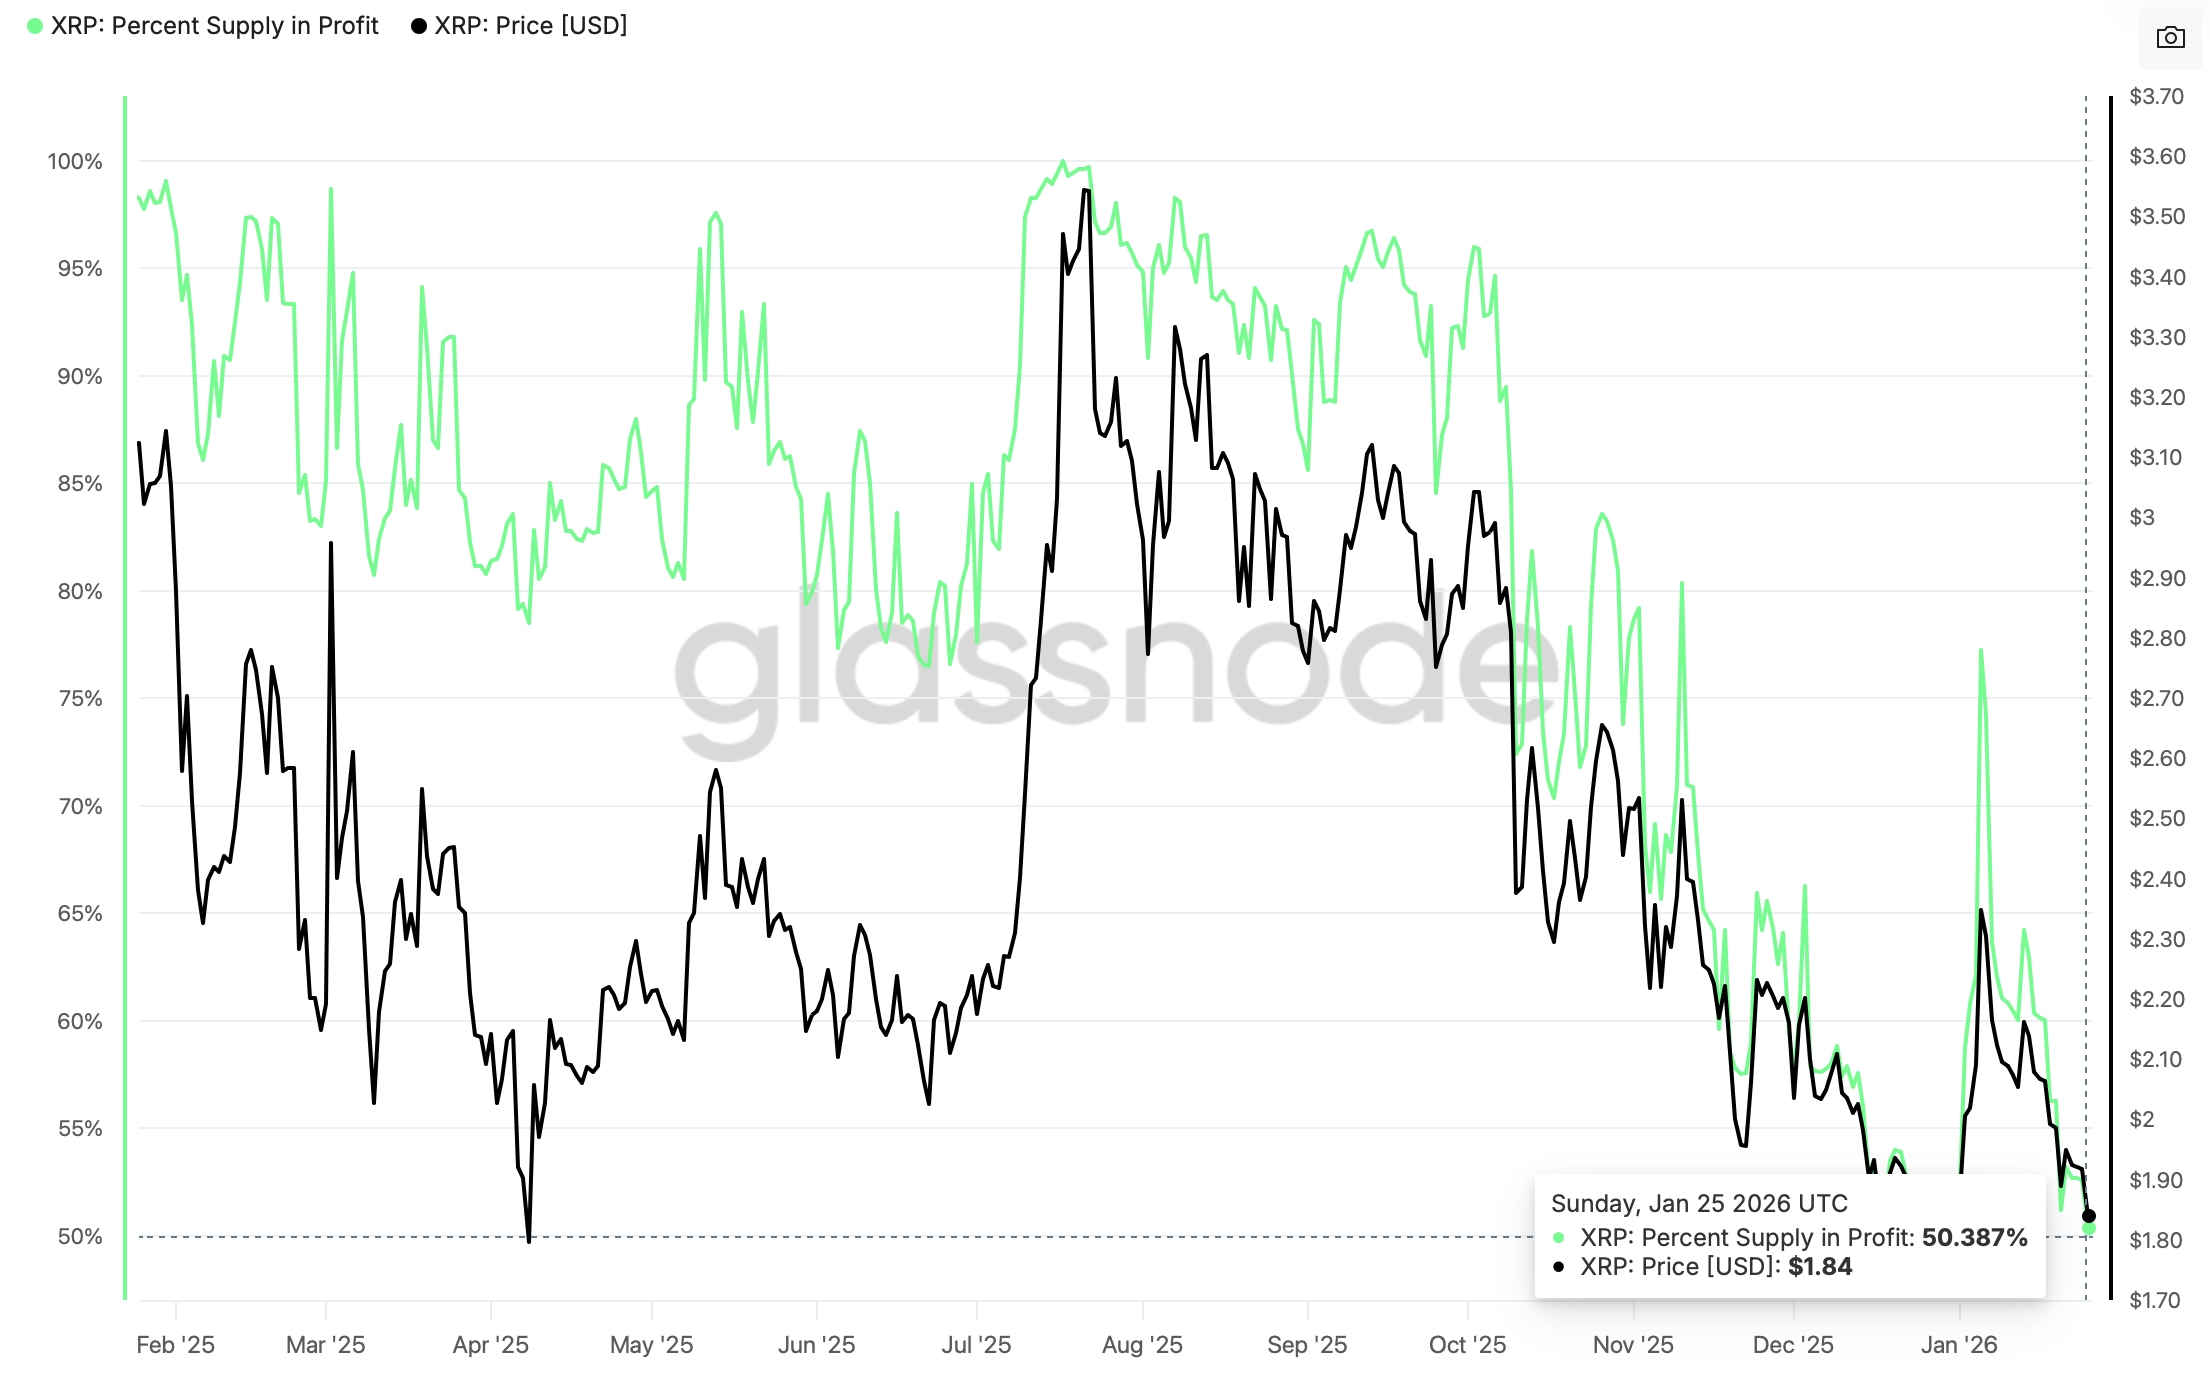
- The percentage of XRP held in profit has declined to levels seen in early January amid heightened investor capitulation.
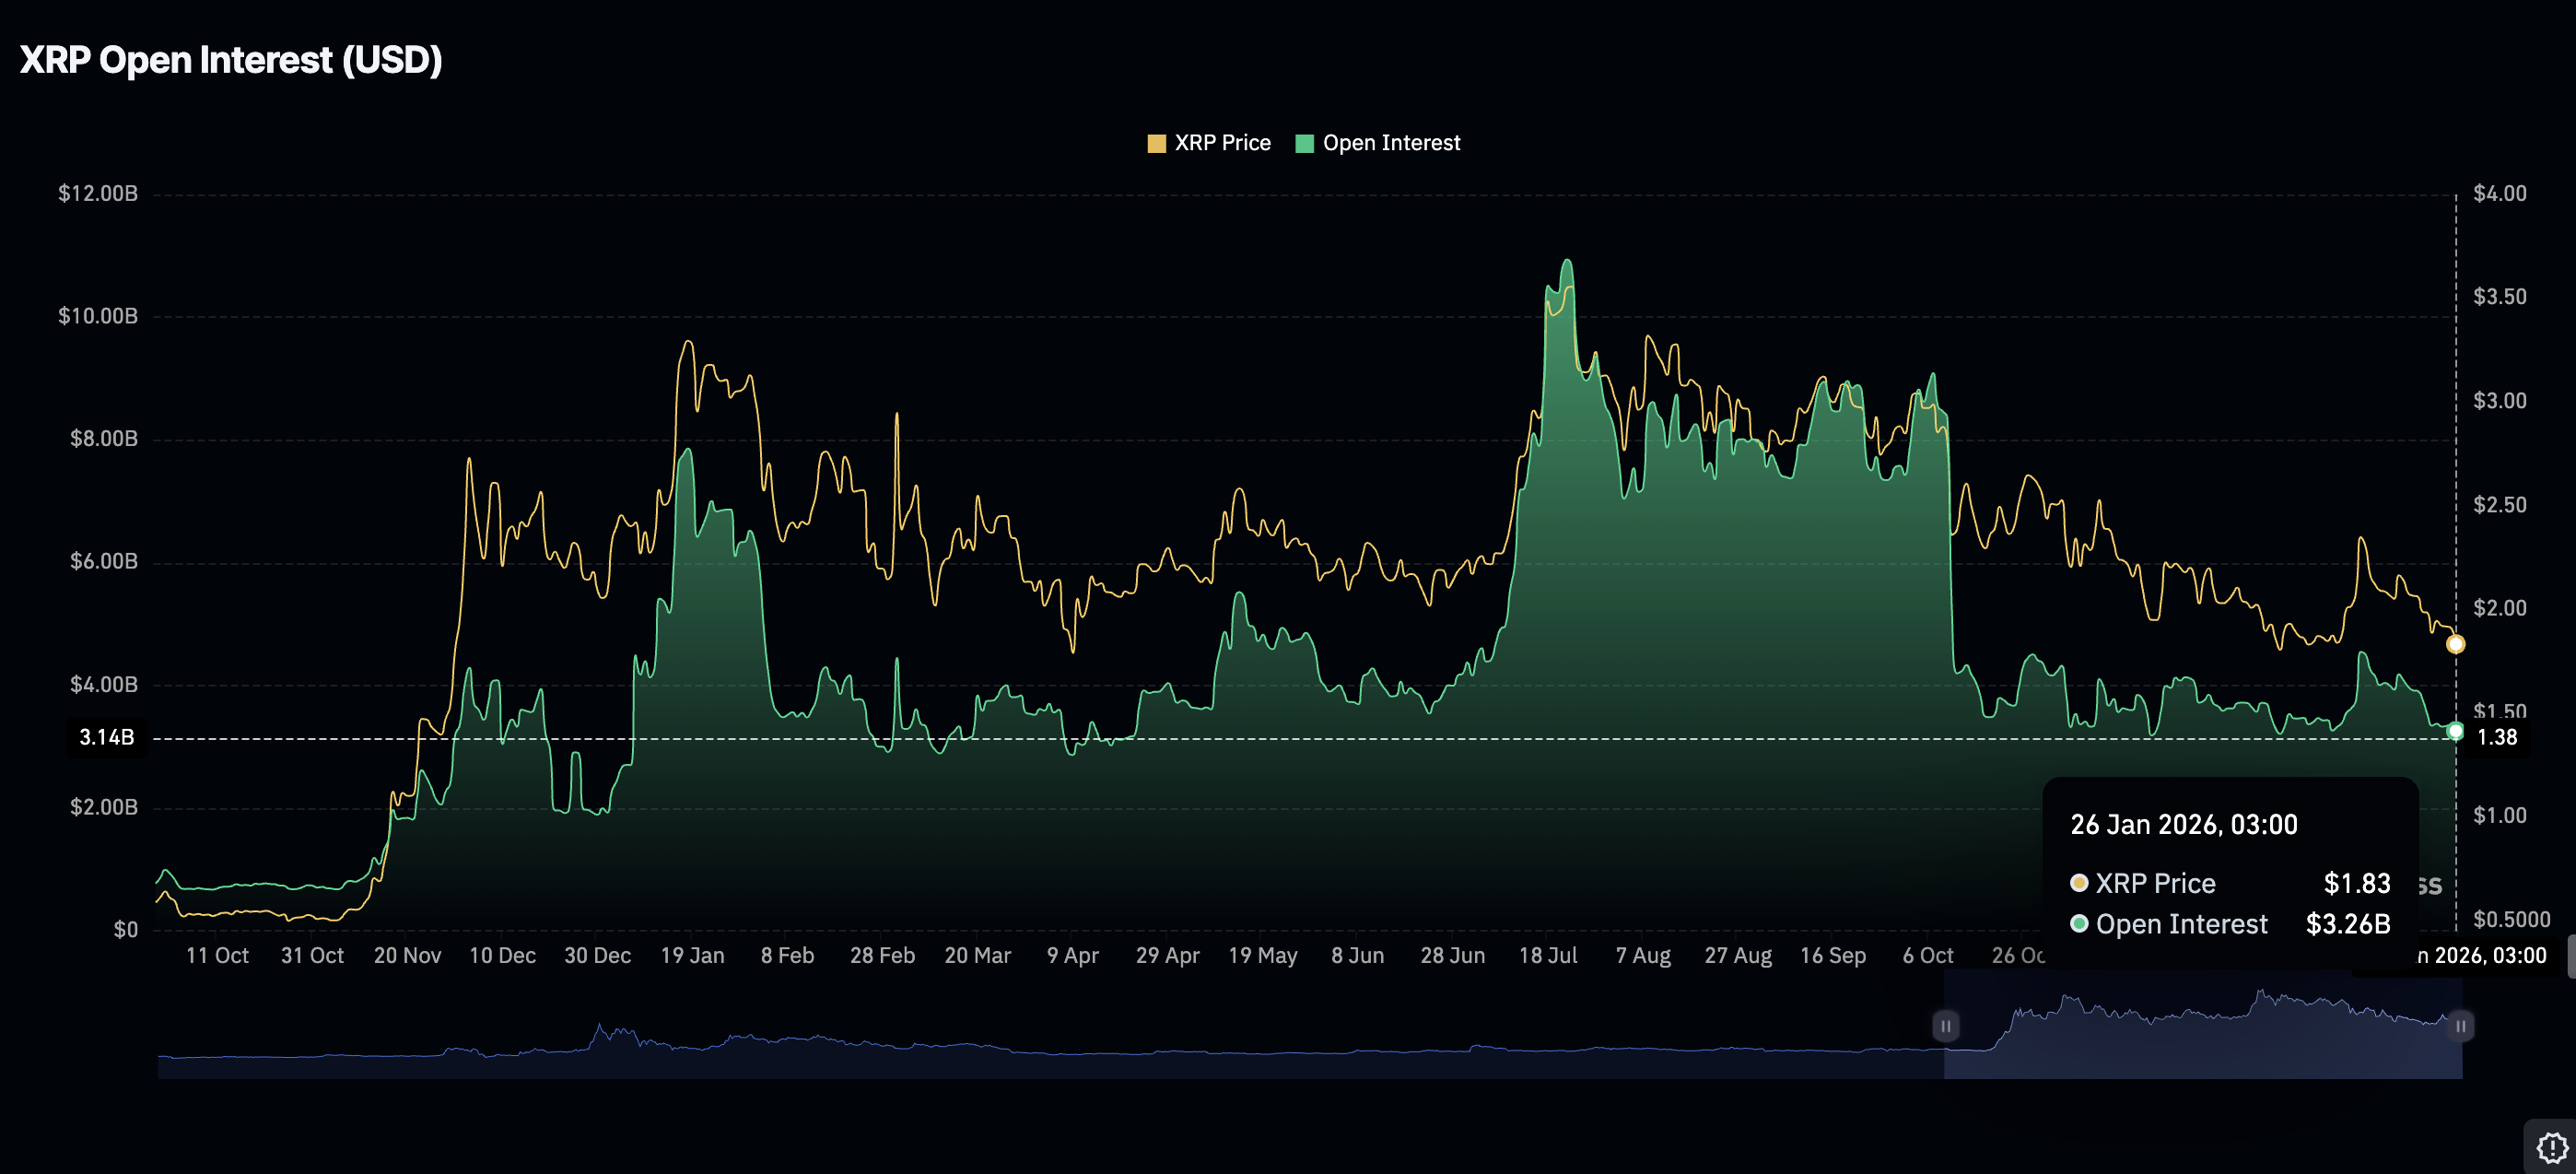
- XRP Open Interest continues to decline since the January 6 peak, suggesting a lack of confidence among retail investors.
Ripple (XRP) is trading near $1.90 at the time of writing on Monday, after posting modest gains. Bulls are attempting to regain control following intense volatility last week, which pushed XRP down to $1.81 on Sunday.
However, recovery remains a fragile endeavour, especially amid mounting uncertainty over a potential partial shutdown of the United States (US) federal government later this week.
Meanwhile, three key indicators suggest XRP’s next move could hinge on whether bulls can sustain momentum or if bears weigh on the token, increasing the odds of a deeper correction.
1. XRP’s rebound in jeopardy as on-chain activity weakens
The number of addresses actively transacting on the XRP Ledger (XRPL) has dropped by 3% to 45,000 on Sunday, from approximately 51,600 on January 5. This decline suggests that on-chain activity is weakening. Low user engagement reduces demand for XRP, leaving its price vulnerable to supply increases and risk-off sentiment in the broader crypto market.
2. XRP percentage held in profit resets
The percentage of XRP’s circulating supply held in profit falls to 50.4% on Monday, from 77.2% on January 5 and 80.4% on November 10. Such a significant decline suggests sentiment is deteriorating amid investor confidence. In other words, investors prefer to reduce exposure at the first sign of profit, adding to selling pressure.
On the flip side, this could signal an upward reset in the XRP price, given that the percentage of investors in profit is narrowing, reducing the available supply for sale. Investors are unlikely to sell aggressively when facing unrealized losses.
3. Retail confidence fades as Open Interest declines
XRP continues to face a weak derivatives market as risk-off sentiment spreads across the crypto space. CoinGlass data shows that Open Interest (OI) averages $3.26 billion on Monday, down from $3.4 billion the previous day, and $4.55 billion on January 6.
OI tracks the notional value of outstanding futures contracts; hence, persistent declines suggest low retail interest and a lack of confidence in the cross-border remittance token. Further declines would leave XRP susceptible to headwinds and increase the odds of an extension of the downtrend toward the April low of $1.61.
Technical outlook: XRP rebounds as bulls eye trend control
XRP is nearing resistance at $1.90 as the cryptocurrency market generally rises on Monday. The Relative Strength Index (RSI) has risen to 42 on the daily chart, supporting a short-term bullish outlook. A further increase in the RSI above the midline could mark the transition from bearish to bullish.
The 50-day Exponential Moving Average (EMA) caps the upside at $2.03, the 100-day EMA at $2.16 and the 200-day EMA at $2.29. Trading above this resistance cluster could boost the tailwind and accelerate the next recovery leg toward $2.50.
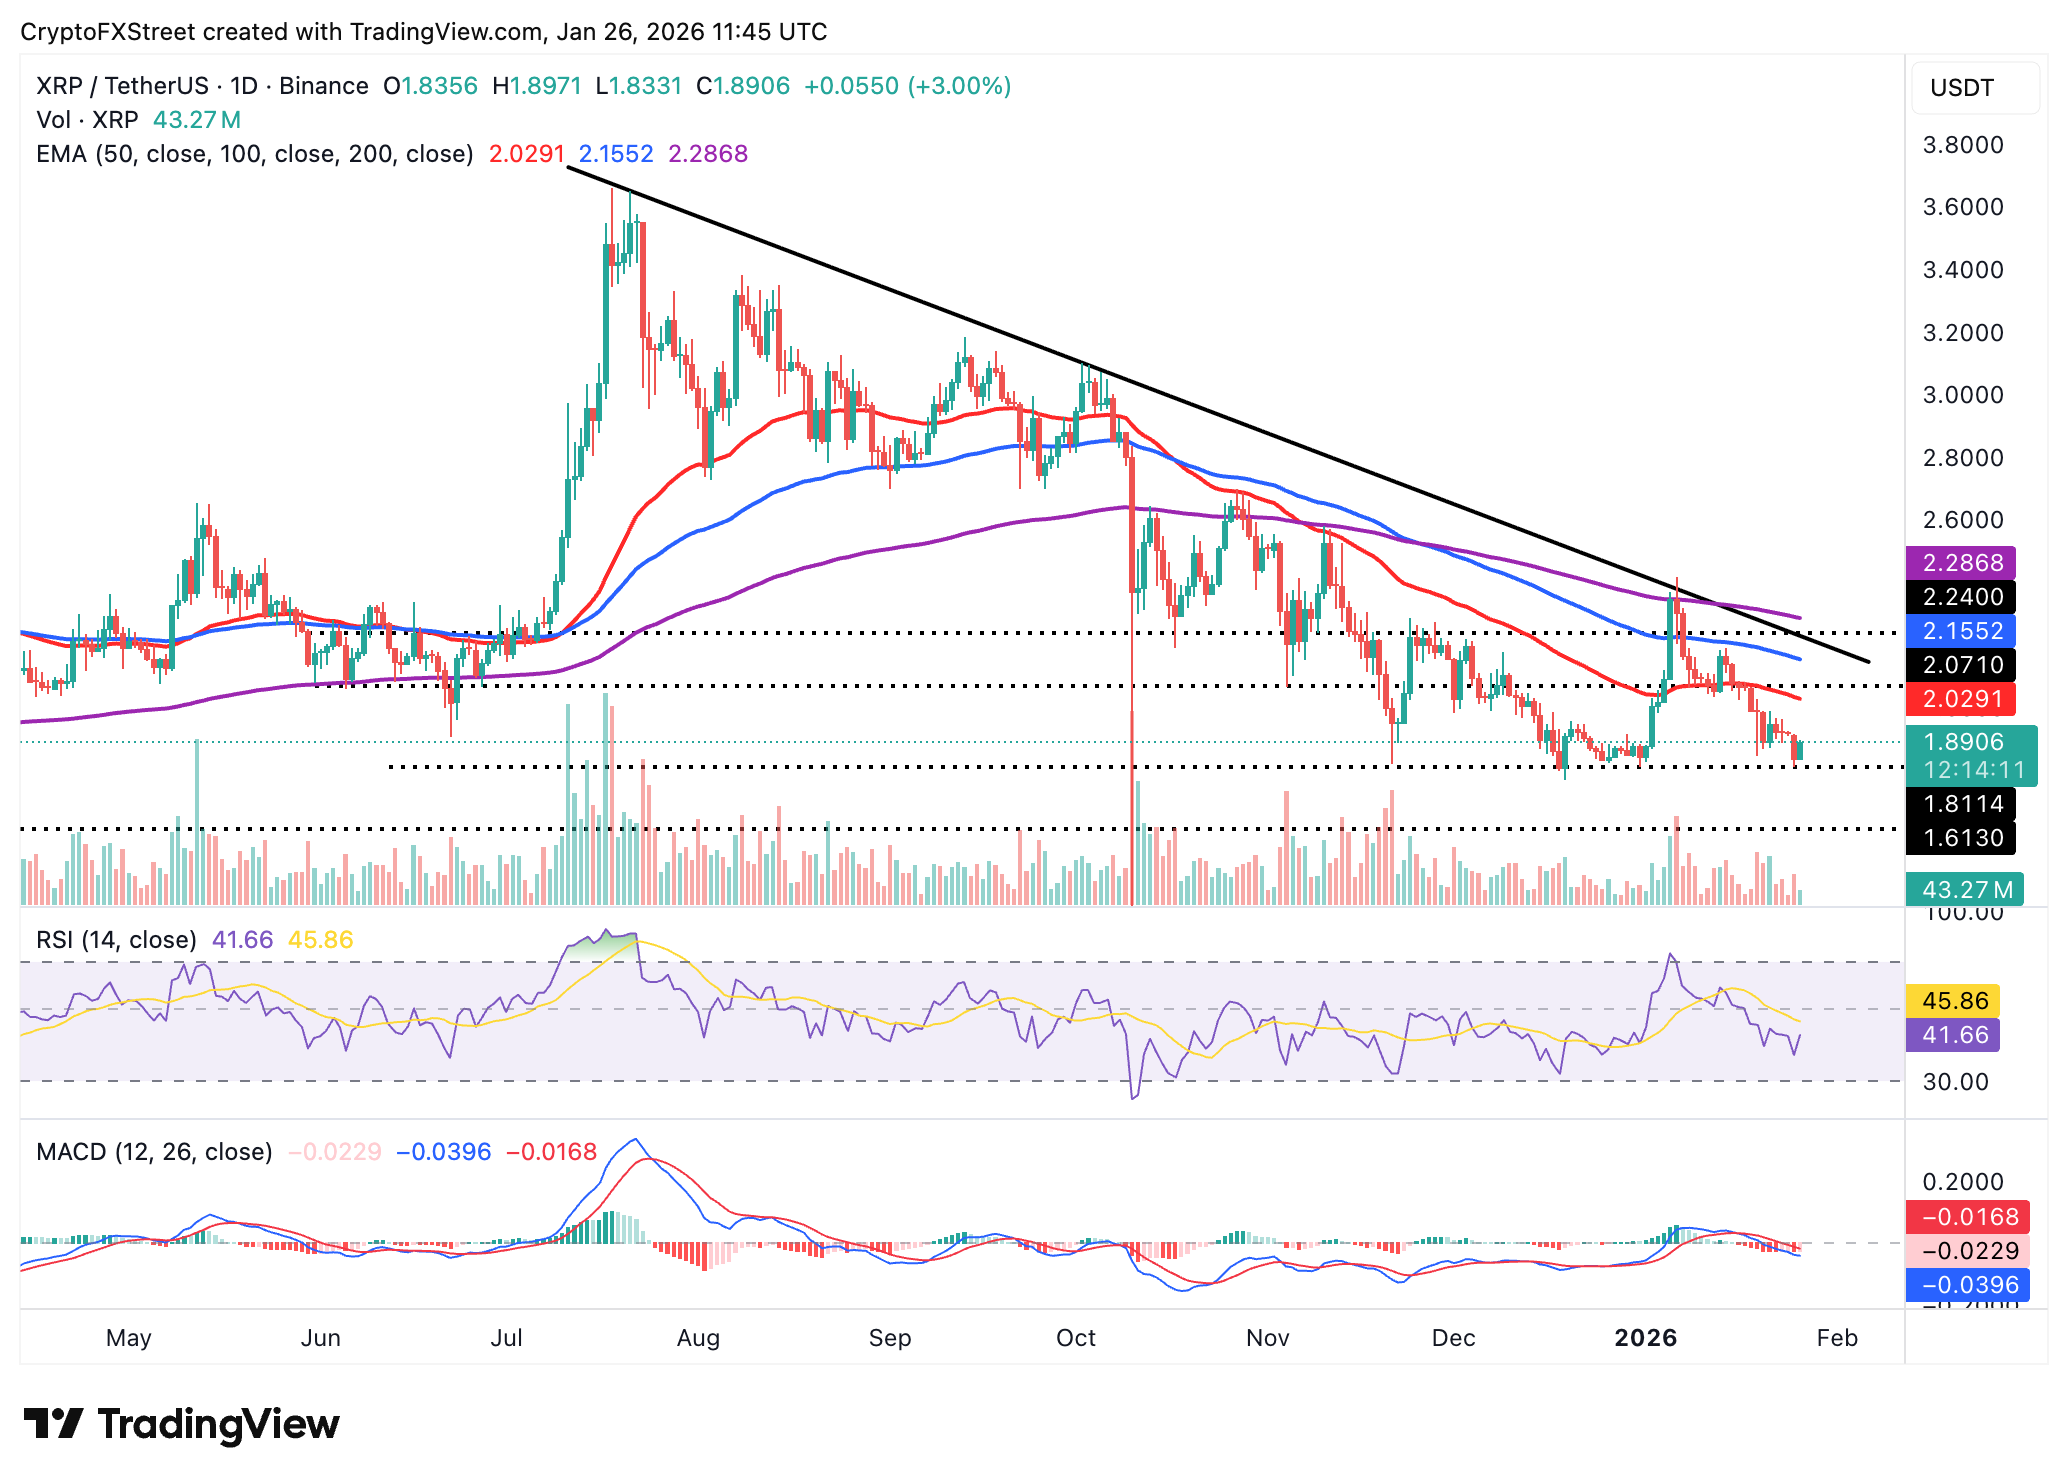
Still, the Moving Average Convergence Divergence (MACD) indicator remains below the signal line, while histogram bars expand below the zero line, reinforcing the overall bearish trend. Any sign of weakness in the ongoing rebound could trigger a sell-off as investors reduce risk exposure. The next key support level is the April low of $1.61.
Cryptocurrency metrics FAQs
The developer or creator of each cryptocurrency decides on the total number of tokens that can be minted or issued. Only a certain number of these assets can be minted by mining, staking or other mechanisms. This is defined by the algorithm of the underlying blockchain technology. On the other hand, circulating supply can also be decreased via actions such as burning tokens, or mistakenly sending assets to addresses of other incompatible blockchains.
Market capitalization is the result of multiplying the circulating supply of a certain asset by the asset’s current market value.
Trading volume refers to the total number of tokens for a specific asset that has been transacted or exchanged between buyers and sellers within set trading hours, for example, 24 hours. It is used to gauge market sentiment, this metric combines all volumes on centralized exchanges and decentralized exchanges. Increasing trading volume often denotes the demand for a certain asset as more people are buying and selling the cryptocurrency.
Funding rates are a concept designed to encourage traders to take positions and ensure perpetual contract prices match spot markets. It defines a mechanism by exchanges to ensure that future prices and index prices periodic payments regularly converge. When the funding rate is positive, the price of the perpetual contract is higher than the mark price. This means traders who are bullish and have opened long positions pay traders who are in short positions. On the other hand, a negative funding rate means perpetual prices are below the mark price, and hence traders with short positions pay traders who have opened long positions.
Bài viết đề xuất


