

Bitcoin halving: Altcoin rally looks likely, historical data shows
- Bitcoin halving is estimated to occur on April 19.
- Bitcoin price rally has pushed major altcoins to their new all-time high in 2024, or close to their top from November 2021.
- BTC dominance has shrunk significantly within 12 to 18 months after the halving, paving the way for capital rotation and inflow to altcoins in previous cycles.
Bitcoin’s (BTC) halving event, which is set to occur on April 19, could become the catalyst of an extended price rally for altcoins. A comparison of previous BTC halving events shows a steep decline in BTC’s dominance within 12-18 months after the halving that has led to a rally in altcoins.
Crypto market capitalization charts for Bitcoin and altcoins show an increase in altcoin market capitalization after Bitcoin’s halving, which will cut in half the rewards for miners.
Bitcoin halving impact on altcoins
Bitcoin halving is a key event that occurs once every four years. After each halving, the BTC mining difficulty increases as the reward for mining it is slashed in half. The three previous halvings have resulted in a significant decline in the dominance of Bitcoin and, at the same time, the altcoin market capitalization (excluding BTC) has climbed rapidly in the months following the mining difficulty change.
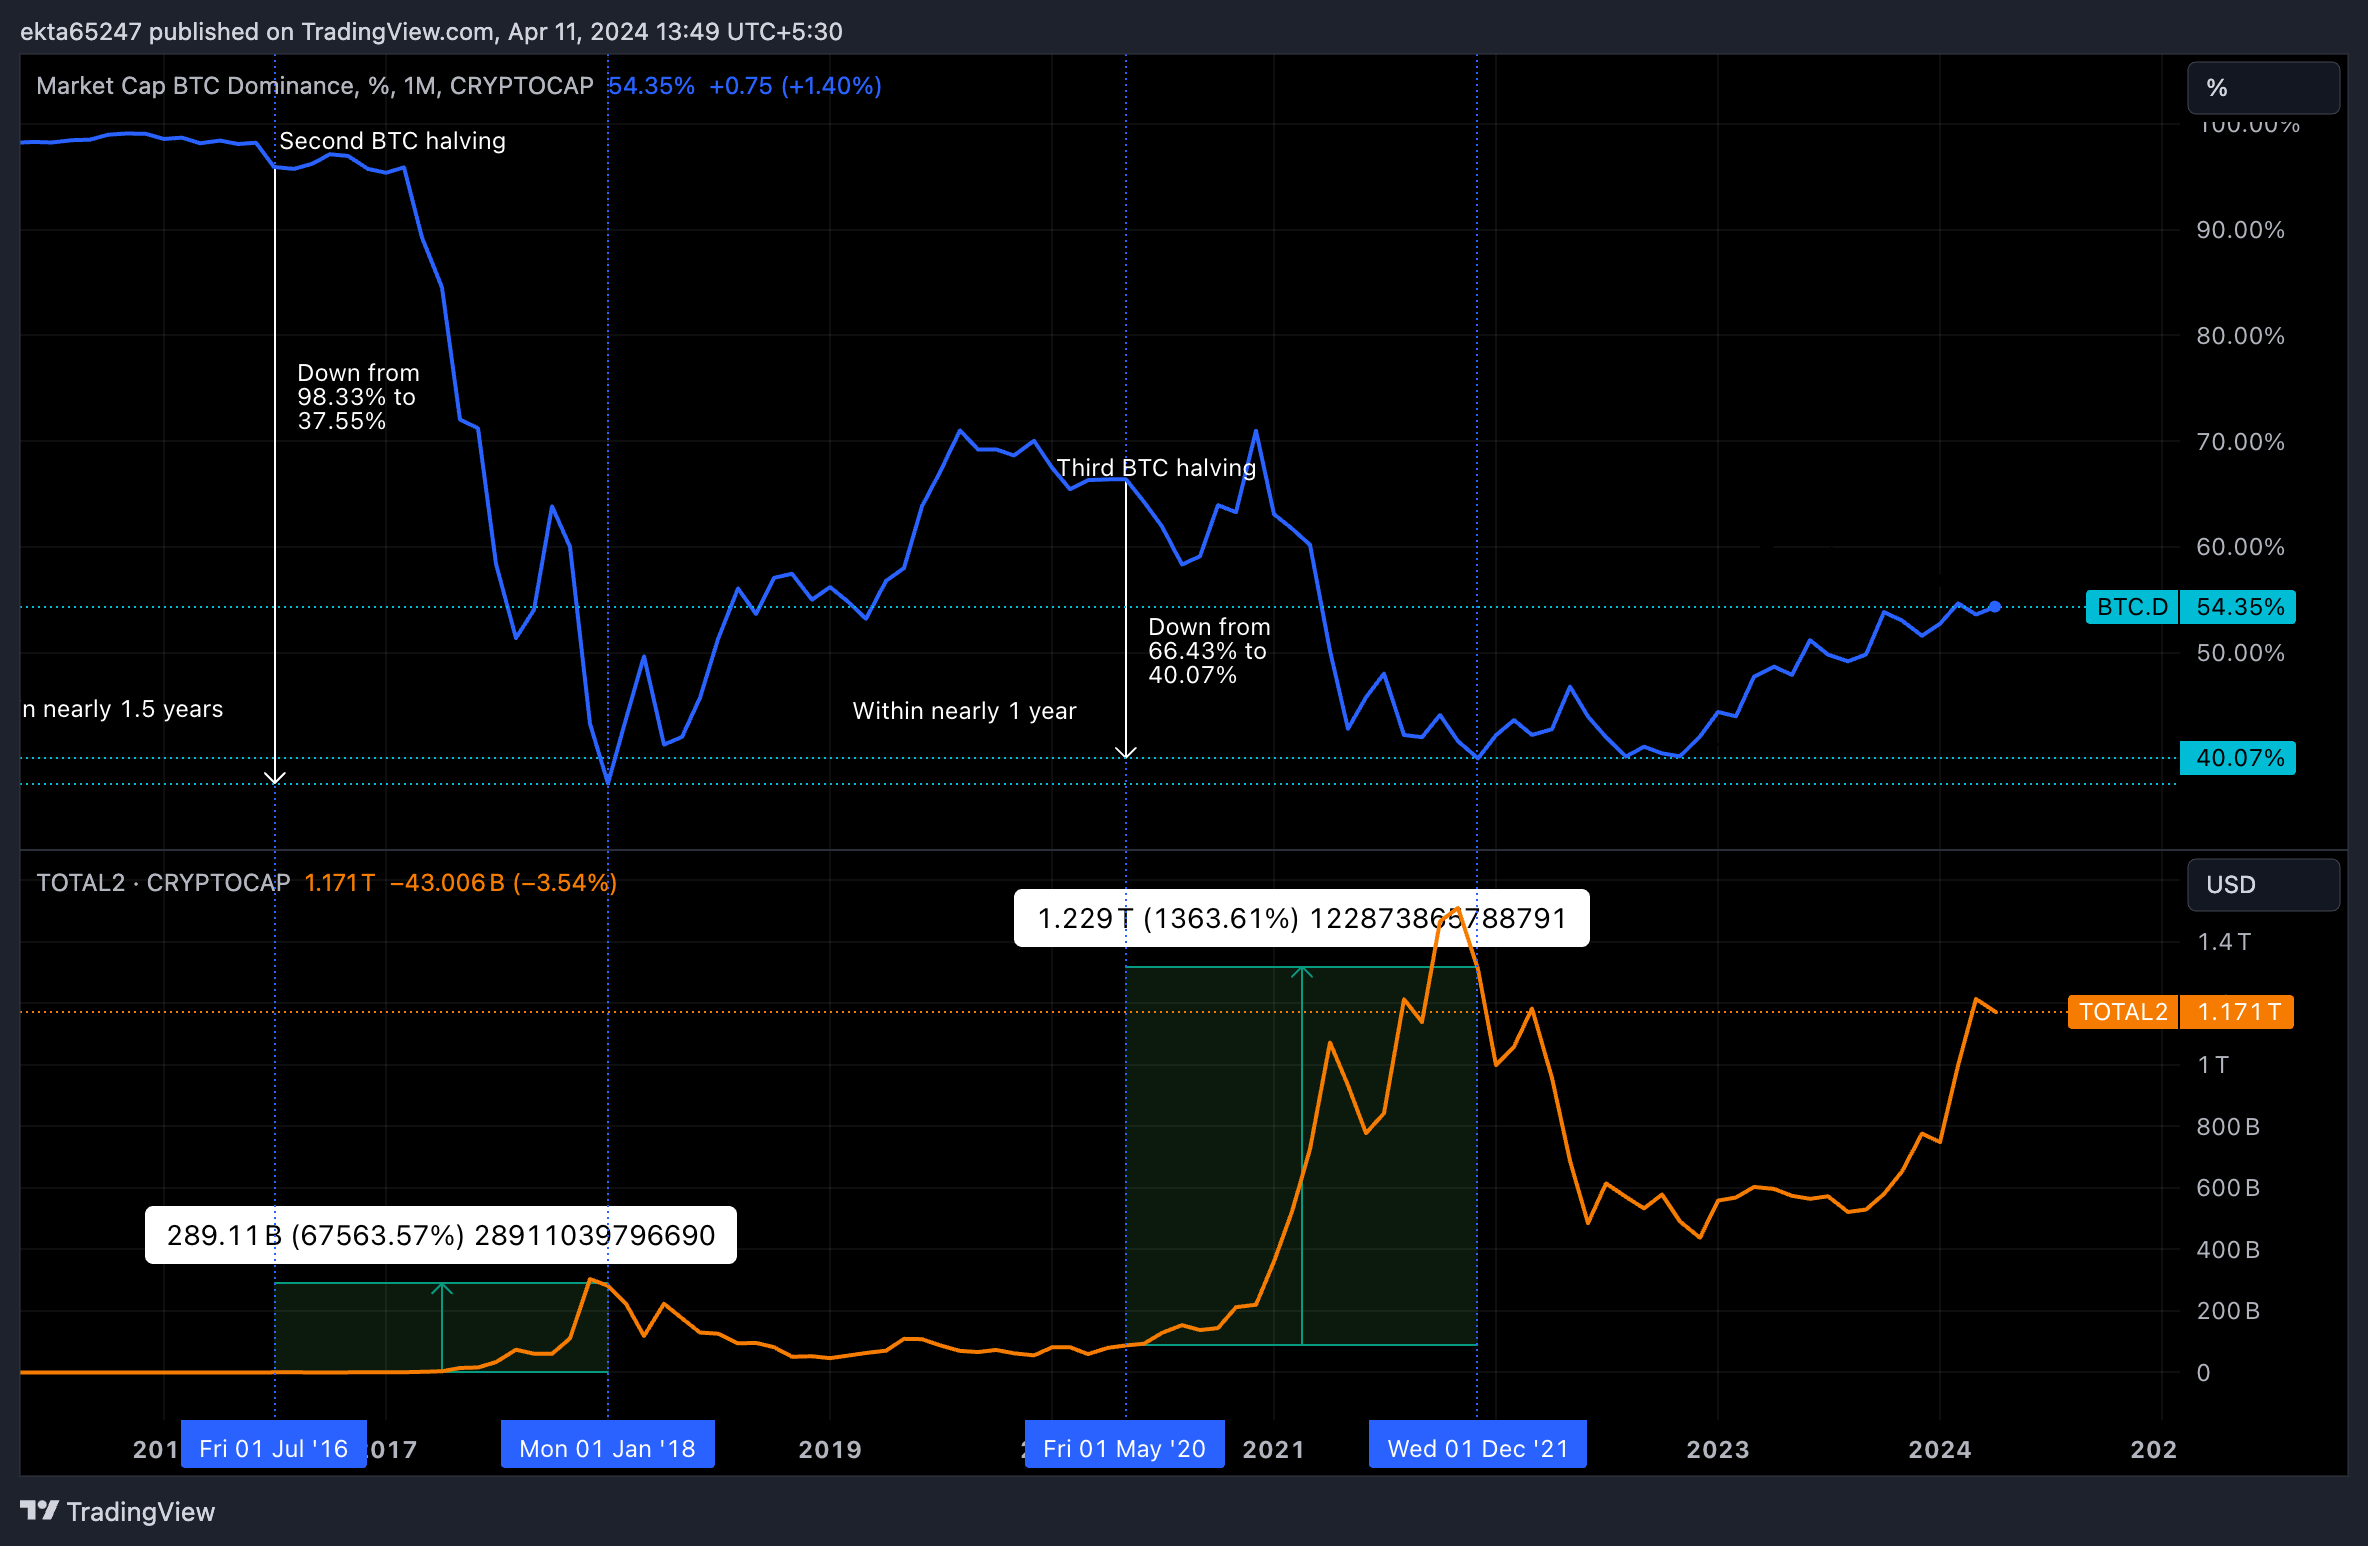
Bitcoin market capitalization dominance decreased from 98.33% to under 40% within 18 months after the second BTC halving event, which occurred on July 9, 2016. Back then, altcoins added over $286.5 billion in market capitalization. A similar pattern emerges in the third halving event on May 11, 2020.
Within 12 months of the third halving, Bitcoin dominance was down from 66.43% to 40%, and the altcoin market cap jumped from $90.11 billion to $1.229 trillion.
The established trend here is of altcoins gaining capital and relevance among market participants, post the BTC halving. Traders’ attention is likely to shift from the largest cryptocurrency to alternative assets that are considered more speculative than Bitcoin itself, categories like meme coins (Dogecoin, Shiba Inu), or gaming, NFT, metaverse tokens.
Bitcoin dominance and altcoin market cap pre and post-halving
Bitcoin dominance has taken a hit in the months leading to the second and third halving event, when considering a timeframe of nine to twelve months. It is likely that after a consistent increase since November 2022, we see a decline in BTC dominance, paving way for altcoins to benefit from capital rotation or influx of capital, this halving.
There is a steady increase in altcoin market cap, prior to BTC halving in both previous events. The market capitalization of cryptocurrencies represents an inflow of capital from market participants, and this has manifested in 2024 as well.
Bitcoin halving cycles reduce the BTC supply in circulation. As seen in the past, the post-halving influx of capital pushes both BTC price and altcoin market cap higher.
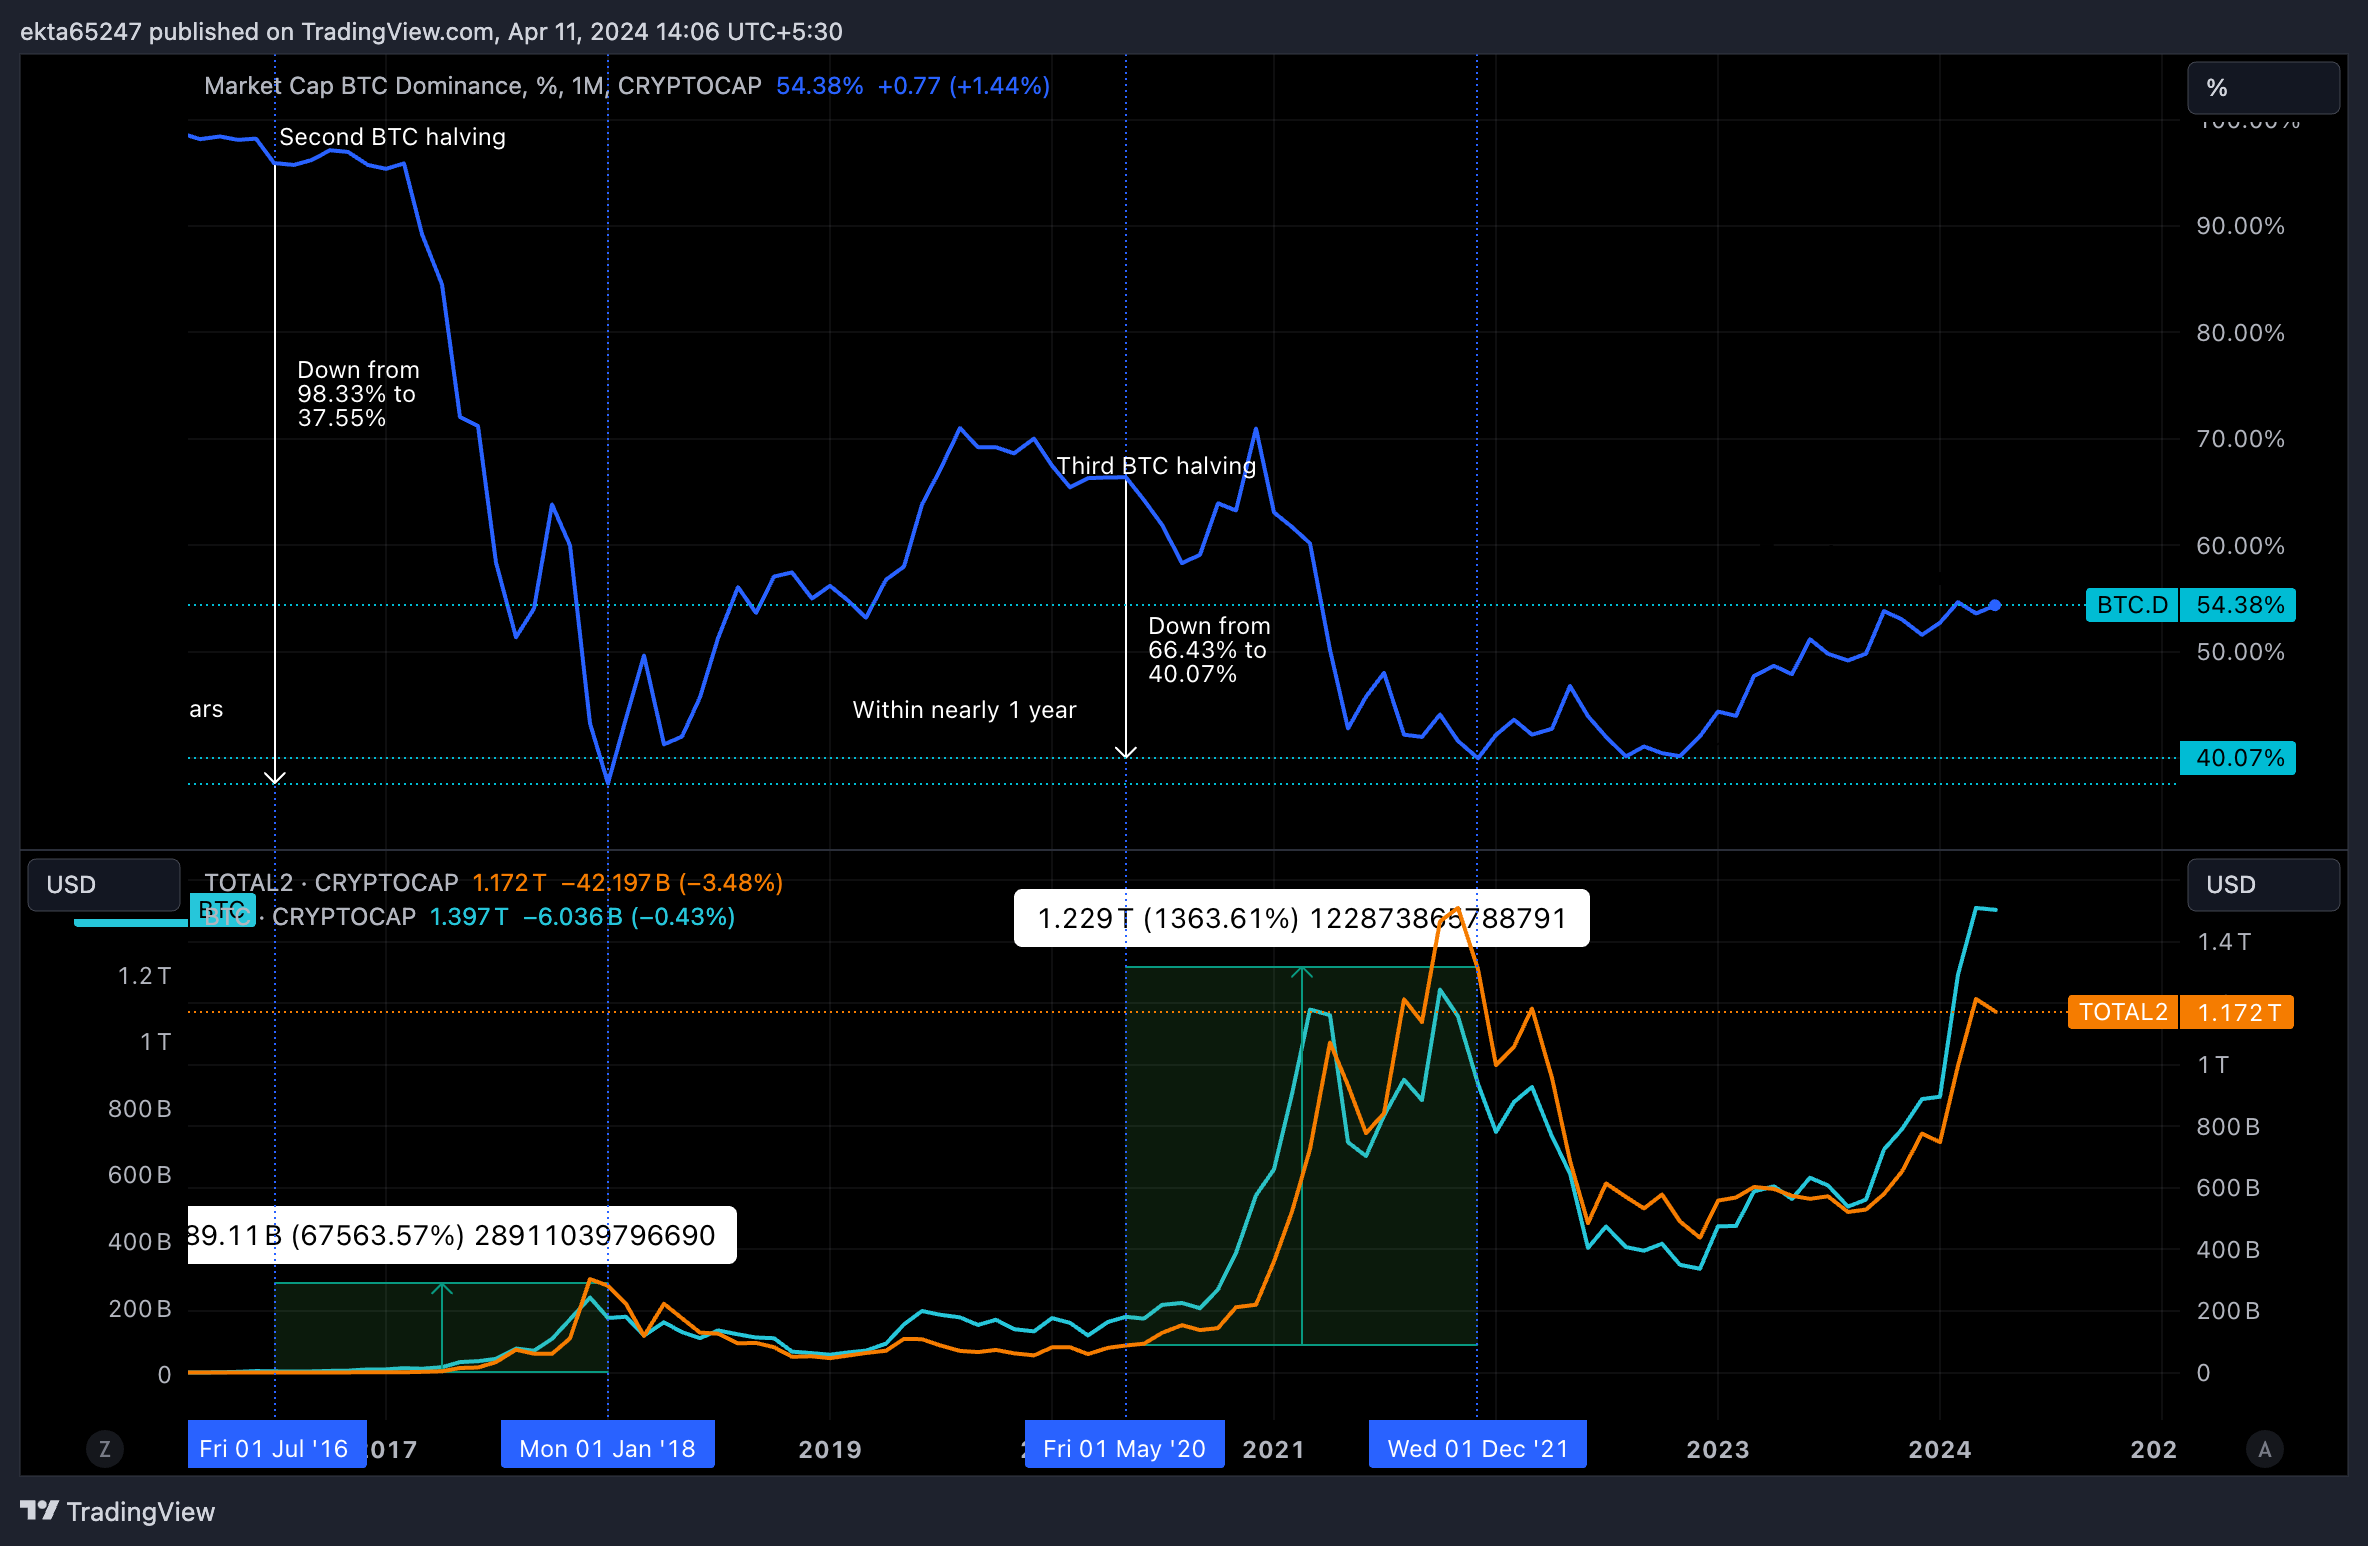
BTC and altcoin market cap and BTC dominance
Altcoin prices and how they get influenced by BTC halving
Ethereum, the second largest asset by market capitalization climbed from $258 to $3,623, a massive increase within the 12 months after the BTC halving. Buying Ethereum at the third halving would have resulted in a gain of 1,304% within a year. The spike in Ethereum price from the third halving can be considered an indicator of what traders can expect in the fourth BTC halving event.
Scooping up altcoins at the time of halving could reward traders with returns if the fourth halving follows the pattern of previous events.
While most altcoins have posted gains year-to-date, in the past 30 days, most tokens have faced a correction. Find out more about what to expect from altcoins post the short term decline in prices, here.
Bài viết đề xuất


