

Dogecoin Price Analysis: More DOGE gains ahead as PEPE crosses $4 billion in market cap
- Dogecoin price gains over 4% to break above $0.26 on Tuesday, supported by bullish tailwinds within the broader memecoin sector.
- PEPE price surges nearly 8% on the day, reaching the $4 billion market capitalization milestone.
- DOGE’s $72 million in long leveraged positions outpaced the $51 million in shorts by 30%, signaling intent to capitalize on bullish momentum.
Dogecoin price gains 3% to break above $0.26 on Monday, supported by bullish tailwinds within the broader memecoin sector. With PEPE price posting superior gains, derivatives markets data suggest DOGE could also advance further in the days ahead.
Dogecoin (DOGE) breaks above $0.26 as US Fed rate prospects lift memecoin markets
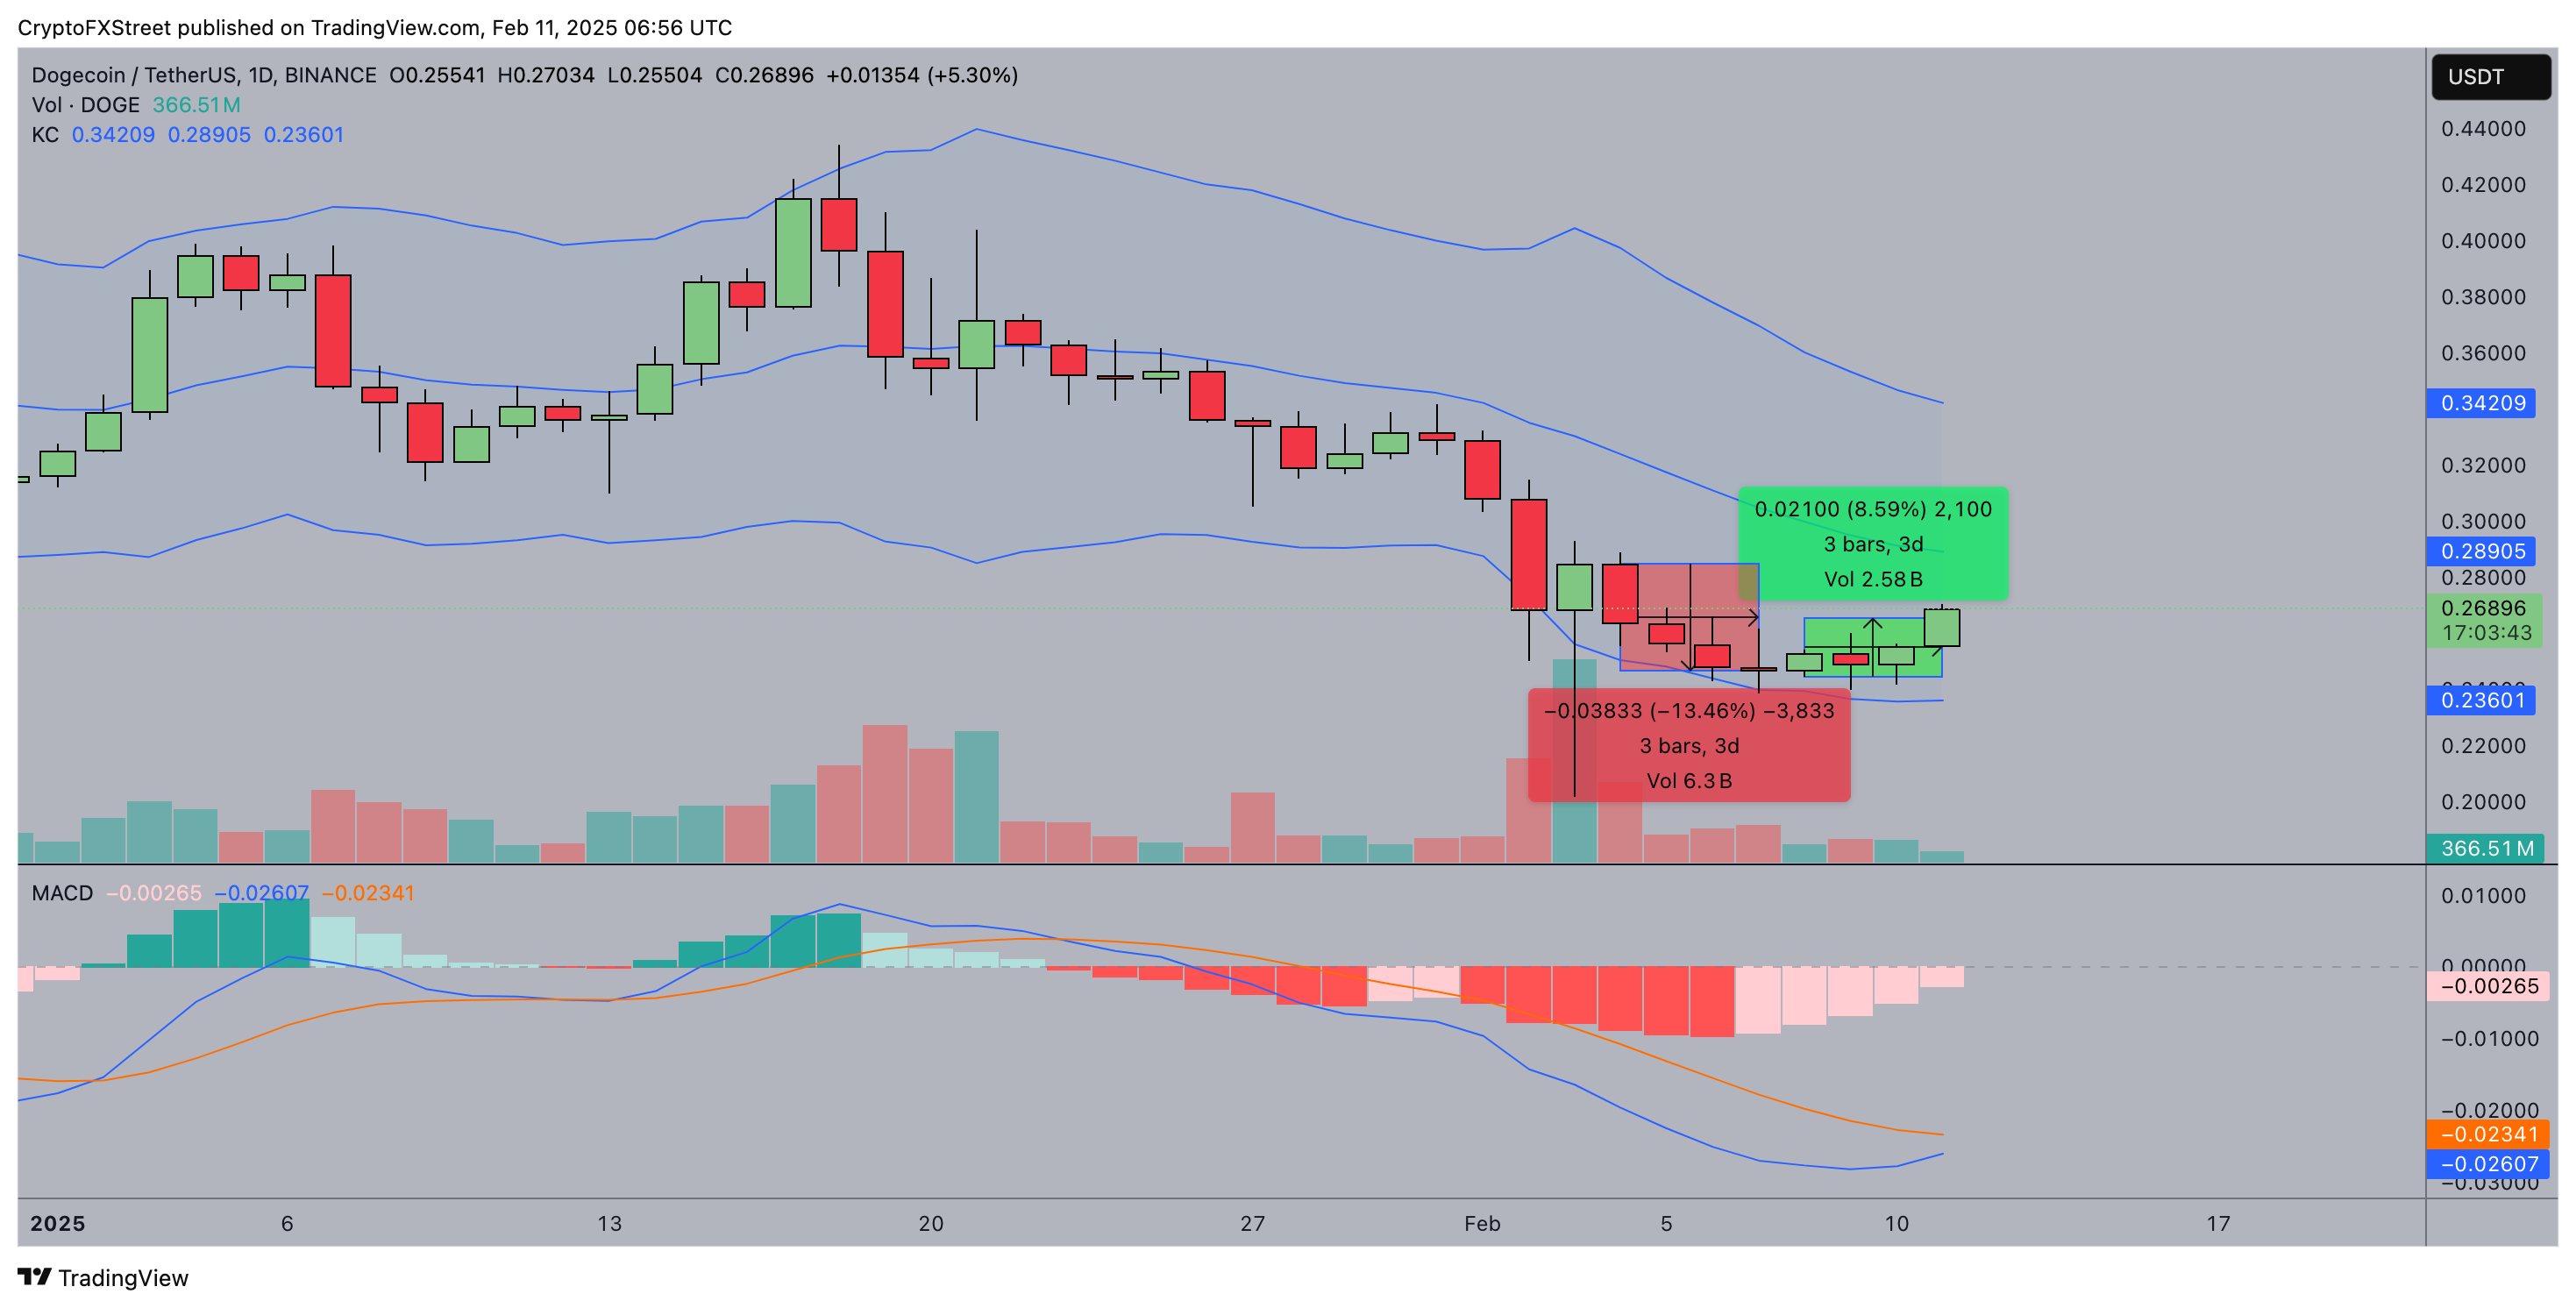
Dogecoin (DOGE) has recorded 9% gains over the last four days, topping above $0.27 on Tuesday after ending a four-day losing streak observed the previous week.
DOGE’s three-day price recovery since Friday has been linked to positive speculation ahead of the US Consumer Price Index (CPI) data, which will be released on Wednesday, with many anticipating a pause in interest rate cuts.
Dogecoin Price Action, Feb 11, 2025 | Source: TradingView
Market sentiment improved as the United States averted a feared tariff war with its neighbors, Canada and Mexico.
This development buoyed risk-on sentiment, lifting not just Dogecoin but the entire memecoin sector.
Despite its 9% gains over the past three days, Dogecoin was not the top-performing memecoin on Feb 11.
While DOGE rose 3% on the day, PEPE surged 5%, reclaiming the $4 billion market capitalization milestone.
The broader memecoin market climbed 0.9%, pushing the aggregate valuation to $76.8 billion.
This broad-based rally suggests deep bullish sentiment, which could persist and provide a tailwind for Dogecoin’s price.
Global Memecoin Market Performance, Feb 11, 2025 | Source: CoinGecko
Historically, strong sector-wide movements indicate sustained bullishness, and Dogecoin's latest rally aligns with this trend. If the positive momentum continues, DOGE could advance further and challenge higher resistance levels.
Bull traders betting on DOGE price to advance further
Derivatives market trends indicate that Dogecoin bull traders are positioning to capitalize on the ongoing bullish sentiment within the broader memecoin sector.
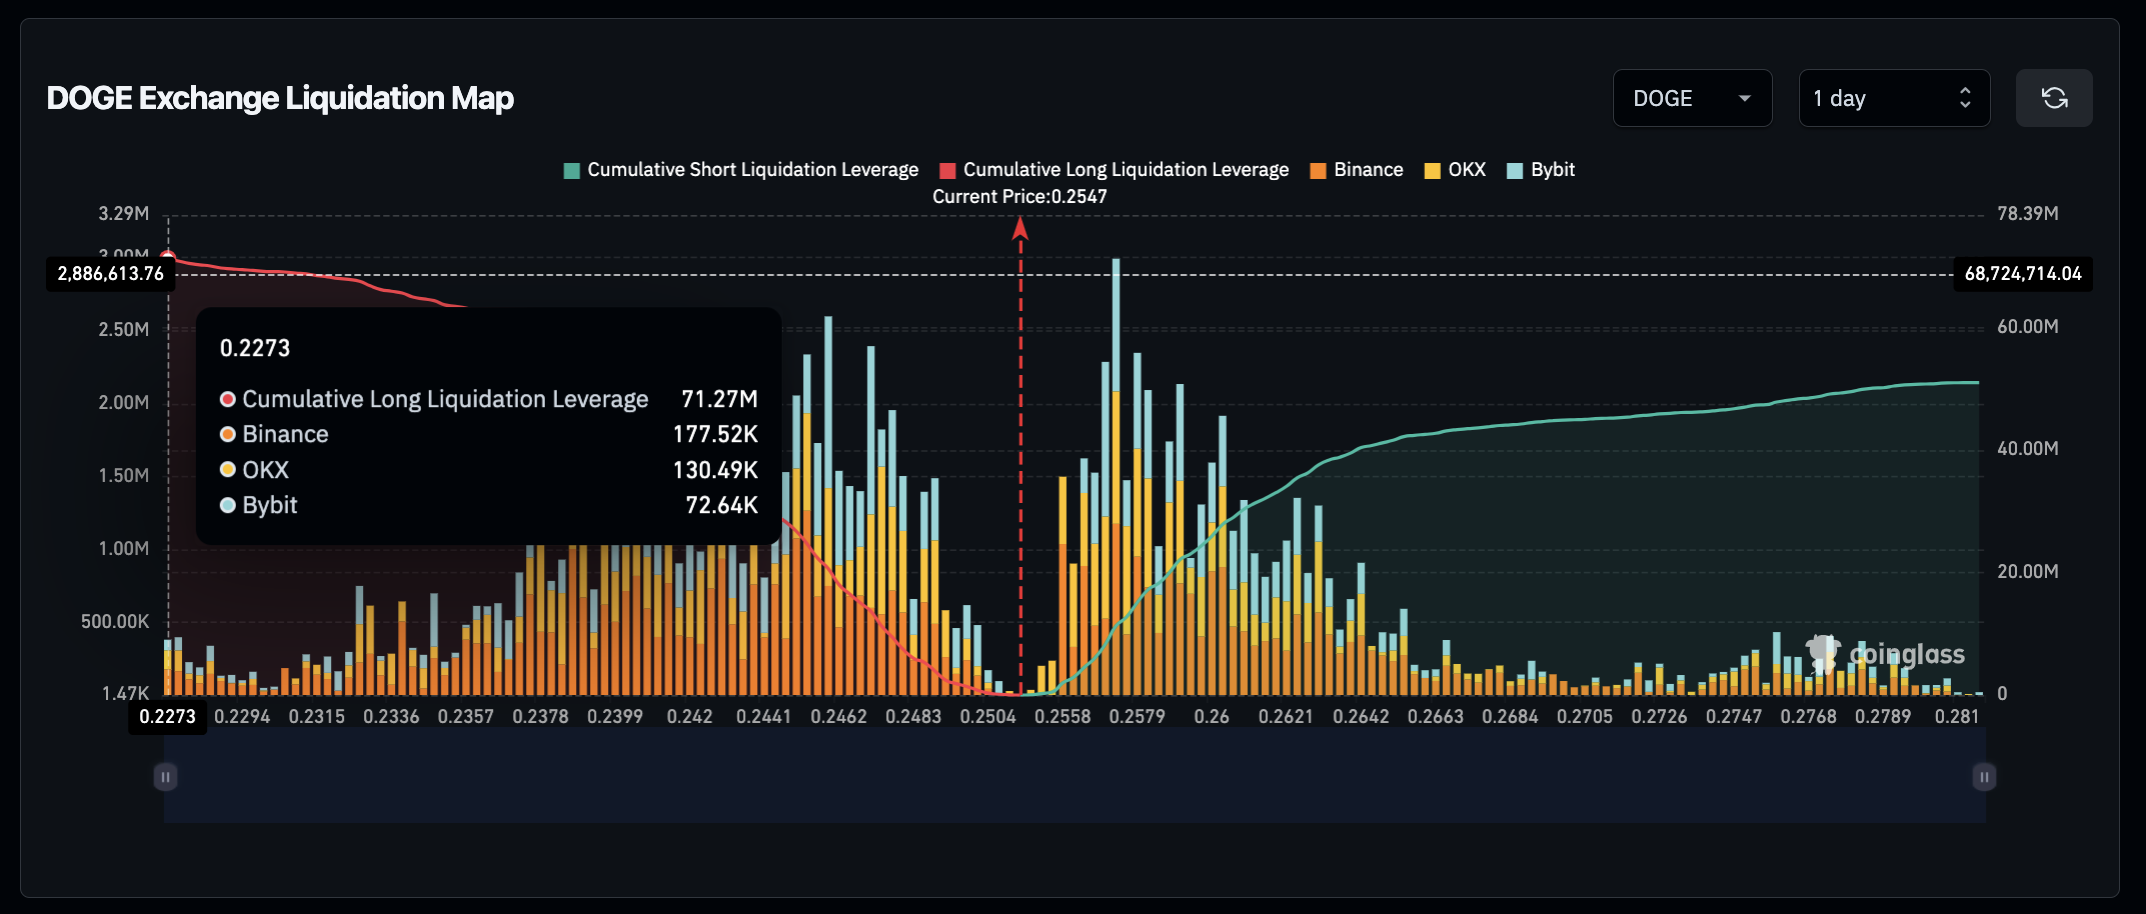
Dogecoin Liquidation Map, Feb 11 | Source: Coinglass
Data from Coinglass’ Liquidation Map reveals that DOGE’s $71.2 million in long leveraged positions currently outpace the $51 million in shorts by 30%, signaling strong bullish intent. Rising long positions amid a price rebound typically suggest that the majority of traders expect the rally to extend towards higher resistance levels.
If this trend persists, Dogecoin could build on its current momentum and attempt a breakout beyond the $0.27 mark.
The increasing leveraged long exposure suggests that institutional and retail traders alike are betting on further upside. However, in the event of an unexpected pullback, strong support around $0.24 could absorb any sell pressure, limiting downside risks.
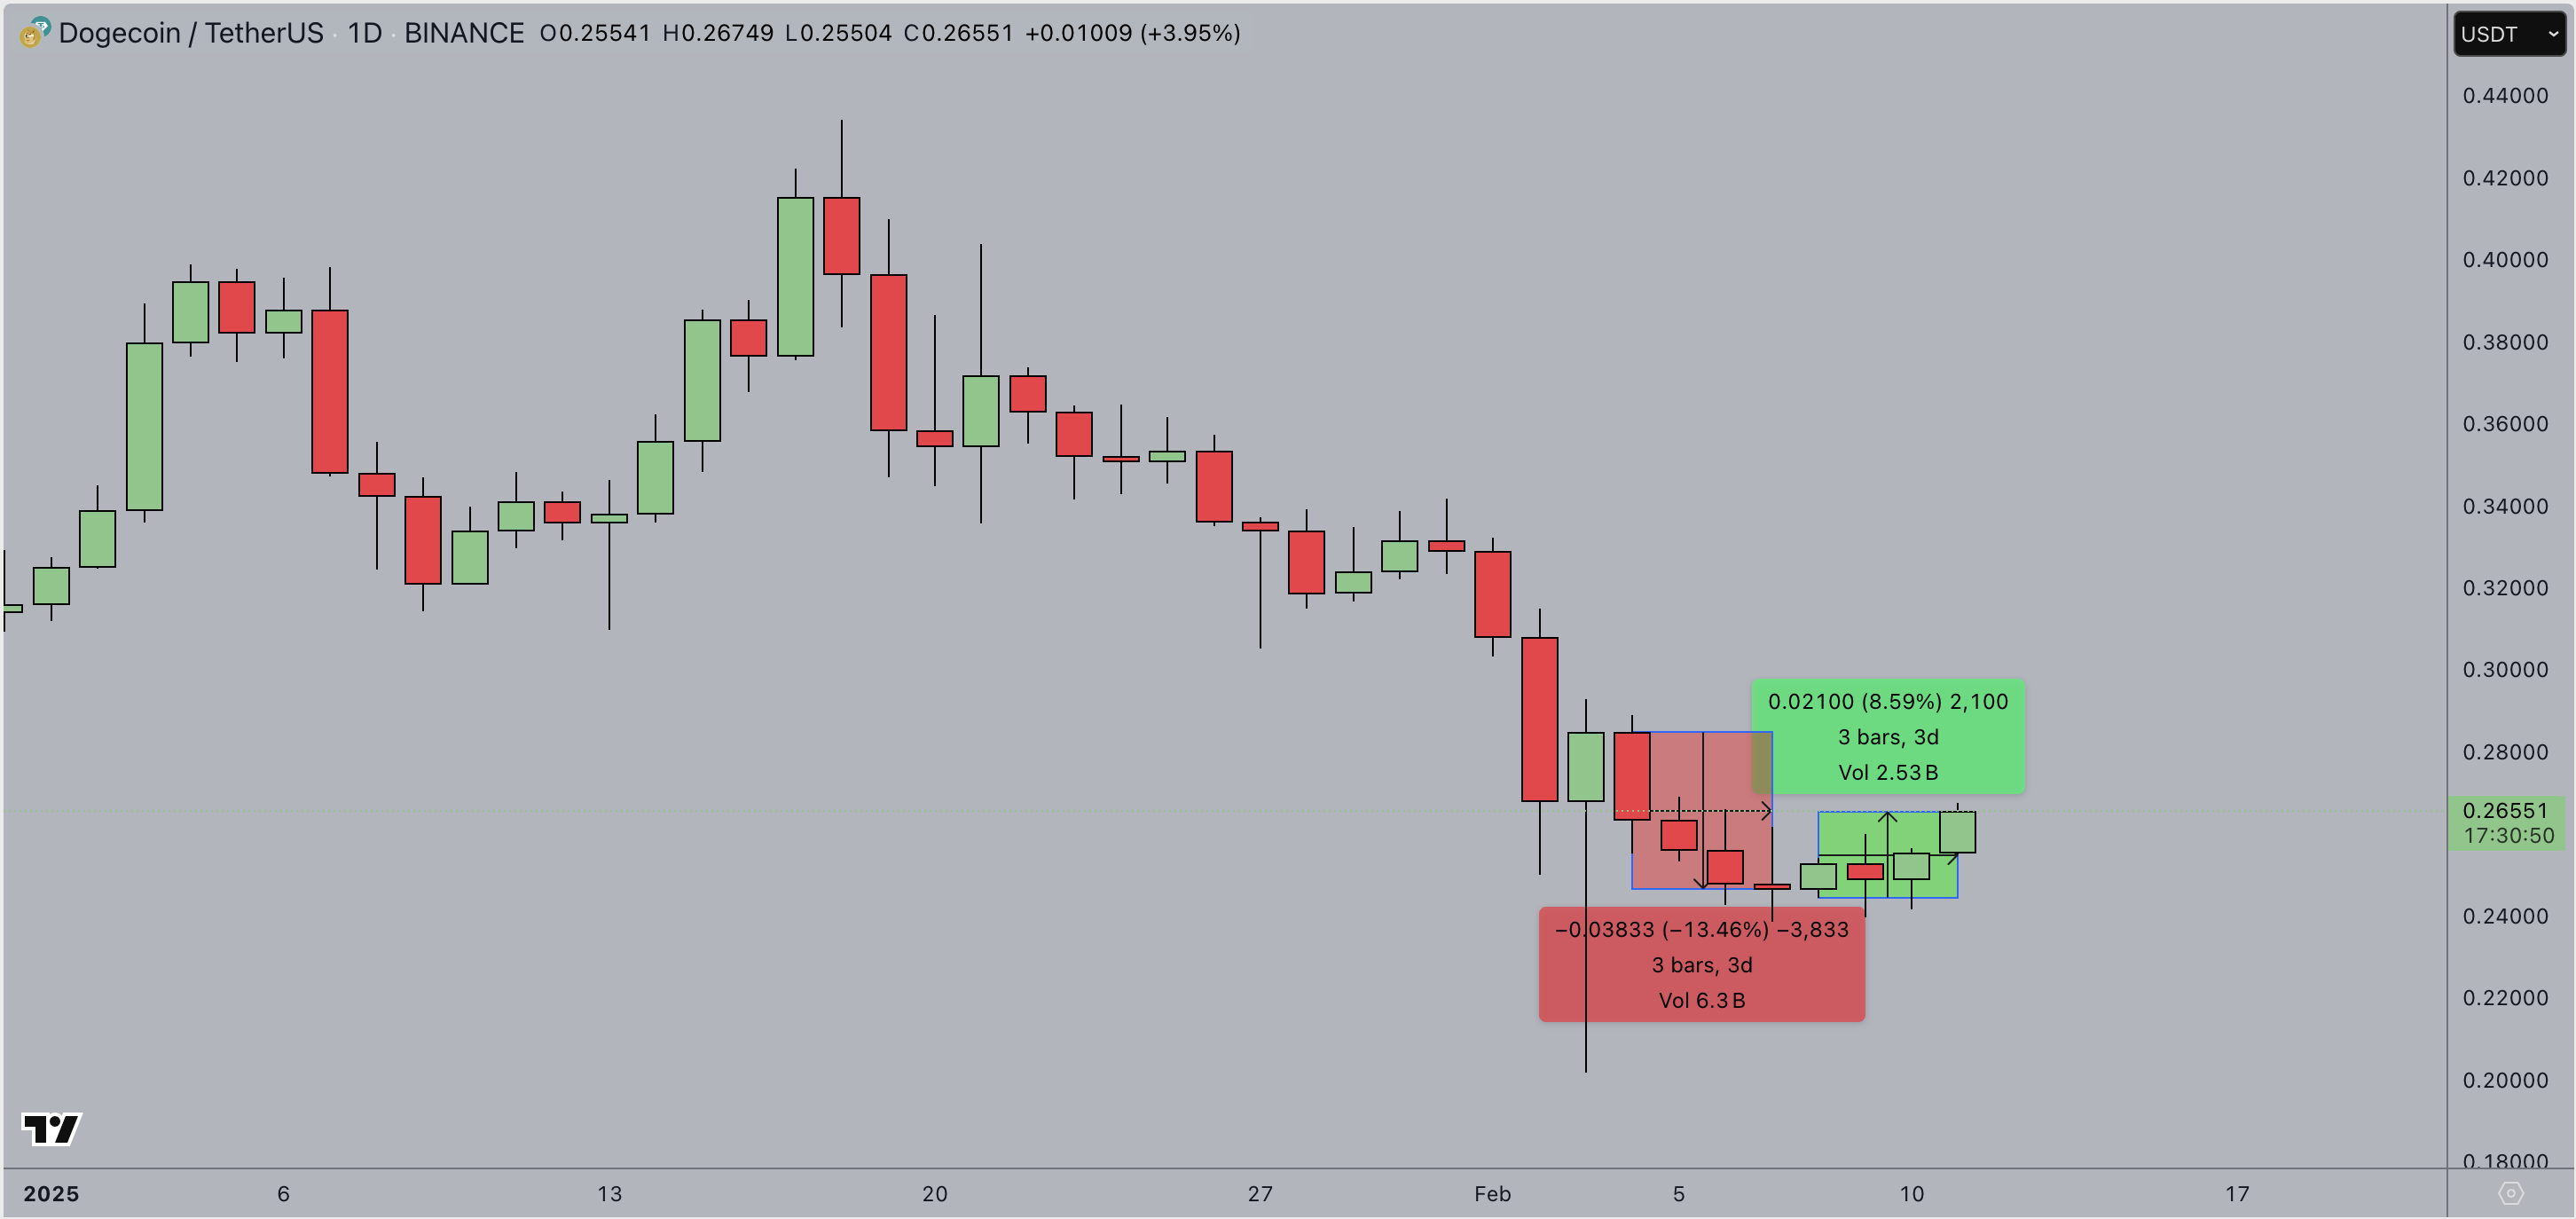
Dogecoin Price Forecast: $0.35 breakout ahead if this key resistance caves
Dogecoin’s price action shows a clear rebound within the lower boundary of the Keltner Channel, indicating the potential for a sustained rally.
If bullish momentum persists, DOGE could push past the $0.28 resistance and set its sights on the next key level at $0.30.
A decisive break above this zone could open the door for an extended rally toward $0.35.
Technical indicators support this outlook. The MACD histogram is transitioning from red to green, signaling a potential bullish crossover.
Additionally, the RSI is approaching neutral territory, leaving room for further upside before hitting overbought conditions.
Dogecoin Price Forecast | DOGEUSDT
On the bearish side, failure to hold above $0.26 could invite increased selling pressure, with a potential retracement to $0.24.
However, with strong derivatives market support and broader memecoin sector bullishness, the probability of a continued rally remains high.
Barring any macroeconomic shocks, Dogecoin’s price looks poised to extend its gains, with a possible breakout above $0.30 paving the way for a test of $0.35 in the coming days.
Bài viết đề xuất


