


Bitcoin Price Forecast: BTC risks deeper losses as the 200-day EMA comes under pressure
- Bitcoin trades near the key 200-day EMA on Tuesday, with a decisive close below potentially opening the door to deeper losses.
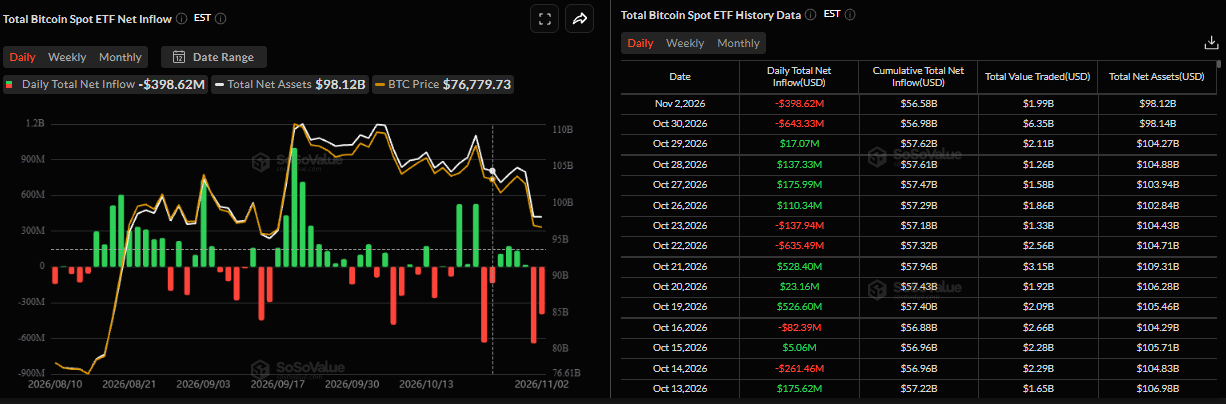
- US-listed BTC spot ETFs recorded net outflows of $398.62 million on Monday after last week’s withdrawals, pointing to weaker institutional demand.
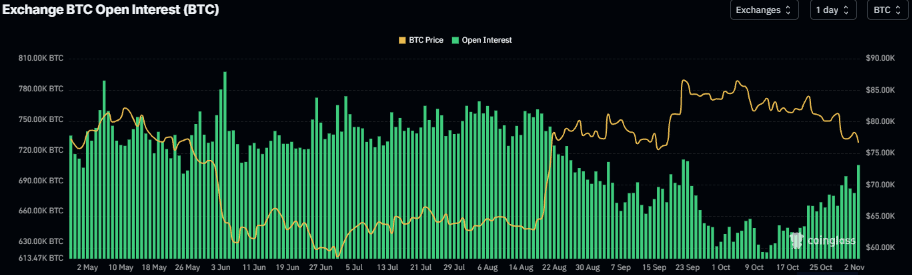
- Rising Open Interest alongside BTC’s falling price suggests growing bearish positioning, increasing downside risk.
Bitcoin (BTC) slips toward the key support zone around $76,455 on Tuesday, after falling nearly 2% the previous day. The largest cryptocurrency by market capitalization nears a make-or-break level, with a daily close below $76,455 suggesting a deeper breakdown. Institutional demand continues to fade, with spot Exchange Traded Funds (ETFs) recording an outflow of over $398 million on Monday after last week’s withdrawals.
Adding to this cautious outlook, rising Open Interest (OI) alongside falling prices suggests growing bearish positioning among BTC traders, further indicating the risk of a deeper correction.
Fading demand
Institutional demand continues to weaken so far this week. SoSoValue data showed that BTC spot ETFs recorded an outflow of $398.62 million on Monday following net outflows of $202.59 million last week, highlighting waning investor appetite. If this outflow trend continues and intensifies throughout this week, BTC could see a deeper correction.
Growing bearish positioning
Bitcoin’s derivatives metrics show growing bearish bias among traders. OI across all exchanges for BTC has been surging since mid-October, with outstanding contracts reaching 701.44K BTC on Tuesday, the highest level since September 23. The increase in OI alongside falling prices suggests that new short positions are entering the market, pointing to a bearish outlook and raising the potential for further downside for the Crypto King.
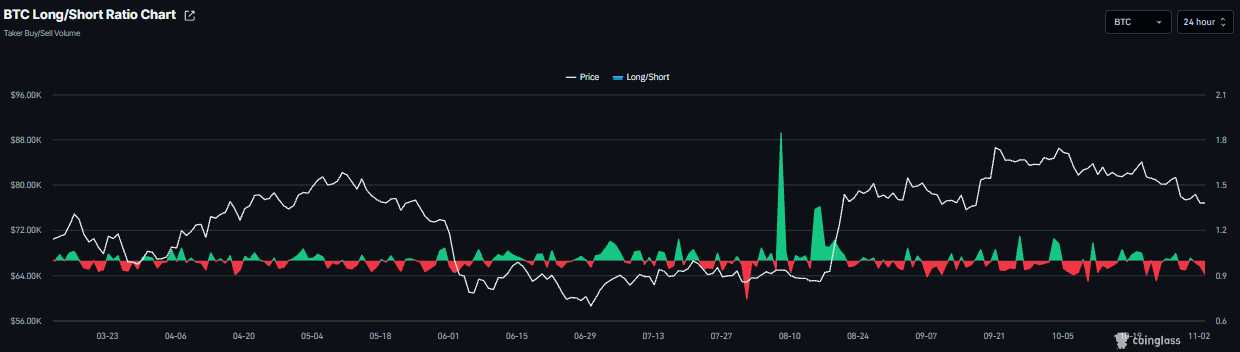
CoinGlass’ long-to-short ratio for BTC reads 0.91 on Tuesday, heading toward the lowest level over a month. A ratio below one indicates bearish sentiment, as traders bet that BTC prices will fall.
As explained in a previous report, historical data suggests that US congressional elections have negatively affected not only the President’s party but also Bitcoin.
Adding to the pressure, the fallout from last week’s Binance security breach continues to weigh on market sentiment, limiting BTC’s recovery attempts.
Bitcoin technical outlook: BTC nears make-or-break levels
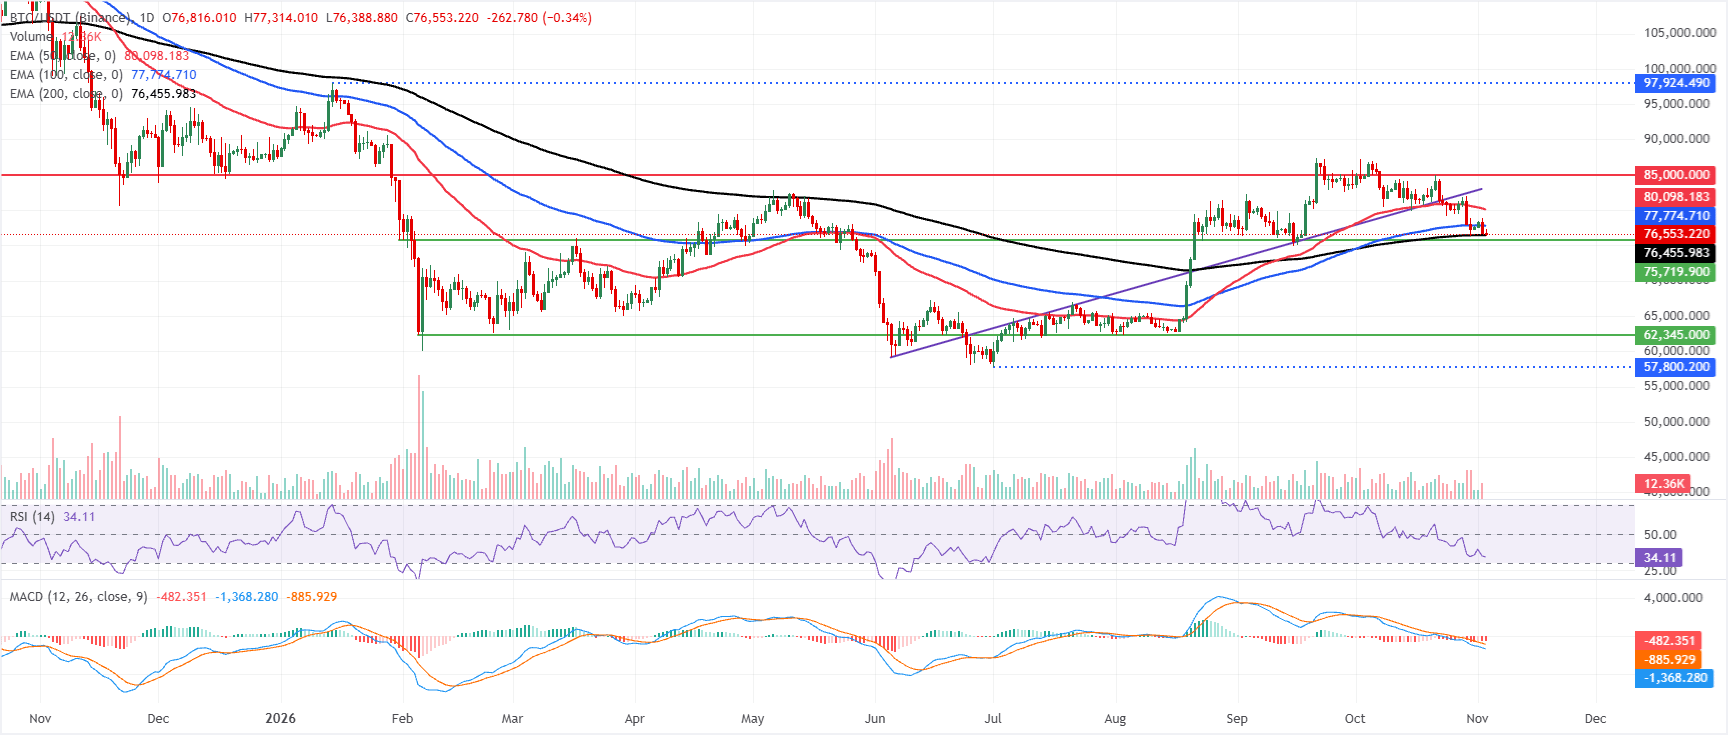
Bitcoin price trades at $76,553 at the time of writing, holding just above the 200-day Exponential Moving Average (EMA) at $76,455, while the 100-day EMA at $77,774 caps it. This positioning below the shorter EMAs signals a bearish near-term bias, with the Relative Strength Index (RSI) at 34 hovering near oversold territory on the daily chart and the Moving Average Convergence Divergence (MACD) histogram still negative, suggesting persistent downside pressure despite proximity to long-term trend support.
On the topside, initial resistance emerges at the 100-day EMA near $77,774, followed by the 50-day EMA at $80,098, with a more substantial barrier at the horizontal resistance zone around $85,000.
On the downside, immediate support is the 200-day EMA at $76,455. A sustained break below this level would likely expose BTC to a deeper corrective phase, while holding above it leaves scope for short-term rebounds toward the overhead moving averages.
(The technical analysis of this story was written with the help of an AI tool. Know more.)
Bitcoin, altcoins, stablecoins FAQs
Bitcoin is the largest cryptocurrency by market capitalization, a virtual currency designed to serve as money. This form of payment cannot be controlled by any one person, group, or entity, which eliminates the need for third-party participation during financial transactions.
Altcoins are any cryptocurrency apart from Bitcoin, but some also regard Ethereum as a non-altcoin because it is from these two cryptocurrencies that forking happens. If this is true, then Litecoin is the first altcoin, forked from the Bitcoin protocol and, therefore, an “improved” version of it.
Stablecoins are cryptocurrencies designed to have a stable price, with their value backed by a reserve of the asset it represents. To achieve this, the value of any one stablecoin is pegged to a commodity or financial instrument, such as the US Dollar (USD), with its supply regulated by an algorithm or demand. The main goal of stablecoins is to provide an on/off-ramp for investors willing to trade and invest in cryptocurrencies. Stablecoins also allow investors to store value since cryptocurrencies, in general, are subject to volatility.
Bitcoin dominance is the ratio of Bitcoin's market capitalization to the total market capitalization of all cryptocurrencies combined. It provides a clear picture of Bitcoin’s interest among investors. A high BTC dominance typically happens before and during a bull run, in which investors resort to investing in relatively stable and high market capitalization cryptocurrency like Bitcoin. A drop in BTC dominance usually means that investors are moving their capital and/or profits to altcoins in a quest for higher returns, which usually triggers an explosion of altcoin rallies.
Bài viết đề xuất


