

NEAR Protocol Price Forecast: Corrective phase develops as ETF flows signal weakening demand

Nguồn Fxstreet
  • NEAR Protocol falls 5% on Thursday, erasing most of the previous day's 6% surge.
  • Mixed NEAR-focused ETF flows this week suggest weaker buying pressure.
  • NEAR's technical outlook points to a corrective phase within the broader uptrend as upside momentum fades.

NEAR Protocol (NEAR) is down 5% at press time on Thursday, trading below $5.00 and wiping out most of the previous day's 6% recovery. NEAR-focused Exchange-Traded Fund (ETF) shows mixed flows this week, suggesting weaker buying pressure after three consecutive weeks of inflows. The technical outlook for NEAR is mixed as a corrective phase develops within a broader uptrend amid fading upside momentum.

Institutional appetite eases

Bitwise’s NEAR-focused ETF (NRR) is facing mixed inflows this week, suggesting flickering demand from institutional investors. SoSoValue data shows NRR recorded $830,700 in inflows on Wednesday, recovering from its first-ever day of selling, with $2.54 million in outflows on Tuesday.

The ETF also maintains a streak of three straight weekly inflows and has recorded $3.71 million so far this week, including the $5.42 million inflow on Monday. A positive close to the week could ease the fears of institutional investors backing out.
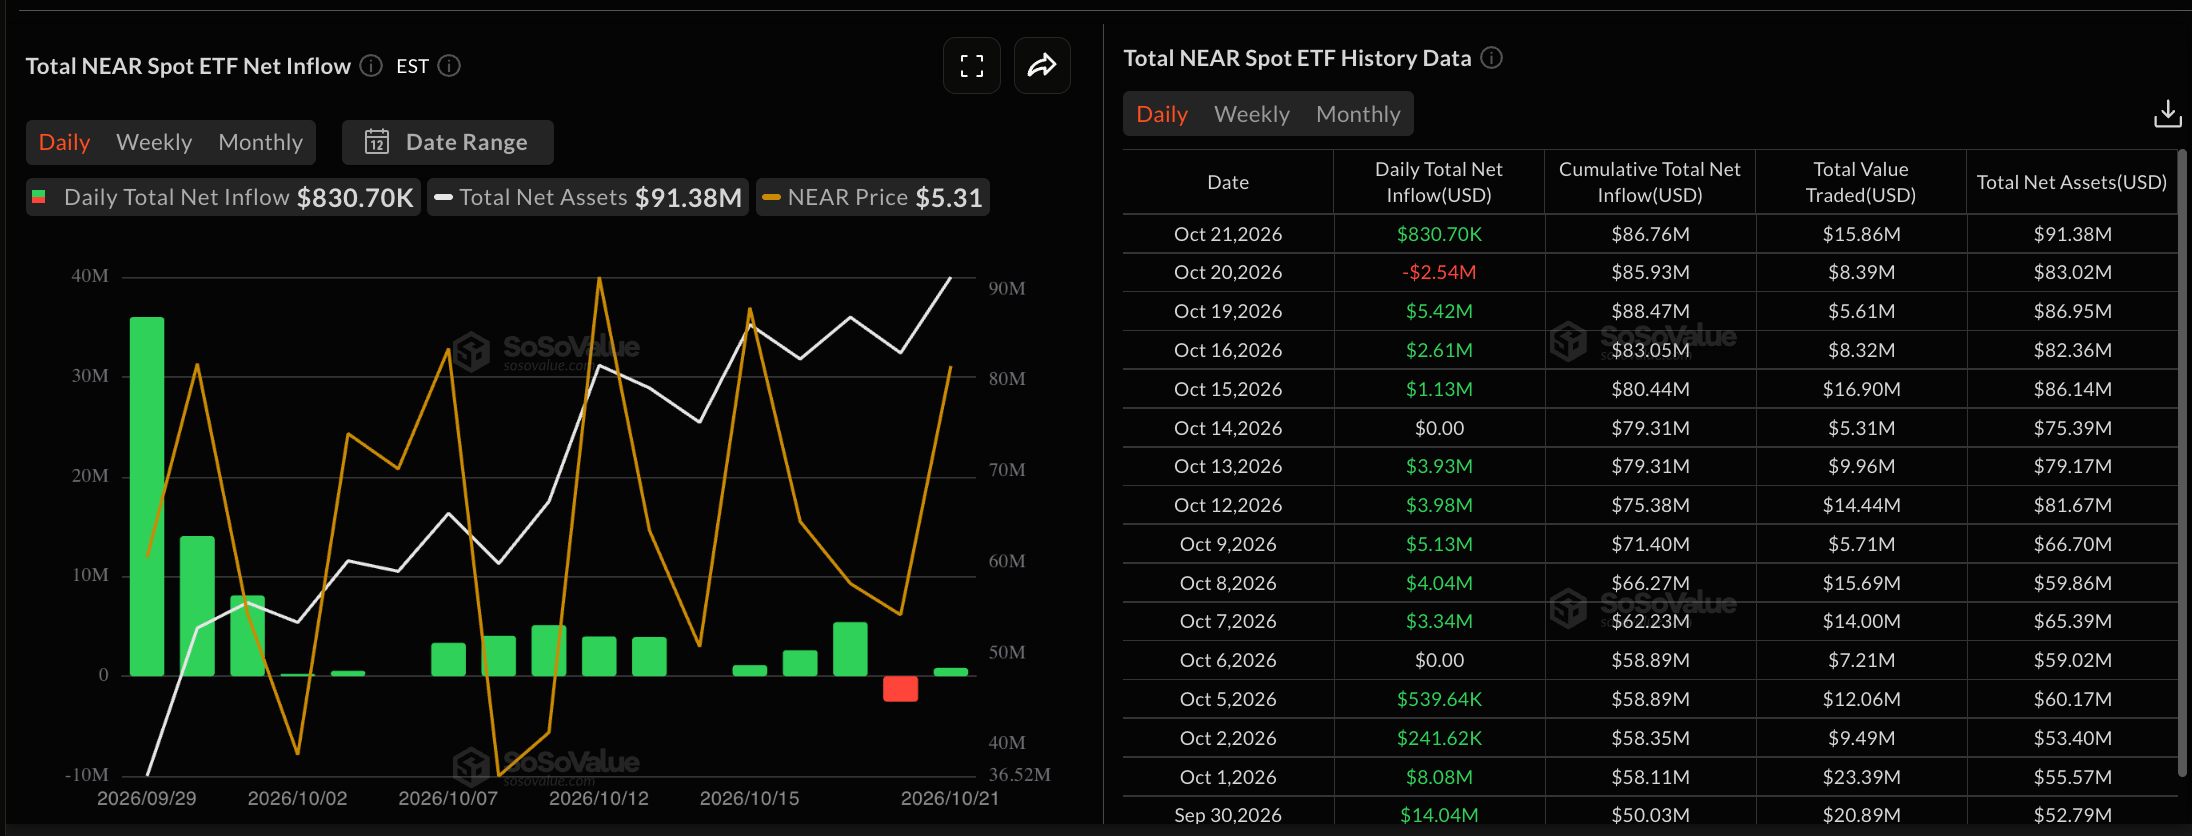
NEAR ETFs data. Source: Sosovalue

On the retail side, the NEAR futures Open Interest (OI) has increased to $1.67 billion on Thursday, up from $1.47 billion on Monday, suggesting a positional buildup this week. Typically, a steady rise in OI indicates a renewed appeal for NEAR among traders.
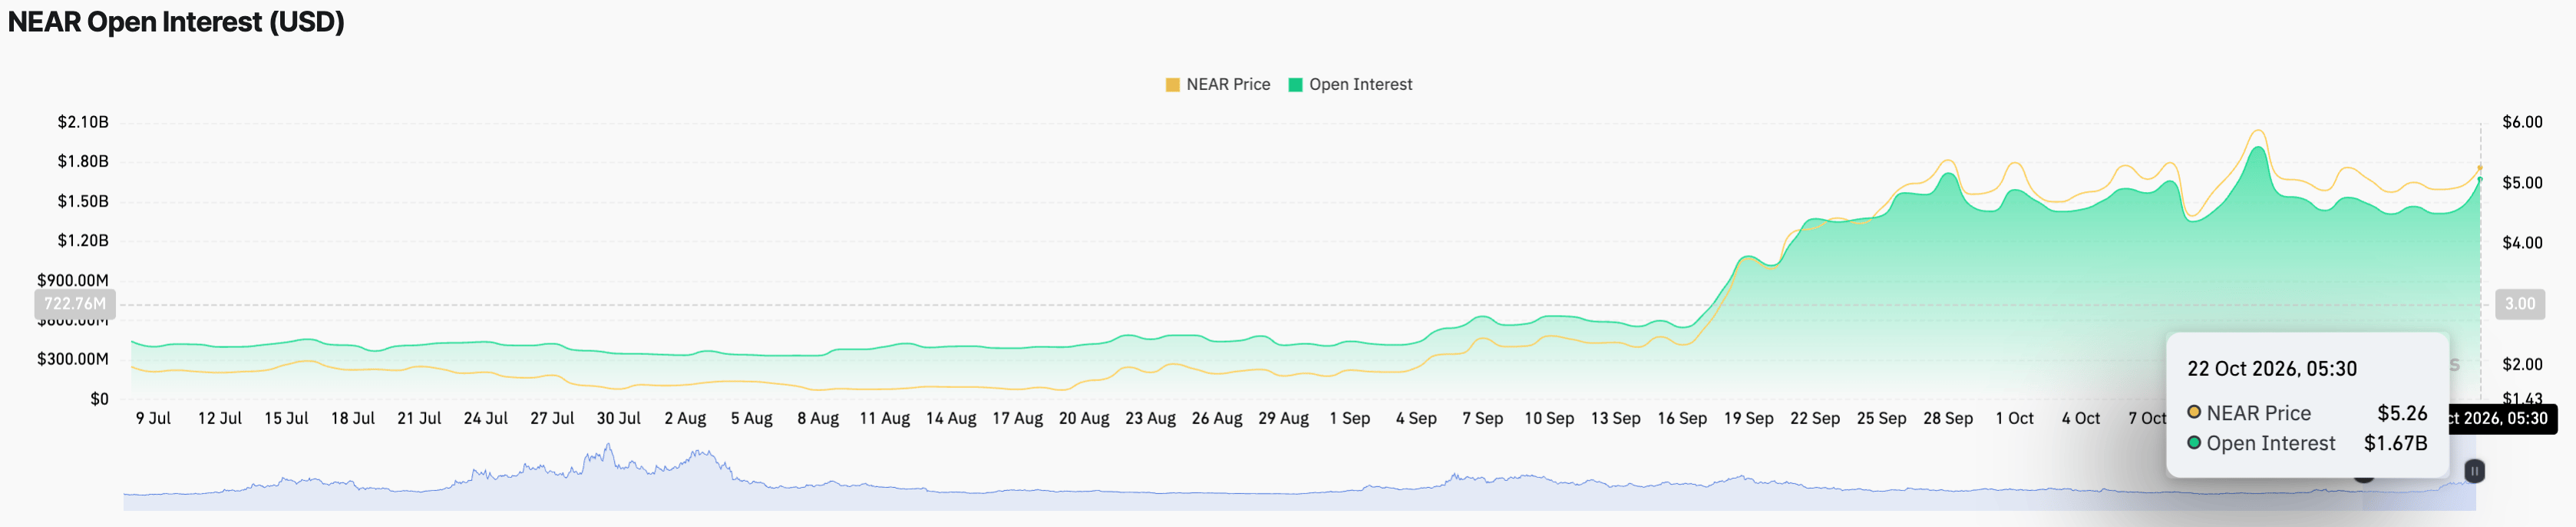
NEAR Open Interest data. Source: CoinGlass

Technical outlook: NEAR gains momentum on a pullback

NEAR trades at $4.99 at press time on Thursday, holding in a neutral but slightly capped stance. On the four-hour chart, the price sits below the 50-period Exponential Moving Average (EMA) at $5.03 but remains comfortably above the 200-period EMA at $4.61, suggesting consolidation within the broader uptrend.

Looking down, the rising support trendline near $4.70 underpins bullish strength at lower levels, reinforced by the 200-period EMA and the September 25 low at $4.44. A confirmed breakout below $4.44 could nullify the near-term support cluster, risking a steeper decline toward the $$3.91 support level set by the September 19 high.

The Moving Average Convergence Divergence (MACD) and signal line risk a bearish crossover on the four-hour chart, while the Relative Strength Index (RSI) hovers at 47, below the midline, hinting at fading bullish momentum.

To reinstate an upward trend, NEAR price must surpass the $5.44 resistance set by the October 15 high, which capped gains on Wednesday and resulted in a 5% decline so far today. This could open the path toward the October 12 high at $6.00.

Chart Analysis NEAR/USDT (Binance)
NEAR/USDT daily price chart.

(The technical analysis of this story was written with the help of an AI tool. Know more.)

Tuyên bố miễn trừ trách nhiệm: Chỉ dành cho mục đích thông tin. Hiệu suất trong quá khứ không đảm bảo cho kết quả trong tương lai.
placeholder
WTI đạt mức tăng khiêm tốn trên mức 88,50$ nhờ mức giảm bất ngờ của EIA, xung đột ở Trung Đông được chú ýWest Texas Intermediate (WTI), chuẩn dầu thô của Mỹ, đang giao dịch quanh mức 88,55$ trong đầu phiên giao dịch châu Á vào thứ Năm. WTI ghi nhận mức tăng khiêm tốn khi tồn kho dầu thô Mỹ bất ngờ giảm vào tuần trước
Tác giả  FXStreet
10 tháng 08 ngày Thứ Năm
West Texas Intermediate (WTI), chuẩn dầu thô của Mỹ, đang giao dịch quanh mức 88,55$ trong đầu phiên giao dịch châu Á vào thứ Năm. WTI ghi nhận mức tăng khiêm tốn khi tồn kho dầu thô Mỹ bất ngờ giảm vào tuần trước
placeholder
Forex hôm nay: Các cặp tiền tệ chính giữ ổn định khi bắt đầu tuần mớiĐây là những gì bạn cần biết vào thứ Hai, ngày 19 tháng 10:
Tác giả  FXStreet
10 tháng 19 ngày Thứ Hai
Đây là những gì bạn cần biết vào thứ Hai, ngày 19 tháng 10:
placeholder
Giá dầu trở lại mức 110 USD thúc đẩy kỳ vọng Fed tăng lãi suất, gây áp lực lên giá vàng ngày thứ tư liên tiếp hướng về mức 4.100 USDTrong phiên giao dịch ngày 21/10, giá vàng tiếp tục đà điều chỉnh, trong đó giá vàng (XAUUSD) trong phiên có thời điểm giảm xuống mức thấp 4.106 USD, tiến sát mốc 4.100 USD và đánh dấu ng
Tác giả  TradingKey
Hôm qua 08: 50
Trong phiên giao dịch ngày 21/10, giá vàng tiếp tục đà điều chỉnh, trong đó giá vàng (XAUUSD) trong phiên có thời điểm giảm xuống mức thấp 4.106 USD, tiến sát mốc 4.100 USD và đánh dấu ng
placeholder
Dự báo giá bạc: XAG/USD giảm xuống dưới 57,00$ khi dầu tăng vọt làm dấy lên lo ngại lạm phátGiá bạc (XAG/USD) mất giá trong ngày thứ hai liên tiếp, giao dịch quanh mức 56,80$ mỗi ounce troy trong giờ châu Á vào thứ Năm. Bạc không mang lại lợi nhuận đang đối mặt với thách thức khi giá dầu tăng vọt làm dấy lên lo ngại lạm phát và thúc đẩy kỳ vọng về việc Fed tăng lãi suất.
Tác giả  FXStreet
7 giờ trước
Giá bạc (XAG/USD) mất giá trong ngày thứ hai liên tiếp, giao dịch quanh mức 56,80$ mỗi ounce troy trong giờ châu Á vào thứ Năm. Bạc không mang lại lợi nhuận đang đối mặt với thách thức khi giá dầu tăng vọt làm dấy lên lo ngại lạm phát và thúc đẩy kỳ vọng về việc Fed tăng lãi suất.
placeholder
Giá vàng giảm xuống dưới 4.100 USD, có nguy cơ giảm xuống 4.000 USD khi giá dầu cao củng cố kỳ vọng Fed duy trì lãi suất cao Trong phiên giao dịch châu Á ngày 22/10, giá vàng (XAUUSD) tiếp tục suy yếu trong phiên, với giá vàng giao ngay giảm xuống dưới mốc 4.100 USD để chạm mức thấp 4.066,56 USD, mức thấp nhất
Tác giả  TradingKey
3 giờ trước
Trong phiên giao dịch châu Á ngày 22/10, giá vàng (XAUUSD) tiếp tục suy yếu trong phiên, với giá vàng giao ngay giảm xuống dưới mốc 4.100 USD để chạm mức thấp 4.066,56 USD, mức thấp nhất
goTop
quote