

Cardano Price Forecast: Weak momentum puts ADA recovery at risk

Nguồn Fxstreet
  • Cardano price trades below $0.222 on Thursday after failing to close above the 50-day EMA near $0.228 the previous day.
  • Weakening derivatives metrics continue to cap ADA recovery.
  • The technical outlook suggests fading momentum, with a close below the 100-day EMA support hinting at a deeper correction.

Cardano (ADA) is trading below $0.222 on Thursday after failing to sustain gains above the 50-day Exponential Moving Average (EMA) near $0.228 the previous day. Weakening derivatives metrics and fading bullish momentum continue to weigh on sentiment, while a break below the 100-day EMA could push ADA lower.

Weakening derivatives metrics cap Cardano

Derivatives data shows a cautious outlook for Cardano. CoinGlass’ long-to-short ratios for ADA read 0.79 on Thursday, nearing the lowest level over a month. A ratio below one indicates bearish sentiment, as traders bet that asset prices will fall.
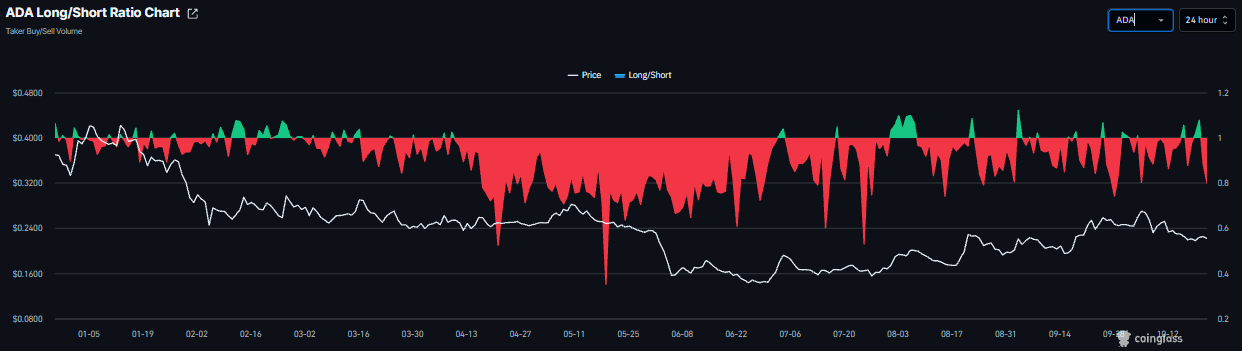
ADA long-to-short ratio chart. Source: Coinglass

In addition, Cardano’s funding rate flipped negative on Wednesday, reading -0.0025% on Thursday, indicating shorts are paying longs and suggesting a bearish outlook.
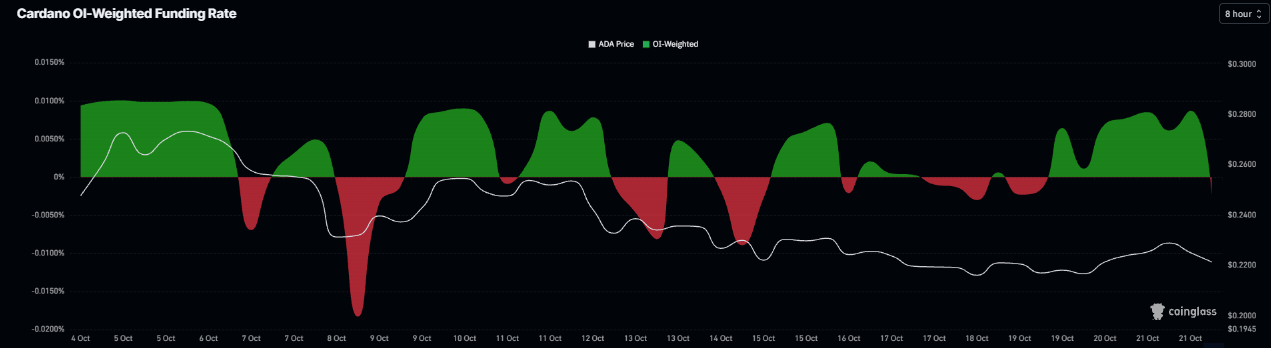
Cardano funding rates chart. Source: Coinglass

On-chain data shows bearish bias

CryptoQuant’s summary data shows a bearish outlook for Cardano. ADA’s futures markets show large whale orders alongside heating conditions. In addition, the spot and futures markets show sell-side dominance. These highlight a bearish, cautious sentiment bias among Cardano traders.
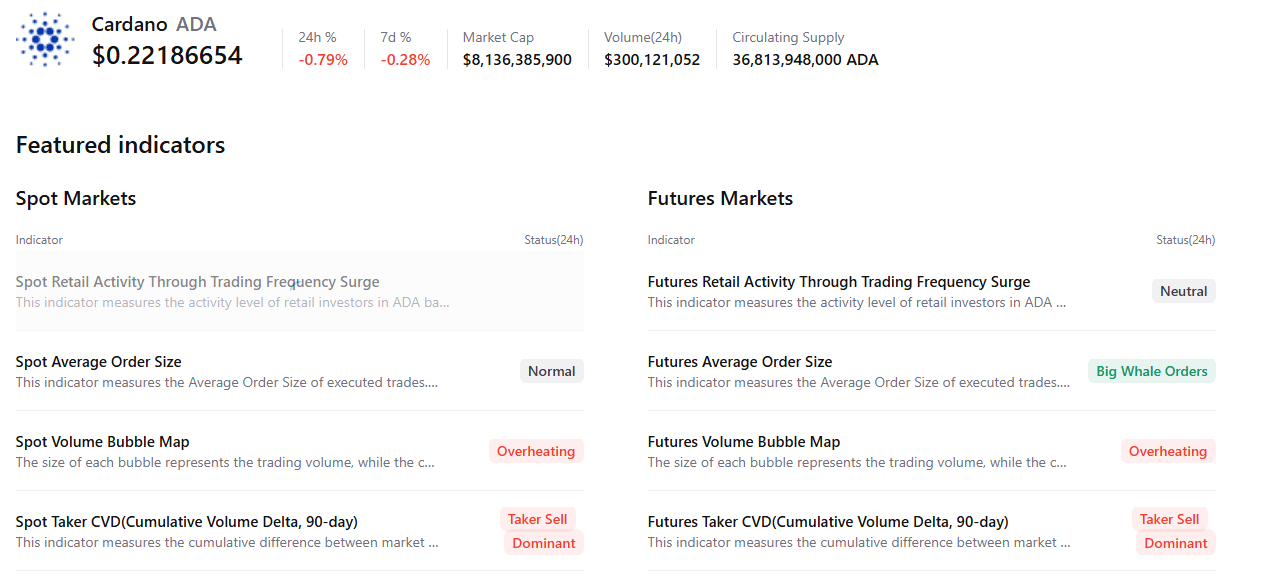
Cardano summary chart. Source: CryptoQuant

Cardano technical outlook: Weakening momentum indicators

Cardano price trades at $0.221 on Thursday, holding below its 50-day and 200-day Exponential Moving Averages (EMAs), which keeps the near-term bias tilted to the downside. ADA is hovering just above the 100-day EMA around $0.220, while the break of the rising support trend line near $0.210 hints that the broader corrective phase remains in play.

Momentum indicators back this cautious tone, with the Relative Strength Index (RSI) lingering in the low-40s and the Moving Average Convergence Divergence (MACD) still negative, suggesting downside pressure is fading but not yet reversed.

On the topside, initial resistance appears at the 50-day EMA near $0.230, followed by a horizontal barrier around $0.236 and the 200-day EMA near $0.240, with a stronger cap toward $0.250 and then $0.300.

On the downside, immediate support is reinforced by the 100-day EMA around $0.220, ahead of the former uptrend line-break region near $0.210; a sustained drop through that area would expose deeper trendline-memory support closer to $0.170.
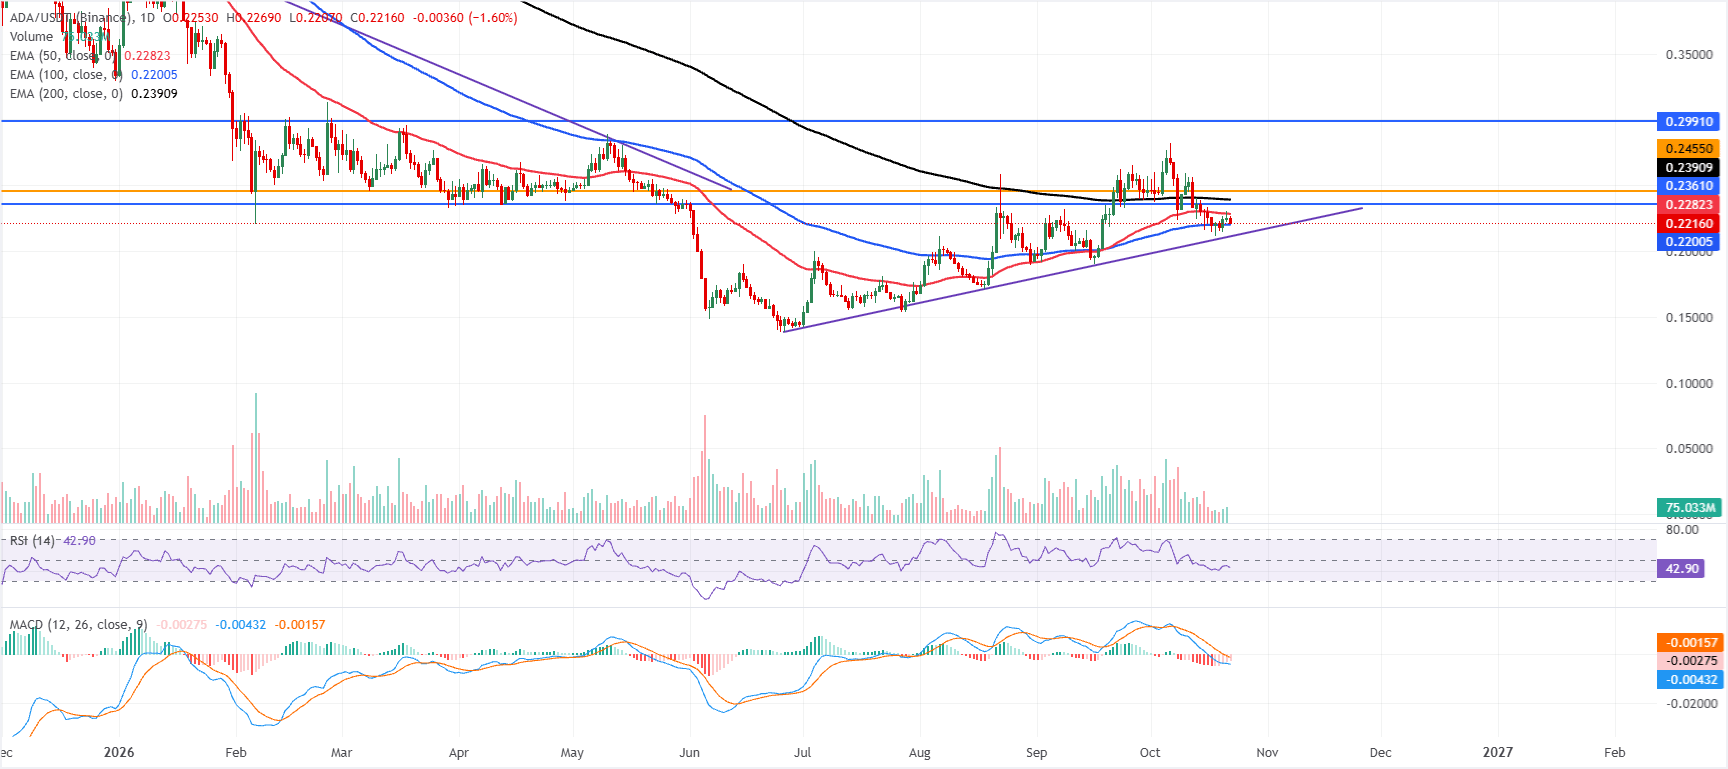
ADA/USDT daily chart

(The technical analysis of this story was written with the help of an AI tool. Know more.)

Tuyên bố miễn trừ trách nhiệm: Chỉ dành cho mục đích thông tin. Hiệu suất trong quá khứ không đảm bảo cho kết quả trong tương lai.
placeholder
WTI đạt mức tăng khiêm tốn trên mức 88,50$ nhờ mức giảm bất ngờ của EIA, xung đột ở Trung Đông được chú ýWest Texas Intermediate (WTI), chuẩn dầu thô của Mỹ, đang giao dịch quanh mức 88,55$ trong đầu phiên giao dịch châu Á vào thứ Năm. WTI ghi nhận mức tăng khiêm tốn khi tồn kho dầu thô Mỹ bất ngờ giảm vào tuần trước
Tác giả  FXStreet
10 tháng 08 ngày Thứ Năm
West Texas Intermediate (WTI), chuẩn dầu thô của Mỹ, đang giao dịch quanh mức 88,55$ trong đầu phiên giao dịch châu Á vào thứ Năm. WTI ghi nhận mức tăng khiêm tốn khi tồn kho dầu thô Mỹ bất ngờ giảm vào tuần trước
placeholder
WTI giảm xuống gần 97,50$ khi Mỹ miễn trừ các lệnh trừng phạt dầu mỏ đối với NgaGiá dầu West Texas Intermediate (WTI) giảm sau bảy ngày tăng, giao dịch quanh mức 97,40/thùng trong phiên giao dịch châu Á vào thứ Hai.
Tác giả  FXStreet
10 tháng 19 ngày Thứ Hai
Giá dầu West Texas Intermediate (WTI) giảm sau bảy ngày tăng, giao dịch quanh mức 97,40/thùng trong phiên giao dịch châu Á vào thứ Hai.
placeholder
Forex hôm nay: Các cặp tiền tệ chính giữ ổn định khi bắt đầu tuần mớiĐây là những gì bạn cần biết vào thứ Hai, ngày 19 tháng 10:
Tác giả  FXStreet
10 tháng 19 ngày Thứ Hai
Đây là những gì bạn cần biết vào thứ Hai, ngày 19 tháng 10:
placeholder
Giá dầu trở lại mức 110 USD thúc đẩy kỳ vọng Fed tăng lãi suất, gây áp lực lên giá vàng ngày thứ tư liên tiếp hướng về mức 4.100 USDTrong phiên giao dịch ngày 21/10, giá vàng tiếp tục đà điều chỉnh, trong đó giá vàng (XAUUSD) trong phiên có thời điểm giảm xuống mức thấp 4.106 USD, tiến sát mốc 4.100 USD và đánh dấu ng
Tác giả  TradingKey
20 giờ trước
Trong phiên giao dịch ngày 21/10, giá vàng tiếp tục đà điều chỉnh, trong đó giá vàng (XAUUSD) trong phiên có thời điểm giảm xuống mức thấp 4.106 USD, tiến sát mốc 4.100 USD và đánh dấu ng
placeholder
Dự báo giá bạc: XAG/USD giảm xuống dưới 57,00$ khi dầu tăng vọt làm dấy lên lo ngại lạm phátGiá bạc (XAG/USD) mất giá trong ngày thứ hai liên tiếp, giao dịch quanh mức 56,80$ mỗi ounce troy trong giờ châu Á vào thứ Năm. Bạc không mang lại lợi nhuận đang đối mặt với thách thức khi giá dầu tăng vọt làm dấy lên lo ngại lạm phát và thúc đẩy kỳ vọng về việc Fed tăng lãi suất.
Tác giả  FXStreet
2 giờ trước
Giá bạc (XAG/USD) mất giá trong ngày thứ hai liên tiếp, giao dịch quanh mức 56,80$ mỗi ounce troy trong giờ châu Á vào thứ Năm. Bạc không mang lại lợi nhuận đang đối mặt với thách thức khi giá dầu tăng vọt làm dấy lên lo ngại lạm phát và thúc đẩy kỳ vọng về việc Fed tăng lãi suất.
sản phẩm liên quan
goTop
quote